
1 引言
2 数据来源与方法介绍
2.1 干旱指数
2.2 CMIP6数据
表1 本研究使用的CMIP6气候模式Table 1 The CMIP6 climate models used in this study |
| 气候模式名称 Climate Model Name | 国家 Country | 网格分辨率 Grid |
|---|---|---|
| ACCESS-CM2 | 澳大利亚 | 192×145 |
| ACCESS-ESM1-5 | 澳大利亚 | 192×145 |
| BCC-CSM2-MR | 中国 | 320×160 |
| CanESM5 | 加拿大 | 128×64 |
| CMCC-CM2-SR5 | 意大利 | 288×192 |
| CMCC-ESM2 | 意大利 | 288×192 |
| FGOALS-f3-L | 中国 | 288×180 |
| IPSL-CM6A-LR | 法国 | 144×143 |
| MIROC6 | 日本 | 256×128 |
| MRI-ESM2-0 | 日本 | 320×160 |
2.3 植被类型数据
2.4 干旱区数据
2.5 气候区数据
2.6 Mann-Kendall趋势检验
2.7 SPEI指数计算
3 结果与讨论
3.1 全球陆地不同时间尺度的干旱变化特征
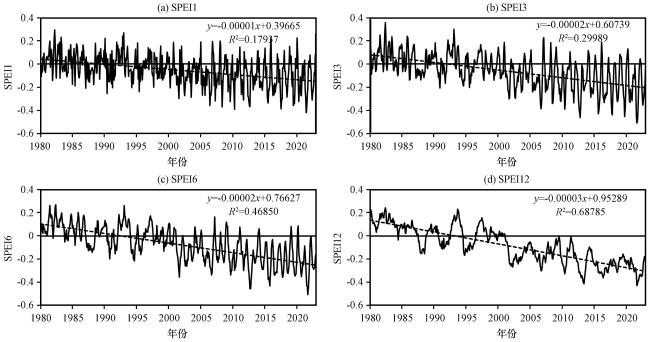
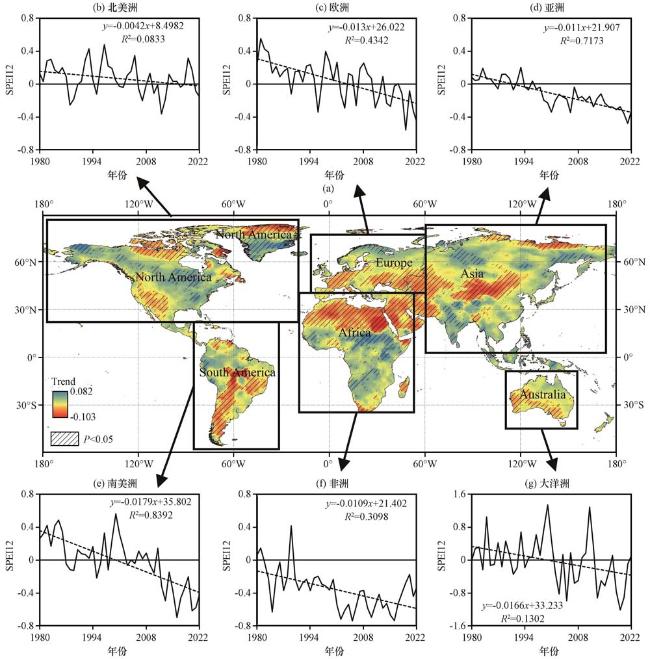
图2 1980 -2022年全球SPEI 12年均值的时空变化特征(a)及六大洲干旱度变化趋势(b~g)(b)北美洲, (c)欧洲, (d)亚洲, (e)南美洲, (f)非洲, (g)大洋洲; 黑色斜线区域表示相关系数通过了0.05显著性水平的检验 Fig.2 Characteristics of spatial and temporal variations of the global SPEI 12 year average from 1980 to 2022 (a) and trends of aridity in six continents (b~g).(b) North America, (c) Europe, (d) Asia, (e) South America, (f) Africa, (g) Oceania, The black diagonal area indicates that the correlation coefficient passed the test at the 0.05 significance level |
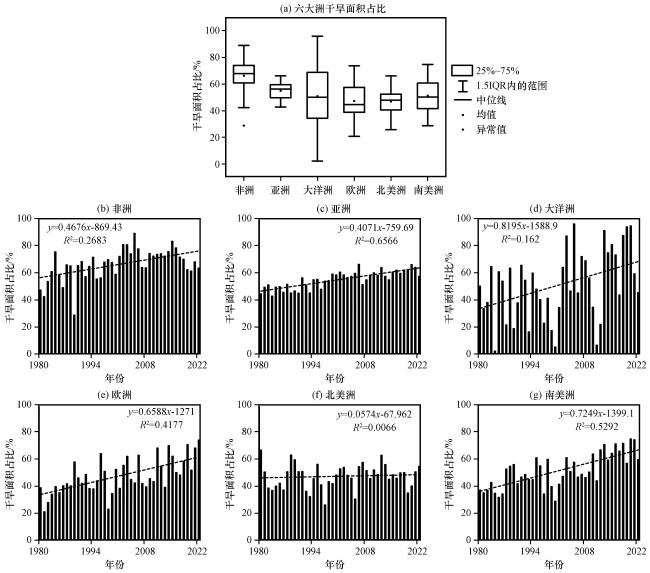
图3 基于SPEI12年均值的全球各大洲干旱区面积占比比较(a), 六大洲干旱区面积占比(b~g)(b)非洲, (c)亚洲, (d)大洋洲, (e)欧洲, (f)北美洲, (g)南美洲 Fig.3 Comparison of the area share of arid zones in each continent globally based on SPEI 12 year averages (a), and the area share of arid zones in six continents (b~g).(b) Africa, (c) Asia, (d) Oceania, (e) Europe, (f) North America, (g) South America |
3.2 全球陆地不同季节的干旱变化特征
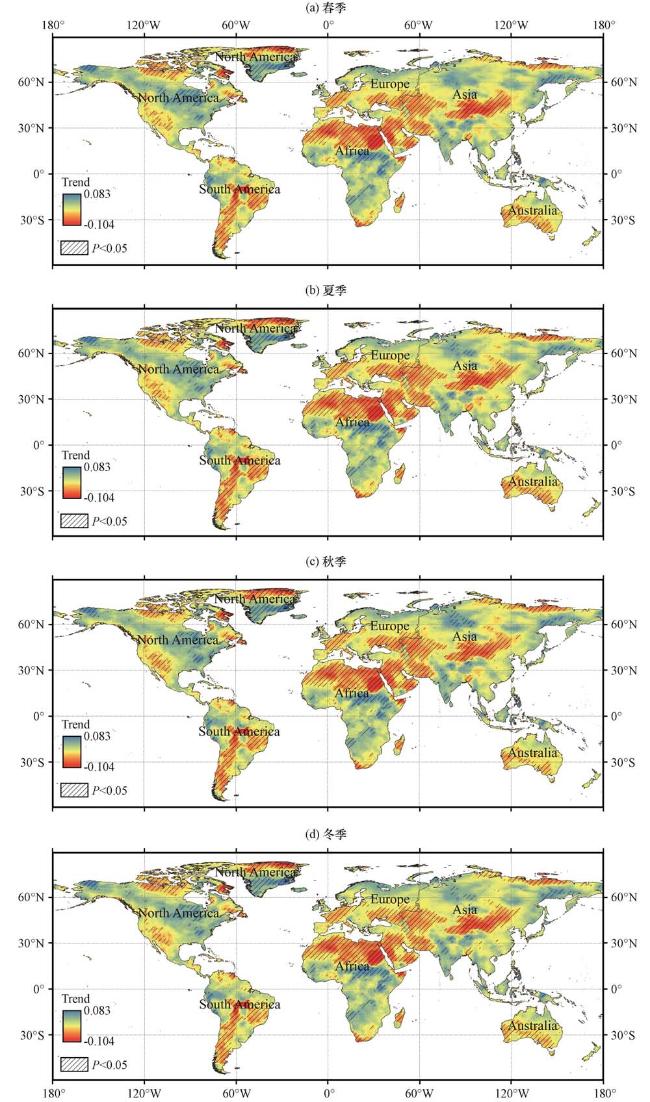
图4 1980 -2022年全球SPEI12年均值在不同季节的空间变化趋势(a)春季, (b)夏季, (c)秋季, (d)冬季; 黑色斜线区域表示相关系数通过了0.05显著性水平的检验 Fig.4 Spatial trends of global SPEI12 annual mean values in different seasons from 1980 to 2022(a) spring, (b) summer, (c) autumn, (d) winter.The black slash area indicates that the correlation coefficients passed the test at the 0.05 significance level |
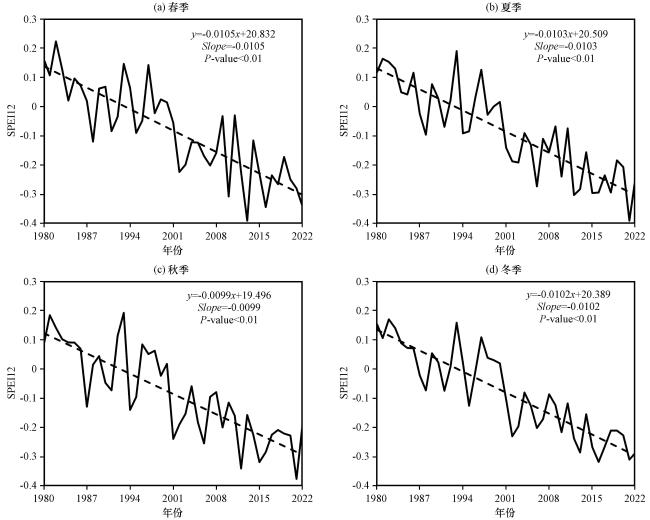
表2 1980 -2022年全球各季SPEI12趋势的面积百分比Table 2 The percentage trend of global seasonal SPEI12 from 1980 to 2022 |
| 季节 | 显著变干旱/% | 无明显趋势/% | 显著变湿润/% |
|---|---|---|---|
| 春季 | 27.8 | 65.3 | 6.9 |
| 夏季 | 29.7 | 63.0 | 7.3 |
| 秋季 | 28.5 | 64.8 | 6.7 |
| 冬季 | 33.2 | 56.5 | 10.3 |
3.3 SPEI在不同土地覆盖类型的变化特征
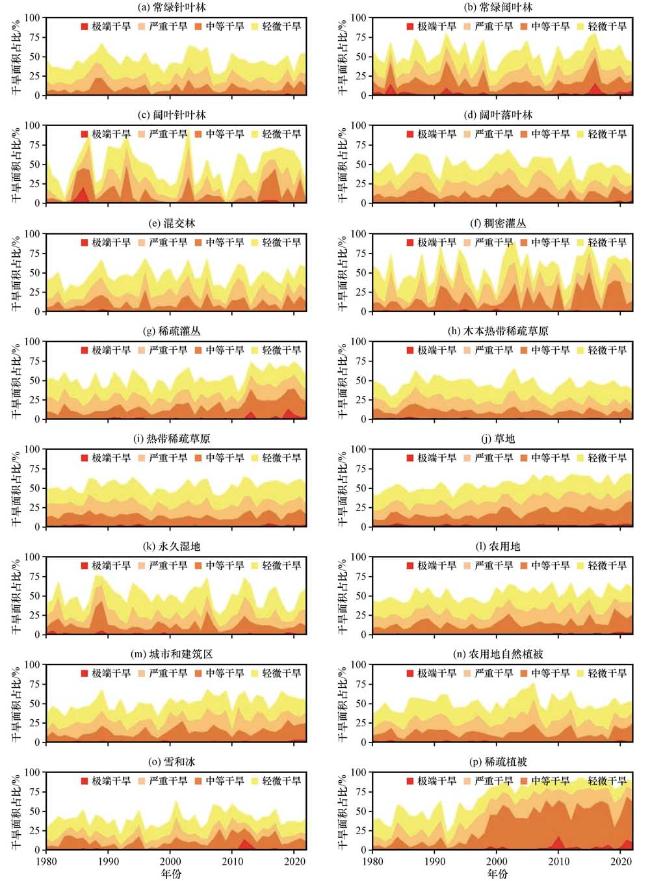
图7 1980 -2022年不同植被覆盖类型区干旱面积占比的变化特征(a)常绿针叶林, (b)常绿阔叶林, (c)落叶针叶林, (d)落叶阔叶林, (e)混交林, (f)稠密灌丛, (g)稀疏灌丛, (h)木本热带稀疏草原, (i)热带稀疏草原, (j)草地, (k)永久湿地, (l)农用地, (m)城市和建筑区, (n)农用地自然植被, (o)雪和冰, (p)稀疏植被 Fig.7 Variation characteristics of the proportion of drought-prone areas for different vegetation cover types from 1980 to 2022(a) Evergreen Needleleaf Forest, (b) Evergreen Broadleaf Forest, (c) Deciduous Needleleaf Forest, (d) Deciduous Broadleaf Forest, (e) Mixed Forest, (f) Closed Shrubland, (g) Open Shrubland, (h) Woody Savannas, (i) Savannas, (j) Grassland, (k) Permanent Wetland, (l) Cropland, (m) Urban and Built-Up, (n) Cropland/Natural Vegetation Mosaic, (o) Snow and Ice, (p) Barren or Sparsely Vegetated |
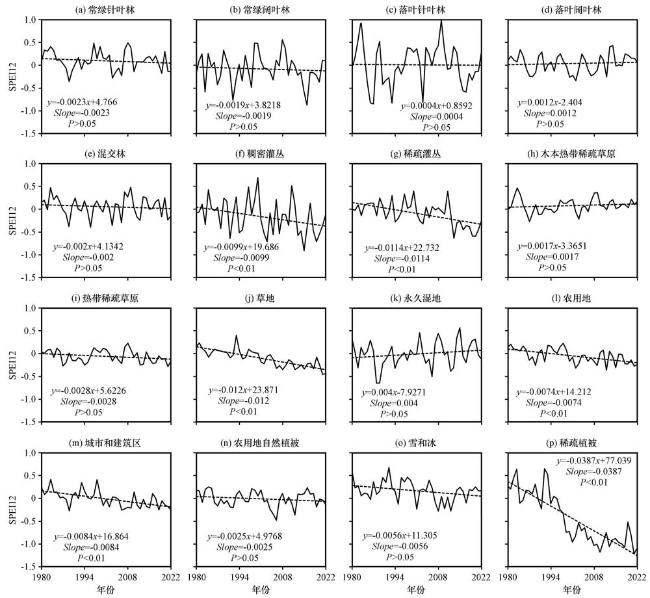
图8 1980 -2022年不同土地覆盖类型区SPEI指数年均值的年际变化趋势(a)常绿针叶林, (b)常绿阔叶林, (c)落叶针叶林, (d)落叶阔叶林, (e)混交林, (f)稠密灌丛, (g)稀疏灌丛, (h)木本热带稀疏草原, (i)热带稀疏草原, (j)草地, (k)永久湿地, (l)农用地, (m)城市和建筑区, (n)农用地自然植被, (o)雪和冰, (p)稀疏植被 Fig.8 The SPEI trend across different land cover types from 1980 to 2022.(a) Evergreen Needleleaf Forest, (b) Evergreen Broadleaf Forest, (c) Deciduous Needleleaf Forest, (d) Deciduous Broadleaf Forest, (e) Mixed Forest, (f) Closed Shrubland, (g) Open Shrubland, (h) Woody Savannas, (i) Savannas, (j) Grassland, (k) Permanent Wetland, (l) Cropland, (m) Urban and Built-Up, (n) Cropland/Natural Vegetation Mosaic, (o) Snow and Ice, (p) Barren or Sparsely Vegetated |
3.4 SPEI在不同气候类型的变化特征
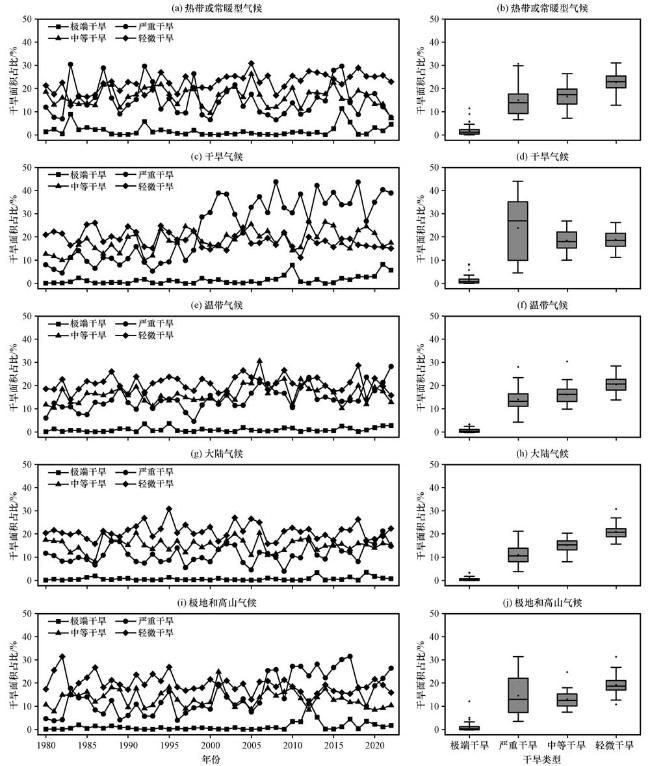
图9 全球陆地不同气候区的不同干旱程度面积占比年际变化趋势(a, c, e, g, i)及比较(b, d, f, h, j)(a, b)热带或常暖型气候, (c, d)干旱气候, (e, f)温带气候, (g, h)大陆气候, (i, j)极地和高山气候 Fig.9 Interannual trends in the area share of different degrees of aridity in different climatic zones of the global land mass (a, c, e, g, i) and comparisons (b, d, f, h, j).(a, b) Tropical or often warm climates, (c, d) Arid climates, (e, f) Temperate climates, (g, h) Continental climates, (i, j) Polar and alpine climates |
3.5 SPEI在不同干湿区类型的变化特征
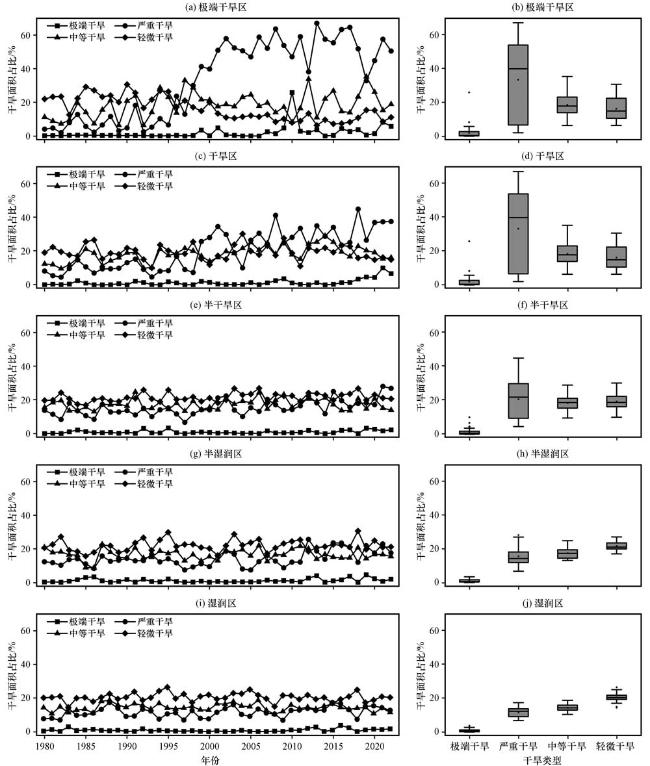
图10 全球陆地不同干旱区的不同干旱程度面积占比年际变化趋势(a, c, e, g, i)及比较(b, d, f, h, j)(a, b)极端干旱区, (c, d)干旱区, (e, f)半干旱区, (g, h)半湿润区, (i, j)湿润区 Fig.10 Interannual trends in the area share of different aridity levels in different arid zones of the global landmass (a, c, e, g, i) and comparisons (b, d, f, h, j).(a, b) extreme arid zone, (c, d) arid zone, (e, f) semi-arid zone, (g, h) semi-humid zone, (i, j) humid zone |
3.6 全球陆地未来干旱变化趋势
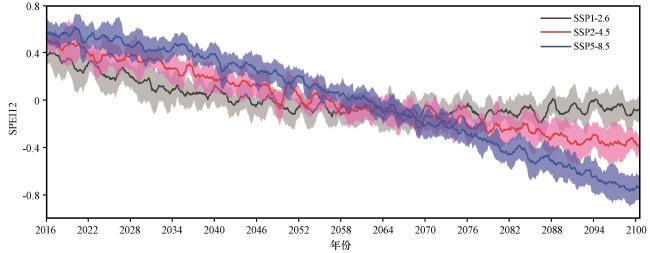
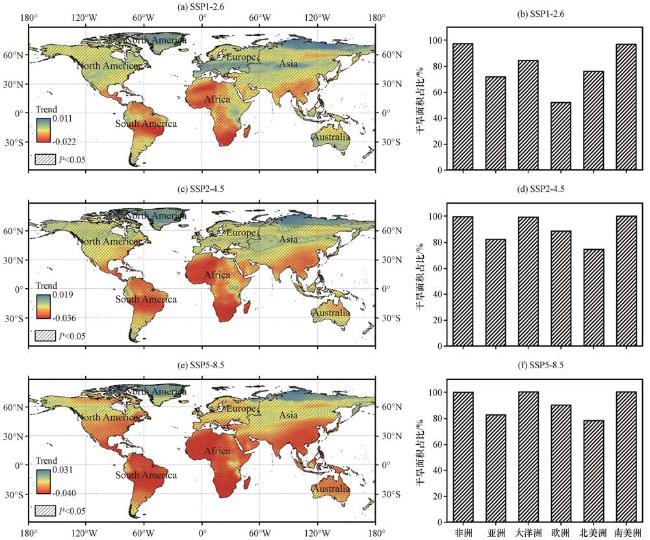
图12 2016 -2100年三种SSP情景下SPEI 12年均值的空间变化趋势(a, c, e)及各大洲干旱面积占比(b, d, f)(a、 b) SSP1-2.6, (c、 d) SSP2-4.5, (e、 f) SSP5-8.5; 黑色斜线区域表示相关系数通过了0.05显著性水平的检验 Fig.12 Spatial trends of SPEI12 annual mean values under three SSP scenarios from 2016 to 2100(a, c, e) and the percentage of drought area in each continent (b, d, f).(a, b) SSP1-2.6, (c, d) SSP2-4.5, (e, f) SSP5-8.5.The black diagonal area indicates that the correlation coefficients passed the test at the 0.05 significance level |
表3 2016 -2100年全球陆地SPEI12年均值的趋势百分比Table 3 Percentage trends of global seasonal SPEI12 from 2016 to 2100 |
| 排放情景 | 显著变干旱/% | 无明显趋势/% | 显著变湿润/% |
|---|---|---|---|
| SSP1-2.6 | 63.7 | 24.7 | 11.6 |
| SSP2-4.5 | 77.9 | 10.8 | 11.3 |
| SSP5-8.5 | 82.8 | 6.9 | 10.3 |
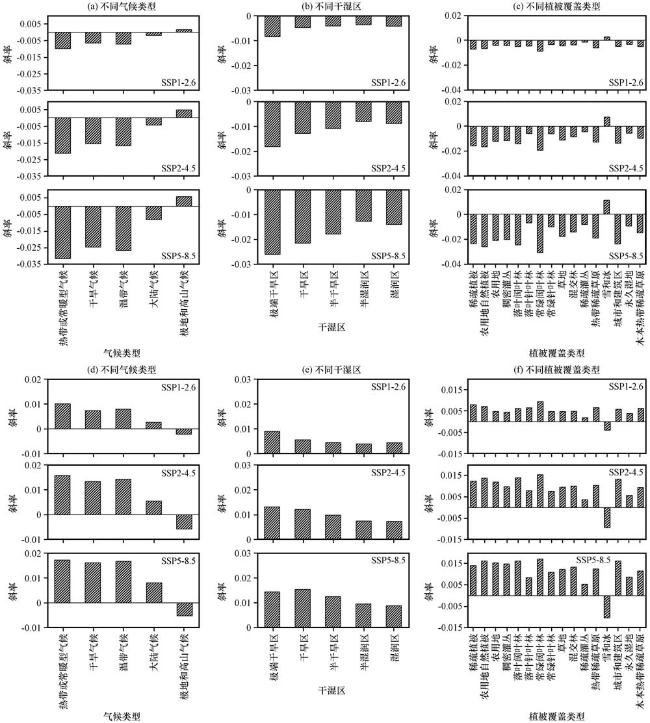
图13 2016 -2100年三种SSP情景下SPEI指数(a, b, c)与干旱面积占比(d, e, f)在不同地理条件下随时间变化的斜率统计(a, d)不同气候类型, (b, e)不同干湿区, (c, f)不同植被覆盖类型 Fig.13 Slope statistics of SPEI index (a, b, c) versus percentage of dry area (d, e, f) over time under different geographical conditions for three SSP scenarios, 2016 -2100.(a, d)different climate types, (b, e) different dry and wet areas, (c, f) different vegetation cover types |