2. 南京信息工程大学地理与遥感学院, 南京 210044
地表热力性质的不均匀分布是大气环流的主要驱动因子之一, 因此土壤温度作为土壤热力性质的重要组成部分, 能够综合地反映地面与大气之间的能量分配、交换以及水分循环等陆面过程状况 (Lin, 1980; Holmes et al, 2008; Bilgili et al, 2013; 张强, 1998; 秦艳慧等, 2015)。土壤温度的精确观测、模拟及预测等参数化过程是研究地-气相互作用, 中尺度陆面模式, 数值天气预报和气候预测中的重要环节, 一直以来受到国内外的广泛关注 (刘树华等, 1995; Zeng and Dickinson, 1998; Gao et al, 2000, 2004; 任图生等, 2004a, 2004b; Zhang Y et al, 2005; Jebamalar et al, 2012; 王愚等, 2013)。
青藏高原特有的地理位置和地形高度形成了独特的高原热力和动力作用, 对中国以及整个亚洲季风系统乃至全球气候系统中的能量收支平衡和水分动态循环产生了重要影响 (秦艳慧等, 2015; 王愚等, 2013; Krishnamurti and Ramanathan, 1982; Wu and Ni, 1999; 李燕等, 2012)。为了进一步了解青藏高原地区土壤热性质及其地表热平衡的时空分布, 需详细分析其相关土壤物理参数, 从而为模拟该地区的地-气相互作用、天气过程等提供更好的参数化方案 (Gao et al, 2000, 2004; Wu et al, 2013)。确定土壤的三个基本热力学参数:土壤热扩散率、土壤热传导率和土壤体积热容量是准确模拟土壤温度的关键 (缪育聪等, 2012)。其中, 土壤体积热容量是单位体积土壤温度升高 (降低)1 ℃所吸收 (释放) 的热量, 由土壤的物质组成所决定 (Van Wijk and De Vires, 1963); 土壤热扩散率则描述了土壤温度随边界条件变化的瞬时过程 (de Silans et al, 1996); 土壤热传导率是指土壤将所吸收的热量传递到邻近土层能力的大小, 是研究土壤水、热、盐耦合运动所必需的参数。由于热传导率的大小由各环境因子共同决定, 往往难以正确估计其值, 而它又可以通过土壤体积热容量和热扩散率的乘积求得, 因此在土壤热力学性质的研究中, 通常只考虑土壤热扩散率。
长期以来, 国内外学者认为热传导作用是土壤热传输的唯一机制, 而事实上, 土壤温度的变化不仅受到土壤热传导作用的影响, 还与土壤中液态水垂直运动所引起的热对流作用有关 (de Silans et al, 1996; Gao Z et al, 2003; Koo and Song, 2008; Neena et al, 2014)。大量的研究工作表明, 土壤含水量是控制陆面过程的一个关键因子, 土壤水分精确的观测和模拟结果将对土壤温度, 热通量, 地气间的感热、潜热通量以及气候变化等的研究工作产生重要影响 (张强, 1998; 陈星等, 2014; 熊建胜等, 2014)。Shao et al (1998)在热传导方程中考虑了土壤液态水通量密度的日变化来模拟土壤温度, 与实测值对比分析后, 发现模拟结果与实测资料较为一致。Gao et al (2003, 2005) 利用一维耦合热传导-对流方程定量分析了土壤中液态水的垂直运动对土壤温度的影响, 给出了其解析解并用黄土高原资料验证后发现考虑热对流项后提高了温度模拟的精度, 同时假设液态水通量密度在非零的条件下反算出了土壤热扩散率k和液态水通量密度W的值。
本文将分别利用耦合热传导-对流法 (Gao et al, 2003) 以及位相法和振幅法, 对青藏高原理塘地区地表过程野外观测试验采集的土壤温度资料进行模拟分析, 准确获取该地区的土壤热参数, 并通过比较土壤温度模拟值与实际观测值来验证耦合热传导-对流法的可靠性。
2.1 热传导对于某一薄层土壤而言, 厚度为Δz, 在不考虑水平方向的热传导作用的条件下, 根据能量守恒定律, 单位时间流入的热量与流出的热量差等于该单元土体内的热量变化,
| $ - \frac{{\partial G}}{{\partial z}} \cdot \Delta x \cdot \Delta y \cdot \Delta z = {C_g}\frac{{\partial T}}{{\partial t}} \cdot \Delta x \cdot \Delta y \cdot \Delta z\;\;, $ | (1) |
即,
| $ - \frac{{\partial G}}{{\partial z}} = {C_g}\frac{{\partial T}}{{\partial t}}\;\;, $ | (2) |
其中: G(z, t) 为土壤热通量 (单位: W·m-2), Cg为土壤体积热容量 (单位: J·m-3·K-1), T为土壤温度 (单位: ℃), t为时间, z(m) 为土壤中垂直坐标 (向下为正)。方程左边是单位体积土壤中由分子传导作用引起的能量输入量与输出量差, 右边是该土体中能量随时间的变化量。若视土壤热性质在水平方向上均一, 且分子传导作用是土壤热传输的唯一过程, 则任一土壤深度z上的热通量G(z, t) 用热传导傅里叶定律可描述为:
| $ G = - \lambda \frac{{\partial T}}{{\partial z}}\;\;, $ | (3) |
其中:负号表示热流方向与梯度方向相反, λ为土壤热传导率 (单位: W·m-1·K-1)。若对所研究的土壤做如下假设: (1) 各向同性、均一; (2) 土壤水分含量随土壤深度的变化可以忽略不计; (3) 土壤中的能量交换仅发生在垂直方向上, 则根据式 (2) 和 (3) 可得:
| $ {C_g}\frac{{\partial T}}{{\partial t}} = \lambda \frac{{{\partial ^2}T}}{{\partial {z^2}}}\;\;, $ | (4) |
即,
| $ \frac{{\partial T}}{{\partial t}} = k\frac{{{\partial ^2}T}}{{\partial {z^2}}}\;\;, $ | (5) |
其中:
研究表明, 土壤中由液态水的垂直运动所引起的热对流作用对土壤温度的影响极其重要 (de Silans et al, 1996; Gao et al, 2003)。假设单位时间内垂直通过单位面积的液态水所造成的热量为Qv, 水的垂直运动速度为w(向上为正), 则
| $ {Q_v} = - {C_w}\theta \Delta T\;\;, $ | (6) |
其中: Cw为液态水热容量 (单位: J·kg-1·K-1), θ为土壤含水量, ΔT为土壤中垂直方向上的水温差。由热力学第二定律可得:
| $ {C_g}\frac{{\partial T}}{{\partial t}} = - \frac{{\partial {Q_v}}}{{\partial z}}\;\;, $ | (7) |
方程左边是单位体积土壤内能量随时间的变化量, 右边是由于液态水垂直运动引起的能量输入量与输出量差。根据式 (6) 和 (7) 得:
| $ \frac{{\partial T}}{{\partial t}} = \frac{{{C_w}}}{{{C_g}}}w\theta \frac{{\partial T}}{{\partial z}}\;\;, $ | (8) |
即,
| $ \frac{{\partial T}}{{\partial t}} = W\frac{{\partial T}}{{\partial z}}\;\;, $ | (9) |
其中:
土壤热量传输过程实际上包含了热传导和热对流两个相互独立的过程, 因此Gao et al (2003)将式 (5) 和 (9) 结合后得到如下方程:
| $ \frac{{\partial T}}{{\partial t}} = k\frac{{{\partial ^2}T}}{{\partial {z^2}}} + W\frac{{\partial T}}{{\partial z}}\;\;, $ | (10) |
在假设W为常数的条件下, 以T(0, t)=T0+Asin (ωt+Φ), (t≥0) 为边界条件, 则
| $ \left\{ \begin{gathered} \frac{{\partial T}}{{\partial t}} = k\frac{{{\partial ^2}T}}{{\partial {z^2}}} + W\frac{{\partial T}}{{\partial z}}, \left({t > 0, z > 0} \right) \hfill \\ T\left({0, t} \right){T_0} + A\sin \left({\omega t + \phi } \right), \left({t \geqslant 0} \right) \hfill \\ \end{gathered} \right. $ | (11) |
令T(z, t)=T0+u(z, t), 可得:
| $ \left\{ \begin{gathered} \frac{{\partial u}}{{\partial t}} = k\frac{{{\partial ^2}u}}{{\partial {z^2}}} + W\frac{{\partial u}}{{\partial z}}, \left({t > 0, z > 0} \right) \hfill \\ u\left({0, t} \right){T_0} + A\sin \left({\omega t + \phi } \right), \left({t \geqslant 0} \right) \hfill \\ \end{gathered} \right. $ | (12) |
设方程 (12) 的解为u(z, t)=Ae(az+bt), 其中a, b分别为常数。由于u(0, t)=Asin (ωt+Φ)=Aebt, 则Asin (ωt+Φ) 为Aebt的实部, 且b=iω。将u(z, t)=Ae(az+bt) 带入式 (12), 得Abe(az+bt)=kAa2e(az+bt)+WAae(az+bt), 即:
| $ b = k{a^2} + Wa\;\;, $ | (13) |
结 合b=iω可得到关于a的一元二次表达式
| $ k{a^2} + Wa - i\omega = 0\;\;, $ | (14) |
则
| $ a = \left({ - W - \sqrt {{W^2} + 4ik\omega } } \right)/2k\;\;, $ | (15) |
令
| $ \alpha = \sqrt {\frac{{{W^2} + \sqrt {{W^4} + 16{k^2} + {\omega ^2}} }}{2}} \;\;, $ | (16) |
| $ \beta = \frac{{2\sqrt 2 k\omega }}{{\sqrt {{W^2}\sqrt { + {W^4} + 16{k^2} + {\omega ^2}} } }}\;\;, $ | (17) |
则可得出a, b的表达式并将其带入式u(z, t)=Ae(az+bt)中, 得到:
| $ \begin{gathered} u\left({z, t} \right)A{e^{\left({az + bt} \right)}} = A{e^{\left[ {\left({\frac{{ - W}}{{2k}} - \frac{{\sqrt 2 }}{{4k}}\sqrt {\sqrt {{W^2} + \sqrt {{W^4} + 16{k^2}{\omega ^2}} } } } \right)z} \right]}} \hfill \\ \;\;\;\;\;\;\;\;\;\;\;\;{e^{\left[ {\omega t - z\frac{{\sqrt 2 \omega }}{{\sqrt {{W^2} + \sqrt {{W^4} + 16{k^2}{\omega ^2}} } }}} \right]i}}\;\;\;, \hfill \\ \end{gathered} $ | (18) |
所以, 该方程的解析解为:
| $ \begin{gathered} T\left({z, t} \right) = {T_0} + \hfill \\ \;\;\;\;\;\;\;A\exp \left[ {\left({ - \frac{W}{{2k}} - \frac{{\sqrt 2 }}{{4k}}\sqrt {{W^2} + \sqrt {{W^4} + 16{k^2}{\omega ^2}} } } \right)z} \right] \hfill \\ \;\;\;\;\;\;\;\sin \left[ {\omega t - z\frac{{\sqrt 2 \omega }}{{\sqrt {{W^2} + \sqrt {{W^4} + 16{k^2}{\omega ^2}} } }}} \right]\;\;, \hfill \\ \end{gathered} $ | (19) |
其中: T0为土壤表面平均温度, A为土壤表层温度变化的幅度, ω为地球自转角速度。之后, Gao et al又用 (19) 式反推出土壤热扩散率k和液态水通量密度W的表达式。数理推导过程如下:令z1, z2分别为两层土壤深度, A1, A2和Φ1, Φ2分别为对应的土壤温度日振幅和位相 (设z1>z2, A1 < A2, Φ1 < Φ2)(Gao Z, 2005), 则根据式 (19) 可得:
| $ \begin{gathered} \begin{gathered} T\left( {{z_1},t} \right) = {T_0} + {A_2}\exp \left[ { - \left( {{z_1} - {z_2}} \right)\left( {\frac{W}{{2k}} + \frac{{\sqrt 2 }}{{4k}}\sqrt {\sqrt {{W^2} + \sqrt {{W^4} + 16{k^2}{\omega ^2}} } } } \right)} \right] \hfill \\ \;\;\;\;\;\;\;\;\;\;\;\;\;\;\;\;\;\;\;\;\;\;\sin \left[ {\omega t + {\phi _2} - \left( {{z_1} - {z_2}} \right)\frac{{\sqrt 2 \omega }}{{\sqrt {{W^2} + \sqrt {{W^4} + 16{k^2}{\omega ^2}} } }}} \right]\;\;\;, \hfill \\ \end{gathered} \end{gathered} $ | (20) |
其中:
| $ \begin{gathered} {A_1} = {A_2}\exp \left[ { - \left({{z_1} - {z_2}} \right)\left({\frac{W}{{2k}} + \frac{{\sqrt 2 }}{{4k}}\sqrt {\sqrt {{W^2} + \sqrt {{W^4} + 16{k^2}{\omega ^2}} } } } \right)} \right]\;\;, \hfill \\ \;\;\;\;\;\;\;\;\;\;\;\;\;\;\;\;\;{\phi _1} = {\phi _2} - \left({{z_1} - {z_2}} \right)\frac{{\sqrt 2 \omega }}{{\sqrt {{W^2} + \sqrt {{W^4} + 16{k^2}{\omega ^2}} } }}\;\;, \hfill \\ \end{gathered} $ |
所以,
| $ \ln \left({{A_1}/{A_2}} \right) = \left[ { - \left({{z_1} - {z_2}} \right)\left({\frac{W}{{2k}} + \frac{{\sqrt 2 }}{{4k}}\sqrt {\sqrt {{W^2} + \sqrt {{W^4} + 16{k^2}{\omega ^2}} } } } \right)} \right]\;\;, $ | (21) |
| $ {\phi _1} - {\phi _2} = \left({{z_1} - {z_2}} \right)\frac{{\sqrt 2 \omega }}{{\sqrt {{W^2} + \sqrt {{W^4} + 16{k^2}{\omega ^2}} } }}\;\;, $ | (22) |
由式 (21) 和式 (22) 得到k, W的表达式:
| $ k = - \frac{{{{\left({{z_1} - {z_2}} \right)}^2}\omega \ln \left({{A_1}/{A_2}} \right)}}{{\left({{\phi _2} - {\phi _1}} \right)\left[ {{{\left({{\phi _2} - {\phi _1}} \right)}^2} + {{\ln }^2}\left({{A_1}/{A_2}} \right)} \right]}}\;\;, $ | (23) |
| $ W = \frac{{\omega \left({{z_1} - {z_2}} \right)}}{{{\phi _2} - {\phi _1}}}\left[ {\frac{{2{{\ln }^2}\left({{A_1}/{A_2}} \right)}}{{{{\left({{\phi _2} - {\phi _1}} \right)}^2} + {{\ln }^2}\left({{A_1}/{A_2}} \right)}} - 1} \right]\;\;, $ | (24) |
在含水量极低的土壤里, 通常认为W=0, 此时传统的热传导方程与耦合热传导-对流方程等价。根据式 (24) 可以得出|lnA1/A2|=Φ2-Φ1, 此时土壤热扩散率k的计算表达式为
| $ {k_1} = \frac{{{{\left({{z_1} - {z_2}} \right)}^2}\omega }}{{2{{\ln }^2}\left({{A_1}/{A_2}} \right)}}\;\;, $ | (25) |
或
| $ {k_2} = \frac{{{{\left({{z_1} - {z_2}} \right)}^2}\omega }}{{2{{\left({{\phi _2} - {\phi _1}} \right)}^2}}}\;\;, $ | (26) |
上述两种计算的方法分别称为振幅法和位相法 (刘树华, 2004)。而当W≠0时, 分别由式 (23) 和式 (24) 计算k, W(Gao et al, 2007)。
2.4 资料与计算方法介绍数据资料来源于2006年青藏高原理塘地区地表过程野外试验。观测站点设在四川省西部的理塘县 (29°58′34.3″N, 100°15′48.9″E), 海拔3920 m。站区方圆1 km范围内地势平坦, 站点以南1 km处有河流, 以东6~10 km处是山地, 海拔可达6000 m。站区地表为短草草甸覆盖, 植被高度约2~5 cm。土壤类型为黄棕壤, 浅层土壤有机质积累明显, 有机质的存在会提高土壤的持水能力, 增加土壤含水量 (高以信, 1995; 杨健和马耀明, 2012)。本试验用Campbell公司的109型土壤热电偶探头和ML2x土壤水分传感器测量了8层土壤温湿度数据 (0 cm, 10 cm, 15 cm, 20 cm, 25 cm, 40 cm, 80 cm, 110 cm), 土壤温度和湿度均为每5 min记录一次。
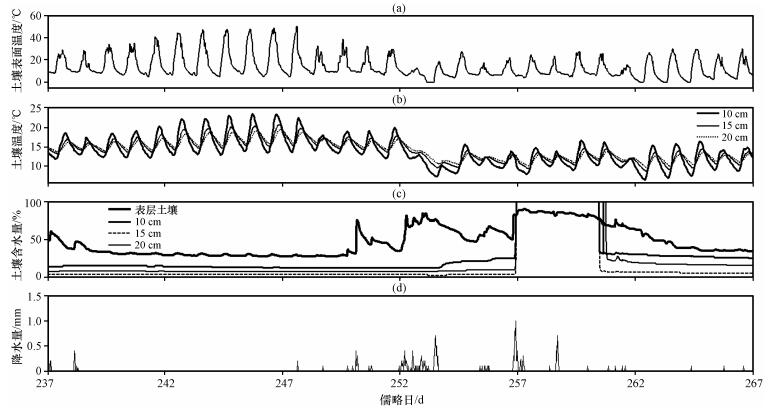
由于土壤浅表层 ( < 20 cm) 对气温反应最为敏感, 大约100 cm深度以下土壤温度几乎没有日变化 (张文纲等, 2008; 王琳琳, 2010), 因此为了简化计算过程, 同时更加清晰地了解土壤温度的传导规律, 选取了温度日变化显著的夏季晴朗天气20 cm深度以上的土壤温湿度资料进行研究 (图 1)。将每5 min记录一次的原始数据平均为30 min平均数据后用不同的正弦函数T=T+Asin (ωt+Φ) 拟合出研究时段内0 cm、10 cm、15 cm、20 cm四个深度的土壤温度, 从而确定各层土壤温度变化的振幅和位相, 根据式 (23) 和 (24) 分别计算出相邻两层土壤之间的土壤热扩散率和液态水通量密度。同样地, 在假设W=0的条件下, 根据式 (25) 和 (26) 分别计算得到k1和k2。最后, 根据上述结果, 以表层土壤温度为上边界条件, 分别用位相法、振幅法以及耦合热传导-对流法模拟2006年9月1921日 (儒略日262~264天) 期间10 cm、15 cm、20 cm三个深度处的土壤温度, 并对所得结果进行分析比较。
|
图 1 2006年8月25日至9月24日土壤0 cm (a)、10 cm、15 cm和20 cm (b) 深度土壤温度观测值, 土壤体积含水量 (c) 及降水量 (d) 时间序列 Figure 1 Temporal variation of soil temperature (a, b), volumetric water content (c) at the depths of 0 cm (a), 10 cm, 15 cm and 20 cm (b) and precipitation (d) from 25 August to 24 September 2006 |
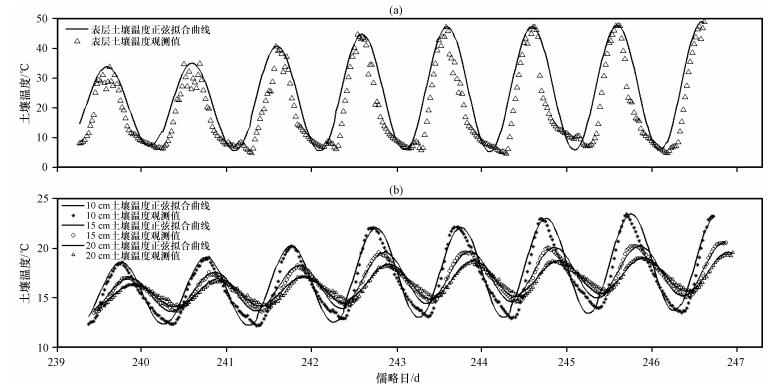
从2006年8月27日至9月4日期间0 cm, 10 cm, 15 cm和20 cm四层土壤温度观测值及其正弦拟合曲线 (图 2) 可以看出, 0 cm土壤的最高 (低) 温度为48.99 ℃(4.63 ℃), 10 cm深度最高 (低) 温度为23.41 ℃(12.15 ℃), 15 cm深度最高 (低) 温度为20.54 ℃(13.50 ℃), 20 cm深度最高 (低) 温度为19.57 ℃(13.95 ℃), 不同深度处的土壤温度均存在明显的日变化, 且随着深度的增加土壤温度振幅减小。与浅层土壤相比, 深层土壤的温度变化存在明显的滞后现象, 位相随着土壤深度的增加而后移。其中, 10 cm深度处土壤温度位相较0 cm土壤温度位相后移1.037 rad (滞后3.68 h), 15 cm深度处土壤温度位相较10 cm后移0.628 rad (滞后2.4 h), 20 cm深度处土壤温度位相较15 cm后移了0.314 rad (滞后1.2 h)。
|
图 2 2006年8月27日至9月4日0 cm (a), 10 cm, 15 cm和20 cm (b) 四层土壤温度观测值及其正弦拟合曲线 Figure 2 Soil temperature observed at the depth of 0 cm (a), 10 cm, 15 cm and 20 cm (b) and its sine function curves from 27 August to 4 September 2006 |
由于土壤温度受到地表覆盖物、辐射强度、云量等环境因素的影响, 为了便于计算, 本文用不同的单一正弦函数T=T+Asin (ωt+Φ) 来分别拟合四层土壤温度 (图 2)。从图 2中可以看出, 各层土壤温度的正弦拟合与实际观测值相互非常吻合。根据上述拟合结果, 确定各层土壤温度变化的振幅和位相后, 计算相邻两层土壤之间的温度日振幅比值对数和温度位相差, 结果显示0~10 cm, 10~15 cm和15~20 cm三层土壤温度日振幅比值对数分别为-1.483、-0.594和-0.380, 三层土壤温度位相差则分别为-1.037 rad、-0.628 rad和-0.314 rad。可以看出, 土壤温度振幅比值对数越大其位相差也越大, 其中0~10 cm层振幅比值对数的绝对值与位相差的绝对值最大, 说明土壤表层与10 cm深度之间的土壤温度差别最显著, 热量的传递所需的时间较长。
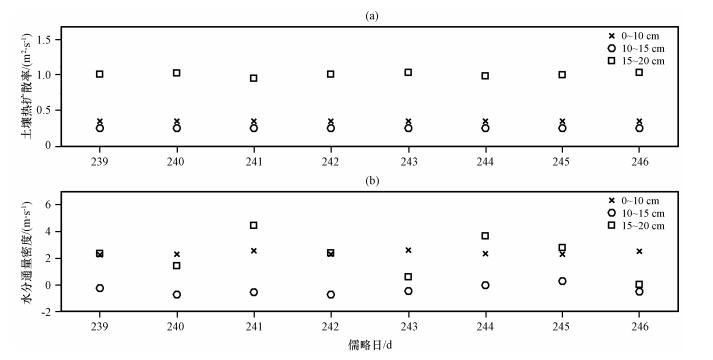
Gao et al (2003, 2005) 发现土壤热扩散率k和液态水通量密度W两个参数可以很好地来表征土壤的导热能力大小, 且它们的分布特征充分反映了土壤的热状况和热物理过程。将上述计算所得的土壤温度振幅比值对数值和位相差分别代人式 (23) 和 (24) 后, 得到土壤热扩散率k和液态水通量密度W(图 3)。
|
图 3 2006年8月27日至9月4日期间耦合热传导-对流法计算得到的0~10 cm, 10~15 cm和15~20 cm三层土壤热扩散率值 (a) 和液态水通量密度 (b) Figure 3 Temporal variation of soil thermal diffusivity and water flux density calculated by Conduction-convection algorithm for three layers 0~10 cm, 10~15 cm and 15~20 cm from 27 August to 4 September 2006 |
0~10 cm土壤层的热扩散率平均值 (变化范围) 为3.18×10⁻⁷m2·s-1(3.14×10⁻⁷~3.20×10⁻⁷ m2·s-1), 10~15 cm层为2.30×10⁻⁷ m2·s-1(2.29×10⁻⁷~2.32×10⁻⁷ m2·s-1), 15~20 cm层为8.97×10⁻⁷ m2·s-1(8.51×10⁻⁷~9.21×10⁻⁷ m2·s-1)。结合图 1c所示的土壤含水量分布规律, 其中0 cm, 10 cm, 15 cm和20 cm深度处的含水量分别为40.99%, 26.01%, 10.94%和17.20%, 可以看出, 土壤热扩散率与含水量在土壤垂直剖面上的变化保持高度的一致性, 这主要是因为土壤含水量、孔隙度等是直接影响土壤热扩散率大小及其温度分布特征的因素 (Parikh et al, 1969; Persaud and Chang, 1985; 李毅等, 2003; 贾东于等, 2014)。Garratt (1992)曾给出了一系列不同土壤类型在不同含水量条件下的土壤热扩散率值, 其中土壤体积含水量为20%的粘土的k为5.2×10⁻⁷ m2·s-1; Gao et al (2003)给出青藏高原那曲地区短草土壤的k值为8.6×10⁻⁷ m2·s-1, 均与本试验结果近似。而Gao et al (2007)用沙漠地区的观测数据计算所得的土壤热扩散率的变化范围为1.05×10⁻⁷~6.20×10⁻⁷ m2·s-1; 王琳琳等 (2008)通过对黄土高原塬区地表过程数据分析后发现k=2.95×10⁻⁷~3.02×10⁻⁷ m2·s-1, 说明在干旱或半干旱地区, 由于土壤含水量低, 土壤热扩散率值往往较低。
除了耦合热传导-对流方法, 本文还用位相法和振幅法计算了试验地土壤的热扩散率 (表 1), 结果表明, 用位相法计算所得的土壤热扩散率总体上比振幅法计算值大, 且与耦合热传导-对流法所给出的值较为接近。
| 表 1 位相法, 振幅法以及耦合热传导-对流法计算所得到的0~10 cm, 10~15 cm和15~20 cm处土壤热扩散率值 Table 1 The values of soil thermal diffusivity calculated by Phase method, Amplitude method and Conduction-convection algorithm for the layer 0~10 cm, 10~15 cm and 15~20 cm |
地表的蒸发作用导致浅层土壤中含水量降低, 从而引起深层土壤水分向上渗透, 此时, 在土壤中存在明显的液态水通量。从图 3b可以看出, 0~10 cm土壤层的液态水通量密度平均值 (变化范围) 为2.40×10⁻⁶m·s-1(2.26×10⁻⁶~2.61×10⁻⁶m·s-1), 10~15 cm层为-3.50×10⁻⁷m·s-1(-5.49×10⁻⁹~2.99×10⁻⁷m·s-1), 15~20 cm层为2.21×10⁻⁶m·s-1(2.52×10⁻⁸~4.44×10⁻⁶m·s-1), 各层土壤的液态水通量密度变化幅度均较小。Ren et al (2000)曾测定了沙土, 沙壤土以及黏土三种不同质地土壤的液态水通量密度, 发现其变化范围为1.16×-5~6.31×10⁻⁵m·s-1, 比本试验所获得的结果高, 这可能是因为Ren et al (2000)在土壤含水量达到饱和时进行试验, 从而导致测定结果偏高; Gao et al (2003)测得青藏高原那曲地区短草土壤的液态水通量密度值为4.3×10⁻⁶m·s-1, 与本试验结果近似。在整个研究时段内, 10~15 cm土壤层的液态水通量密度为负值, 水分向下移动, 0~15 cm, 15~20 cm土壤层为正值, 水分向上运动, 这与相邻两层的土壤热扩散率k的垂直梯度的方向有关。
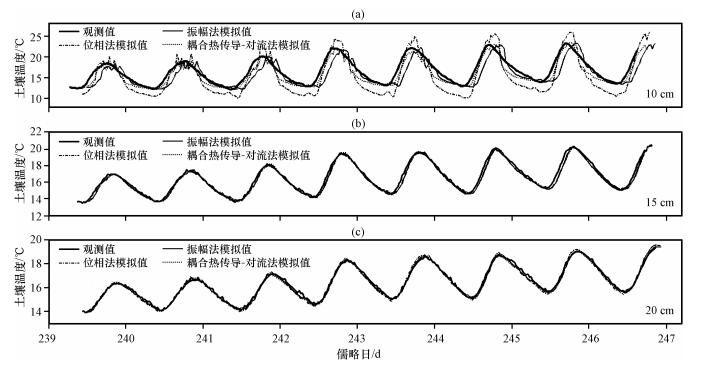
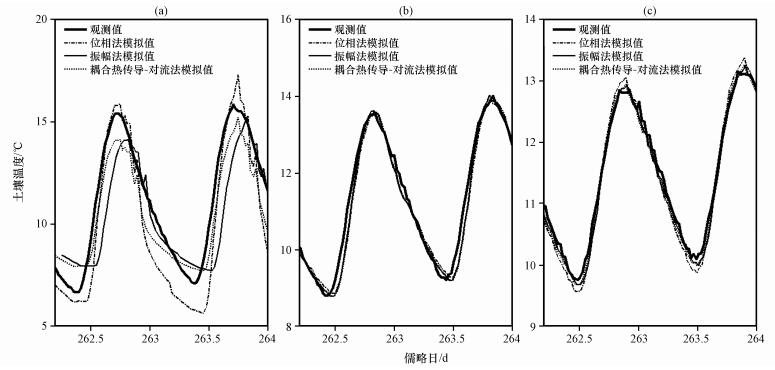
3.4 土壤温度模拟已知相邻两层土壤之间的热扩散率k和液态水通量密度W后, 以表层土壤温度为上边界条件, 利用式 (19) 模拟得到10 cm, 15 cm和20 cm三个深度的土壤温度; 同样地, 在假设土壤液态水通量密度W=0的条件下, 分别用位相法和振幅法模拟得到相应深度的土壤温度 (图 4)。从图 4中可以看出, 对于10 cm土壤层而言, 位相法系统地高估土壤温度日振幅约2.16 ℃, 最大值可达4.70 ℃, 振幅法模拟得到的土壤温度位相与观测资料相比存在明显的前移现象, 前移约2.23 h, 而耦合热传导-对流法模拟的土壤温度位相前移约0.91 h, 土壤温度日振幅则比实际值高估约0.02 ℃。
|
图 4 2006年8月27日至9月4日10 cm (a), 15 cm (b) 和20 cm (c) 三层土壤温度观测值及位相法, 振幅法和耦合热传导-对流法模拟所得土壤温度时间序列 Figure 4 Comparisons of soil temperature modeled by Phase method, Amplitude method and Conduction-convection algorithm against observed soil temperature at the depth of 10 cm (a), 15 cm (b) and 20 cm (c) from 27 August to 4 September 2006 |
为了进一步比较位相法、振幅法和耦合热传导-对流方法对土壤温度的模拟能力, 本文利用上述计算所得的各层土壤热扩散率k以及液态水通量密度W的平均值, 分别对2006年9月19-21日 (儒略日262~264天) 期间的土壤温度进行模拟, 从图 5可以看出, 三种方法对15 cm、20 cm深度处的土壤温度模拟效果均比10 cm好。同样地, 对于10 cm土壤层而言, 位相法系统地高估土壤温度日振幅约0.96 ℃, 振幅法模拟得到的土壤温度位相与观测资料相比明显前移约0.45 h, 而耦合热传导-对流法模拟的土壤温度位相前移约0.21 h, 土壤温度日振幅则比实际值低估约0.79 ℃。由此可以看出, 耦合热传导-对流方法能更加精确地模拟出土壤温度。
|
图 5 2006年9月1921日10 cm (a), 15 cm (b) 和20 cm (c) 三层土壤温度观测值及位相法, 振幅法和耦合热传导-对流法模拟所得土壤温度时间序列 Figure 5 Comparisons of soil temperature modeled by Phase method, Amplitude method and Conduction-convection algorithm against the observed soil temperature at the depth of 10 cm, 15 cm and 20 cm from 19 to 21 September 2006 |
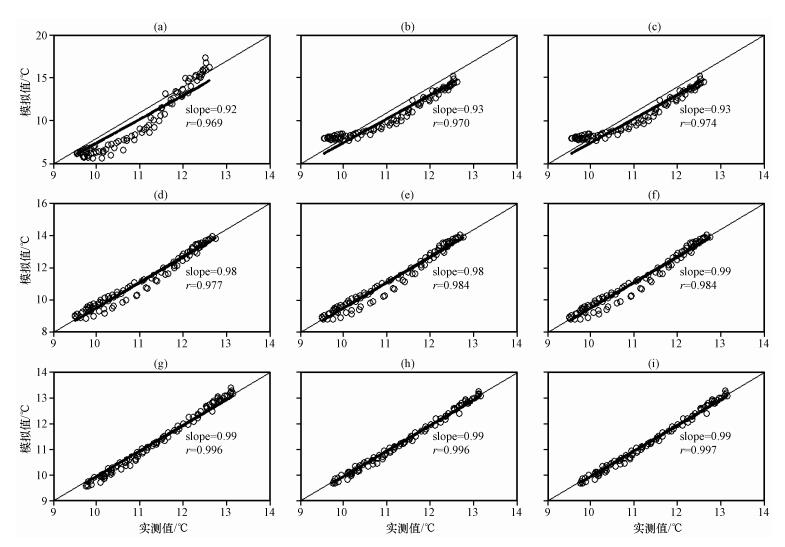
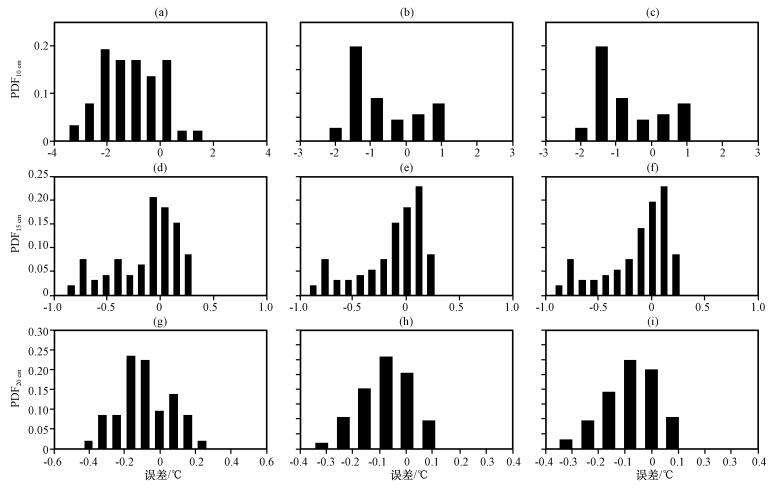
本文给出了儒略日262~264天研究时段内各深度的土壤温度模拟值与实际观测值的1:1散点关系 (图 6) 和误差概率分布 (图 7)。从图 6中可以看出, 三种方法计算得到的土壤温度的模拟值与实测值的比值均非常接近于1, 且耦合热传导-对流法对各层土壤温度的模拟效果最好, 其模拟值与试验值的相关系数分别为: r10cm=0.73, r15cm=0.98和r20cm=0.99(置信度为99%)。10 cm深度的土壤温度模拟值与试验值的相关系数均小于深层土壤, 这主要是因为深层土壤温度的变化受到太阳辐射、空气温度、云量等因素的干扰较小, 土壤温度日变化更符合正弦波变化规律, 模拟结果更好。通过误差概率分布 (probability distribution function, PDF) 同样可以得出上述结论。其中, 对10 cm土壤温度的模拟误差主要分布在-3~2 ℃之间, 15 cm层主要集中在-1~0.5 ℃之间, 20 cm土壤层则主要集中在-0.4~0.2 ℃之间。考虑了土壤液态水通量密度的影响后, 用耦合热传导-对流方法模拟的各层土壤温度仍存在不同程度的偏差, 这可能是因为本试验中假设各层土壤液态水通量密度不存在日变化, 而从图 1c中可以看出土壤各层含水量存在明显的日变化, 从而导致对一天中各个时段土壤温度的模拟效果并不一致, 并引起了偏差 (缪育聪等, 2012), 后期的研究工作可以对此进行进一步地验证和改进。
|
图 6 2006年9月1921日10 cm (上), 15 cm (中) 和20 cm (下) 三层土壤温度观测值与位相法 (a, d, g), 振幅法 (b, e, h) 和耦合热传导-对流法 (c, f, i) 模拟值的1:1散点分布 Figure 6 Scatter plots of the soil temperature modeled by Phase method (a, d, g), Amplitude method (b, e, h) and Conduction-convection algorithm (c, f, i) against the observed soil temperature at the depth of 10 cm (up), 15 cm (medium) and 20 cm (down) from 19 to 21 September 2006 |
|
图 7 2006年9月19 21日10 cm (上), 15 cm (中) 和20 cm (下) 三层土壤温度观测值与位相法 (a, d, g), 振幅法 (b, e, h) 和耦合热传导-对流法 (c, f, i) 模拟值的误差概率分布 Figure 7 Empirical probability distribution function (PDF) of subtraction between the soil temperature modeled by Phase method (a, d, g), Amplitude method (b, e, h) and Conduction-convection algorithm (c, f, i) with the observed soil temperature at the depth of 10 cm (up), 15 cm (medium) and 20 cm (down) from 19 to 21 September 2006 |
本文采用了不同的数学统计方法, 进一步探讨了由三种土壤温度算法所得的土壤温度模拟值与实测值之间的离散程度以及各模型的模拟效果 (Colello and Grivet, 1998):
| $ SEE = \sqrt {\frac{{\sum\limits_{i = 1}^n {{{\left({{T_{{\text{modeled}}}} - {T_{{\text{measured}}}}} \right)}^2}} }}{{n - 2}}} \;\;, $ | (27) |
| $ RMSE = \sqrt {\frac{{\sum\limits_{i = 1}^n {{{\left({{T_{{\text{modeled}}}} - {T_{{\text{measured}}}}} \right)}^2}} }}{{n}}} \;\;, $ | (28) |
| $ NSEE = \sqrt {\frac{{\sum\limits_{i = 1}^n {{{\left({{T_{{\text{modeled}}}} - {T_{{\text{measured}}}}} \right)}^2}} }}{{\sum\limits_{i = 1}^n {{{\left({{T_{{\text{measured}}}}} \right)}^2}} }}} \;\;, $ | (29) |
其中: SEE为标准差, 反映土壤温度模拟值与真实值的离散程度; RMSE为均方根误差, 用于衡量土壤温度模拟值与真实值之间的偏差; NSEE为归一化标准差, 估计相对不确定度。n为样本容量, Tmodeled为土壤温度模拟值, Tmeasured为土壤温度观测值。计算结果见表 2。
| 表 2 2006年9月19-~21日10 cm, 15 cm和20 cm三层土壤温度的标准差估计 (SEE), 均方根误差 (RMSE) 和归一化标准差 (NSEE) 估计 Table 2 The values of SEE, RMSE and NSEE at the depth of 0.10 m, 0.15 m and 0.20 m from 19 to 21 September 2006 |
从表 2可以得出, 耦合热传导-对流法的SEE, NSEE和RMSE的值均小于其他两种方法, 且15 cm和20 cm的SEE, NSEE和RMSE的值小于10 cm层, 从而说明考虑土壤液态水动态变化的耦合热传导-对流方法对土壤温度的模拟能力较强, 且不管是位相法、振幅法还是热传导-对流法, 它们对受地表温度干扰较小的深层土壤温度的模拟效果较好。
4 结论本文利用2006年8月27日至9月4日期间青藏高原理塘地区陆面过程试验土壤温度观测资料, 分别采用位相法、振幅法以及耦合热传导-对流法计算了土壤热扩散率, 并用耦合热传导-对流法计算了土壤液态水通量密度, 用上述计算结果模拟了2006年9月19-21日两天的土壤温度。通过土壤温度模拟值与观测值的1:1散点图、率分布图以及三种误差统计分析方法系统地探讨了这三种方法对土壤温度的模拟能力, 结果如下:
(1) 利用位相法和振幅法计算所得的土壤热扩散率平均值分别为4.97×10⁻⁷ m2·s-1、3.44×10⁻⁷ m2·s-1。而考虑土壤中液态水的动态变化对土壤温度的影响后, 用耦合热传导-对流法计算的土壤热扩散率平均值为4.82×10⁻⁷ m2·s-1, 液态水通量密度的变化范围为-5.44×10⁻⁹~4.44×10⁻⁶ m·s-1。用位相法计算所得的土壤热扩散率总体上比振幅法计算值大, 且与耦合热传导-对流法所给出的值更为接近。
(2) 位相法、振幅法及耦合热传导-对流法对15 cm、20 cm两层的土壤温度模拟效果较10 cm理想。其中, 对10 cm土壤层而言, 位相法系统地高估土壤温度日振幅约0.96 ℃, 振幅法模拟的土壤温度位相比实际观测值平均前移约0.45 h, 耦合热传导-对流法模拟的土壤温度位相则平均前移约0.21 h, 土壤温度日振幅则比实际值高估约0.79 ℃。
(3) 位相法、振幅法及耦合热传导-对流法模拟得到的土壤温度值与实测值的比值均非常接近1, 其中, 利用耦合热传导-对流法模拟得到的各层土壤温度与实测值最为接近, 相关系数分别为: r10cm=0.97、r15cm=0.98、r20cm=0.99, 置信度为99%, 且误差分别主要分布在-3~2 ℃、-1~0.5 ℃和-0.4~0.2 ℃之间。
| Bilgili M, Sahin B, Sangun L. 2013. Estimating soil temperature using neighboring station data via multi-nonlinear regression and artificial neural network models[J]. Environ Monit Assess, 185(1): 343–358. | |
| Colello G D, Grivet C. 1998. Modeling of energy, water, and CO2 flux in a temperate grassland ecosystem with SiB2:May-October 1987[J]. J Atmos Sci, 55(7): 1141–1169. | |
| Gao Z, Bian L, Hu Y, et al. 2007. Determination of soil temperature in an arid region[J]. J Arid Environ, 71(2): 157–168. DOI:10.1016/j.jaridenv.2007.03.012 | |
| Gao Z, Chae N, Kim J, et al. 2004. Modeling of surface energy partitioning, surface temperature, and soil wetness in the Tibetan prairie using the Simple Biosphere Model 2(SiB2)[J]. J Geophys Res, 109(1): D06102. | |
| Gao Z, Fan X, Bian L. 2003. An analytical solution to one-dimensional thermal conduction-convection in soil[J]. Soil Science, 168(6): 99–107. | |
| Gao Z, Wang J, Ma Y, et al. 2000. Calculation of near-surface layer turbulent transport and analysis of surface thermal equilibrium features in Naqu of Tibet[J]. Phys Chem Earth (B), 25(2): 135–139. DOI:10.1016/S1464-1909(99)00124-0 | |
| Gao Z. 2005. Determination of soil heat flux in a Tibetan short-grass prairie[J]. Bound-Layer Meteor, 114(1): 165–178. DOI:10.1007/s10546-004-8661-5 | |
| Garratt J R. 1992. The atmospheric boundary layer[M]. Cambridge: Cambridge University Press, 290-292. | |
| Holmes T R H, Owe M, Jeu De R A M, et al. 2008. Estimating the soil temperature profile from a single depth observation:A simple empirical heatflow solution[J]. Water Resour Res, 44(2): W02412. | |
| Jebamalar A S, Abraham Thambi Raja S, Jeslin Sunitha Bai S. 2012. Prediction of annual and seasonal temperature variation using artificial neural network[J]. Indian J Radio Space Phys, 41(2): 48–57. | |
| Koo M, Song Y. 2008. Estimating apparent diffusivity using temperature time series:A comparison of temperature data measured in KMA boreholes and NGMN wells[J]. Geosicence Journal, 12(3): 255–264. DOI:10.1007/s12303-008-0026-5 | |
| Krishnamurti T N, Ramanathan Y. 1982. Sensitivity of the monsoon onset to different heating[J]. Mon Wea Rev, 39(1): 1090–1306. | |
| Lin J D. 1980. On the force-restore method for prediction of ground surface temperature[J]. J Geophys Res, 85(C6): 3251–3254. DOI:10.1029/JC085iC06p03251 | |
| Neena Sugathan, Biju V, Renuka G. 2014. Influence of soil moisture content on surface albedo and soil thermal parameters at a tropical station[J]. J Earth Syst Sci, 123(5): 1115–1128. DOI:10.1007/s12040-014-0452-x | |
| Parikh R J, Havens J A, Scott H D. 1969. Thermal diffusivity and conductivity of moist porous media[J]. Soil Sci Soc Am J, 43(4): 1050–1052. | |
| de Silans A M B P, Monteny B A, Lhomme J P. 1996. Apparent soil thermal diffusivity, a case study:HAPEX-Sahel experiment[J]. Agricultural and Forest Meteorology, 81(3): 201–216. | |
| Persaud N, Chang A C. 1985. Computing mean apparent soil thermal diffusivity from daily observations of soil temperature at two depths[J]. Soil Sci, 139(4): 297–304. DOI:10.1097/00010694-198504000-00002 | |
| Ren T, Kluitenberg G J, Horton R. 2000. Determining soil water flux and pore water velocity by a heat pulse technique[J]. Soil Sci Soc Amer J, 64(1): 552–560. | |
| Shao M, Horton R, Jaynes D B. 1998. Analytical solution for one-dimensional heat conduction-convection equation[J]. Soil Sci Soc Amer J, 62(11): 123–128. | |
| Van Wijk W R, De Vires D A. 1963. Periodic temperature variations in a homogeneous soil[J]. In:Van Wijk W R (Ed), Physics of Plant Environment.North-Holland Amsterdam: 103–143. | |
| Wu A, Ni Y. 1999. The effects of Tibetan Plateau on the anomalous variation of Asia Monsoon in a coupled ocean-atmosphere system[J]. Acta Meteor Sinica, 13(1): 21–34. | |
| Wu W, Tang X P, Yang C, et al. 2013. Spatiotemporal modeling of monthly soil temperature using artificial neural networks[J]. Theor Appl Climatol, 113(5): 481–494. | |
| Zeng X, Dickinson R E. 1998. Effect of surface sublayer on surface skin temperature and fluxes[J]. J Climate, 11(3): 537–550. | |
| Zhang Y, Chen W J, Smith S L, et al. 2005. Soil temperature in Canada during the twentieth century:Complex responses to atmospheric climate change[J]. J Geophys Res Atmos, 110(D3): 1105–1105. | |
| 陈星, 余晔, 陈晋北, 等. 2014. 黄土高原半干旱区冬小麦田土壤热通量的计算方法研究[J]. 高原气象, 33(6): 1514–1525. DOI:10.7522/j.issn.1000-0534.2013.00091 Chen Xin, Yu Hua, Chen Jinbei, et al. 2014. Study of estimation of soil heat flux at a wheat field in semi-arid area of Loss plateau[J]. Plateau Meteor, 33(6): 1514–1525. DOI:10.7522/j.issn.1000-0534.2013.00091 | |
| 高以信. 1995. 青藏高原土壤区划[J]. 山地研究, 13(4): 203–211. Gao Yixin. 1995. Soil regionalization of the Qianghai-Xizang Plateau[J]. Mountain Res, 13(4): 203–211. | |
| 贾东于, 文军, 张堂堂, 等. 2014. 黄土高原降水对土壤含水量和导热率的影响[J]. 高原气象, 33(3): 712–720. DOI:10.7522/j.issn.1000-0534.2014.00049 Jia Dongyu, Wen Jun, Zhang Tangtang, et al. 2014. Response of soil water content and soil thermal conductivity on precipitation in Loss plateau[J]. Plateau Meteor, 33(3): 712–720. DOI:10.7522/j.issn.1000-0534.2014.00049 | |
| 李燕, 刘新, 李伟平. 2012. 青藏高原地区不同下垫面陆面过程的数值模拟研究[J]. 高原气象, 31(3): 581–591. Li Yan, Liu Xin, Li Weiping. 2012. Numerical simulation of land surface process at different underlying surface in Tibetan plateau[J]. Plateau Meteor, 31(3): 581–591. | |
| 李毅, 邵明安, 王文焰, 等. 2003. 质地对土壤热性质的影响研究[J]. 农业工程学报, 19(4): 62–65. Li Yi, Shao Mingan, Wang Wenyan, et al. 2003. Influence of soil textures on the thermal properties[J]. Trans CSAE, 19(4): 62–65. | |
| 刘树华, 黄子琛, 刘立超, 等. 1995. 植被对近地面层水热交换影响的参数化模型[J]. 应用生态学报, 6(2): 149–154. Liu Shuhua, Huang Zichen, Liu Lichao, et al. 1995. A parameterized model on moisture-heat exchange at near-ground layer[J]. Chinese J Appl Ecol, 6(2): 149–154. | |
| 刘树华. 2004. 环境物理学[M]. 北京: 化学工业出版社, 93-127. Liu Shuhua. 2004. Environmental Physics[M]. Beijing: Chemical Industry Press, 93-127. | |
| 缪育聪, 刘树华, 吕世华, 等. 2012. 土壤热扩散率及其温度、热通量计算方法的比较研究[J]. 地球物理学报, 55(2): 441–451. DOI:10.6038/j.issn.0001-5733.2012.02.008 Miao Yucong, Liu Shuhua, Lv Shihua, et al. 2012. A comparative study of computing methods of soil thermal diffusivity, temperature and heat flux[J]. Chinese J Geophys, 55(2): 441–451. DOI:10.6038/j.issn.0001-5733.2012.02.008 | |
| 秦艳慧, 吴通华, 李韧, 等. 2015. EAR-Interim地表温度资料在青藏高原多年冻土区的适用性[J]. 高原气象, 34(3): 666–675. DOI:10.7522/j.issn.1000-0534.2014.00151 Qin Yanhui, Wu Tonghua, Li Ren, et al. 2015. Application of ERA product of land surface temperature in permafrost regions of Qinghai-Xizang Plateau[J]. Plateau Meteor, 34(3): 666–675. DOI:10.7522/j.issn.1000-0534.2014.00151 | |
| 任图生, 邵明安, 巨兆强, 等. 2004a. 利用热脉冲-时域反射技术测定土壤水热动态和物理参数Ⅰ.原理[J]. 土壤物理学报, 41(2): 225–229. Ren Tusehng, Shao Mingan, Ju Zhaoqiang, et al. 2004a. Measurement of soil physical properties with thermos-time domain reflectometryⅠ[J]. Acta Pedologica Sinica, 41(2): 225–229. | |
| 任图生, 邵明安, 巨兆强, 等. 2004b. 利用热脉冲-时域反射技术测定土壤水热动态和物理参数Ⅱ.原理[J]. 土壤物理学报, 41(2): 523–529. Ren Tusehng, Shao Mingan, Ju Zhaoqiang, et al. 2004b. Measurement of soil physical properties with thermos-time domain reflectometryⅡ[J]. Acta Pedologica Sinica, 41(2): 523–529. | |
| 王琳琳, 高志球, 沈新勇, 等. 2008. 土壤水分的垂直运动对黄土高原糜田土壤温度的影响[J]. 南京气象学院学报, 31(3): 363–368. Wang Linlin, Gao Zhiqiu, Shen Xinyong, et al. 2008. Impact of soil water vertical movement on the soil temperature in a broom corn millet field over Loess plateau[J]. Journal of Nanjing Institute of Meteorology, 31(3): 363–368. | |
| 王琳琳. 2010. 耦合热传导-对流过程的土壤温度模型之研究[D]. 北京: 中国科学院大气物理研究所, 21. Wang Linlin.2010.Study of coupled heat conduction-convection model of soil temperature[D].Beijing:Atmospheric Physics Research Institute Chinese Academy of Sciences, 21. | |
| 王愚, 胡泽勇, 荀学义, 等. 2013. 藏北高原土壤热传导率参数化方案的优化和检验[J]. 高原气象, 32(3): 646–653. DOI:10.7522/j.issn.1000-0534.2013.00063 Wang Yu, Hu Zeyong, Xun Xueyi, et al. 2013. Optimization and test of soil thermal conductivity parameterization schemes in Northern Qinghai-Xizang Plateau[J]. Plateau Meteor, 32(3): 646–653. DOI:10.7522/j.issn.1000-0534.2013.00063 | |
| 熊建胜, 张宇, 王少影, 等. 2014. CLM4.0土壤水分传输方案改进在青藏高原陆面过程模拟中的效应[J]. 高原气象, 33(2): 323–336. DOI:10.7522/j.issn.1000-0534.2014.00012 Xiong Jiansheng, Zhang Yu, Wang Shaoying, et al. 2014. Influence of soil moisture transmission scheme improvement in CLM4.0 on simulation of land surface process in Qianghai-Xizang plateau[J]. Plateau Meteor, 33(2): 323–336. DOI:10.7522/j.issn.1000-0534.2014.00012 | |
| 杨健, 马耀明. 2012. 青藏高原典型下垫面的土壤温湿特征[J]. 冰川冻土, 34(4): 813–820. Yang Jian, Ma Yaoming. 2012. Soil temperature and moisture features of typical underlying surface in the Tibetan plateau[J]. Journal of Glaciology and Geocryology, 34(4): 813–820. | |
| 张强. 1998. 简评陆面过程模式[J]. 气象科学, 18(3): 295–304. Zhang Qiang. 1998. Simple review of land surface process model[J]. Sci Meteor Sinica, 18(3): 295–304. | |
| 张文纲, 李述训, 庞强强. 2008. 近45年青藏高原土壤温度的变化特征[J]. 地理学报, 63(11): 1151–1159. Zhang Wengang, Li Shuxun, Pang Qiangqiang. 2008. Variation characteristics of soil temperature over Qianghai-Xizang plateau in the past 45 years[J]. Acta Geographic Sinica, 63(11): 1151–1159. |
2. Nanjing University of Information Science & Technology, School of Geography & Remote Sensing, Nanjing 210044, China
 2017, Vol. 36
