2. 湖南省气候中心, 长沙 410118;
3. National Laboratory for Coastal andMountain Meteorology, Environment and Climate Change Canada, Vancouver, BC, Canada
山地覆盖地球陆地面积的五分之一, 是影响气候系统的重要因素之一。高山气象观测资料对了解复杂地形上的大气结构和气候演变特征, 探讨地形对大气环流的强迫作用, 指导业务天气预报都有着不可替代的作用 (Stekl and Podzimek, 2012; Beniston et al, 1997; 段春锋等, 2012; 叶成志等, 2012; Mo et al, 2014)。高山站往往远离城镇, 接近自由大气, 更能真实反映大尺度气候演变特征 (段春锋等, 2012; Karl et al, 1998)。近年来国外利用高山观测资料开展大气科学研究十分活跃, 并取得了一些有意义的成果 (Bücher and Dessens, 1991; Williams and Avery, 1996; Beniston and Stephenson, 2004; Barry, 2008), 这些研究工作主要集中在两个方面, 一是基于高山站资料开展的山地气候和气候变化研究 (Stekl and Podzimek, 1993; Weber et al, 1997; Chan et al, 2007), 另一方面的研究则主要集中在利用高山观测资料研究地形对低层环流及周边降水的影响 (Joe et al, 2010; Gultepe et al, 2014; Milbrandt et al, 2014)。国内许多气象学者在开展天气气候研究工作时也非常注重高山站资料的应用, 利用高山站资料开展的研究主要集中在以下四个方面:揭示区域气候及气候变化特征 (刘增基等, 1997; 王毅荣和张存杰, 2006; 张万诚等, 2006; 陈德桥等, 2014) 以及气象要素随海拔高度变化的垂直分布特征 (赵成义等, 2011; 王娟等, 2011); 利用高山站和城市站 (平原站) 的资料, 对比分析城市热岛效应、空气质量的变化以及气溶胶等对天气的影响 (林长城等, 2006; 戴进等, 2008); 探讨地形对低层环流及周边降水的影响 (丁仁海和王学龙, 2009; 陈乾等, 2011; 赵玉春等, 2012); 揭示低空急流演变特征及对下游降水影响 (孙淑清, 1979; 陈静静等, 2011; 董佩明和赵思雄, 2004), 并形成了基于高山站资料应用的暴雨预报经验和可业务化技术指标 (叶成志等, 2012; 尹洁等, 2014)。
南岳、庐山、黄山站在中国夏季风活动的关键区域, 其特殊的地理位置和特定的高度层, 使其观测资料具有重要的研究价值和不可替代性 (Yu et al, 2010; Chen et al, 2010; 陈静静等, 2015)。本文通过对比分析1955-2012年3个高山站的风速、温度和降水, 揭示在全球变暖大背景下局地低层大气的气候变化特征, 为进一步理解副热带山地气候演变提供科学依据, 并为提高中、长期山地气象预报准确率提供一些有益的参考。
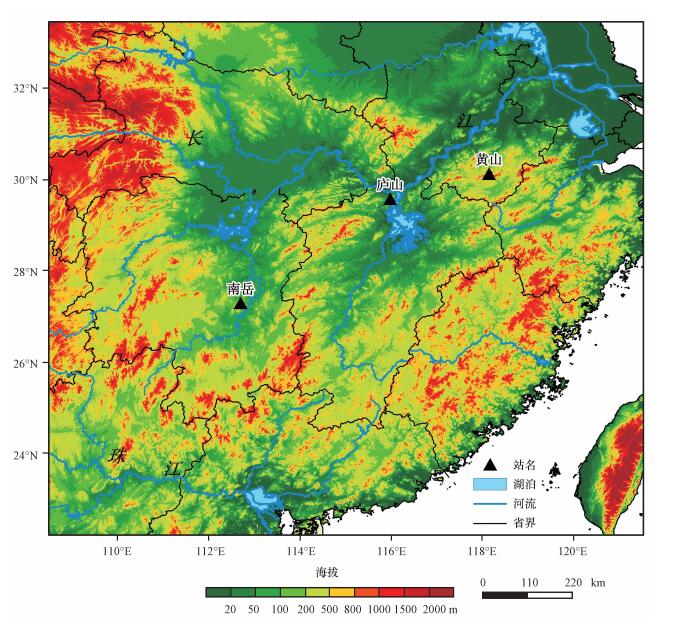
2 资料与方法所选我国中东部地形和3个高山气象观测站的地理位置如图 1所示。南岳高山气象观测站 (27.30°N, 112.69°E, 下称南岳站) 位于湖南省中部衡山喜阳峰望日台, 海拔1265 m; 庐山高山气象观测站 (29.58°N, 115.98°E, 下称庐山站) 位于江西省庐山北部牯牛背山山顶, 海拔1165 m; 黄山高山气象观测站 (30.13°N, 118.15°E, 下称黄山站) 位于安徽省南部黄山光明顶, 海拔1840 m。3个站地处我国中东部长江以南 (图 1), 近60年基本气象要素气温、降水、风等记录齐全, 而且站点无迁站, 观测环境良好。根据观测记录的质量和连续程度, 采用3个站1957-2012年逐日4次2 min平均 (定时) 风, 1956-2012年逐日最高气温、平均气温、最低气温和1961-2012年降水等资料进行分析。
|
图 1 中国中东部地形以及南岳站、庐山站和黄山站的位置 Figure 1 Topographic map of central-eastern China and the locations of Nanyue, Lushan and Huangshan stations |
运用线性回归 (魏凤英, 1999)、Morlet小波 (Torrence and Compo, 1998; 邓自旺和林振山, 1999; 韩荣青等, 2009) 等方法分析3个高山站风速、平均气温、最高气温、最低气温、降水等气候要素的长期变化趋势和周期性。其中年最大小时风速为每日4次2 min平均 (定时) 风的年最大值, 雨日数为日降水量≥0.1 mm的日数。
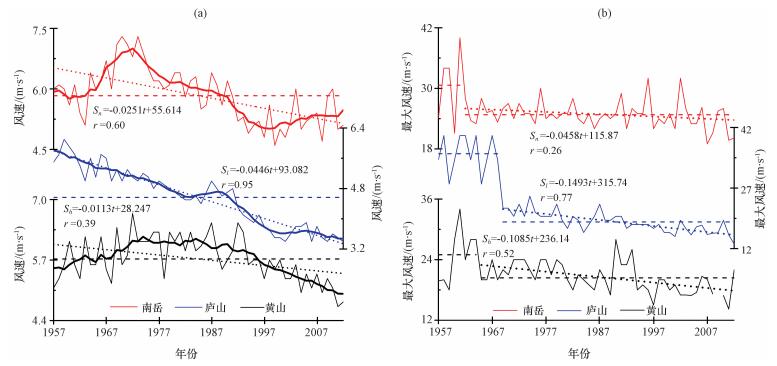
3 气候要素的时间变化 3.1 平均风速通过1957-2012年3个站年平均风速和年最大小时风速变化曲线 (图 2) 可以看出, 3个站的风速均呈明显减小趋势, 线性趋势分别为-0.25, -0.45, -0.11 m·s-1·(10a)-1, 均通过0.01显著性水平检验。
|
图 2 1957-2012年南岳站、庐山站和黄山站年平均风速 (a) 和年最大小时风速 (b) 的逐年变化 细实线表示风速的逐年变化, (a) 中的粗实线表示7年滑动平均曲线, 短虚线表示趋势线, 长虚线表示多年平均线 Figure 2 Time series of annual-mean wind speed (a) and annual maximum hourly wind speed (b) at Nanyue, Lushan and Huangshan stations during the period of 1955-2012.Thin solid lines represent the annual values. In (a), thick solid lines represent the 7-year moving averages, the short-dashed lines represent the linear trends, and the long-dashed lines represent the climatological averages |
南岳站年平均风速在4.6(1999年)~7.3(1970、1973年) m·s-1之间, 1973年以前年平均风速的线性趋势为0.96 m·s-1·(10a)-1, 之后年平均风速的线性趋势为0.37 m·s-1·(10a)-1, 均通过0.01显著性水平检验。7年滑动平均曲线表明, 20世纪80年代后期之前年平均风速偏大, 之后年平均风速偏小。庐山站年平均风速在3.4(2001、2006、2009、2012年)~6.1(1959年) m·s-1之间, 7年滑动平均表明, 20世纪50年代末期以前风速变化不大, 50年代末到80年代初呈下降趋势, 80年代初到90年代初呈弱的上升趋势, 之后风速呈显著下降趋势, 1991年之前的37年中仅有6年为负距平, 之后21年风速均为负距平。黄山站年平均风速在4.7(2011年)~6.7(1972年) m·s-1之间, 1972年以前年平均风速的线性趋势为0.46 m·s-1·(10a)-1(通过0.05显著性水平检验), 1974年以后年平均风速的线性趋势为0.34 m·s-1·(10a)-1(通过0.01显著性水平检验), 7年滑动平均表明, 20世纪60年代中期到90年代中期年平均风速偏大, 60年代中期以前、90年代中期以后年平均风速偏小。
对1957-2012年的年最大小时风速分析发现 (图 2b), 在20世纪60年代中后期以前最大风速明显大于60年代中后期之后, 其中庐山站两个时段平均年最大小时风速差为16.7 m·s-1, 南岳站和黄山站分别为5.8 m·s-1和4.6 m·s-1。3个站前一时段年最大小时风变化不大, 之后呈减弱趋势, 其中南岳站线性趋势为0.46 m·s-1·(10a)-1(通过0.05显著性水平检验), 庐山站和黄山站线性趋势分别为-1.49, -1.09 m·s-1·(10a)-1(均通过0.01显著性水平检验)。
对比分析发现, 南岳站和黄山站多年平均风速接近, 分别为5.8和5.7 m·s-1, 明显大于庐山站 (4.6 m·s-1)。3个站自1969年以来年代际变化特征非常相似, 1969-2012年庐山站与南岳站的相关系数为0.84, 黄山站与南岳站的相关系数为0.72(均通过0.01显著性水平检验); 在20世纪60年代末期之前南岳站风速明显增加, 黄山站风速也呈增加趋势, 而庐山站风速明显减小。3个站年平均风速的时间变化与我国平均风速时间变化比较一致 (王遵娅等, 2004; Vautard et al, 2010), 均呈显著减小趋势, 但南岳站、庐山站风速减小速率更大。
这种地面风速减弱趋势在北半球大部分地区均可观测到, 有研究认为我国风速的减小的实质是亚洲冬、夏季风的减弱 (王遵娅等, 2004), 也可能与全球变暖导致近30年大尺度海陆热力差异减小有关 (中国气象局气候变中国气象局气候变化中心, 2014), 或者与全球变暖造成的陆地植被增加有关 (张爱英等, 2009)。而造成最大小时风速在20世纪60年代中后期发生突变的原因可能是60年代之前我国的地表植被被人为破坏, 导致地面粗糙度减小、最大小时风速偏大, 之后因上述3个站均成为旅游区, 植被受到了较好的保护, 从而导致60年代中后期最大小时风速发生了明显减小的趋势。
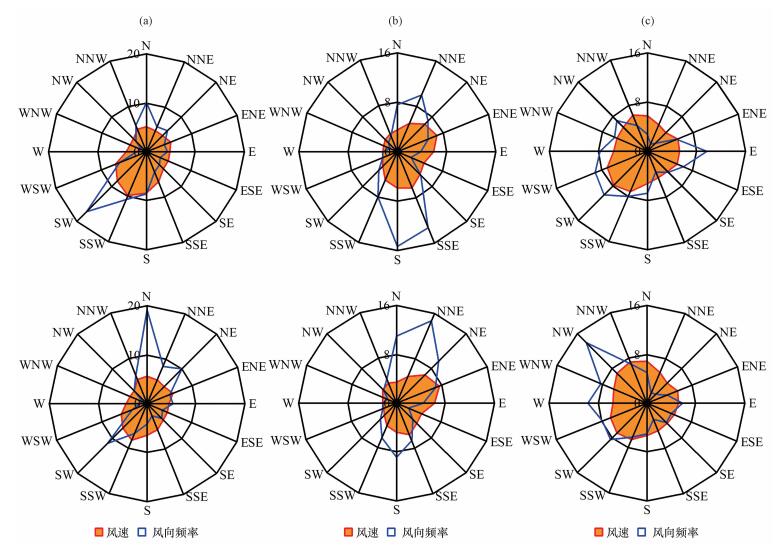
通过对1957-2012年南岳站、庐山站和黄山站每日02:00(北京时, 下同)、08:00、14:00和20:00风向、风速做统计, 分别得到3个站的夏半年 (4-9月) 和冬半年 (10月至次年3月) 平均风向和风速玫瑰图 (图 3, 表 1)。不难看出, 夏半年3个站的主导风向分别为西南风 (SW) 占17.3%, 风速为8.4 m·s-1; 南风 (S) 占15.3%, 风速为5.9 m·s-1; 西南风 (SW) 占10.0%, 风速为7.7 m·s-1。此外, 东风 (E) 可以看成是黄山站的次主导风, 其发生频率为9.7%, 风速为5.2 m·s-1。冬半年3个站的主导风向分别为北风 (N) 占19.1%, 风速为5.6 m·s-1; 北东北风 (NNE) 占14.6%, 风速为4.8 m·s-1; 西北风 (NW) 占14.0%, 风速为7.0 m·s-1。
|
图 3 南岳站 (a)、庐山站 (b)、黄山站 (c) 风向频率和风速玫瑰图 上:夏半年 (4-9月) 平均, 下:冬半年 (10月至次年3月) 平均 Figure 3 The windrose diagrams showing the distributions of wind direction and wind speed at Nanyue (a), Lushan (b) and Huangshan (c) stations.The top and bottom panels show winds in the warm season from April to September and the cold season from October to March, respectively |
| 表 1 南岳站、庐山站和黄山站风速、风向统计特征 Table 1 Statistical characteristics of wind speed and directionat Nanyue, Lushan and Huangshan stations |
从图 3可看出, 3个站风向存在明显的季节转换, 这可能与夏、冬半年分别受东亚夏季风和冬季风控制, 夏半年主导风均为偏南风, 冬半年主导风为偏北风, 但是由于地理位置和地形的差异, 3个站风具有各自的变化特征, 其中南岳站为西南风 (SW) 与北风 (N) 的转换, 南西南风 (SSW) 风速最大; 庐山站为南风 (S) 与东东北风 (NNE) 的转换, 东东北风 (ENE) 风速最大; 黄山站为西南风 (SW) 与西北风 (NW) 转换, 此外黄山站还存在东风 (E) 与西风 (W) 次主导风的转换。南岳站主导风所占的频率最大, 庐山站次之, 黄山站最小; 南岳站、黄山站的风速明显大于庐山站。
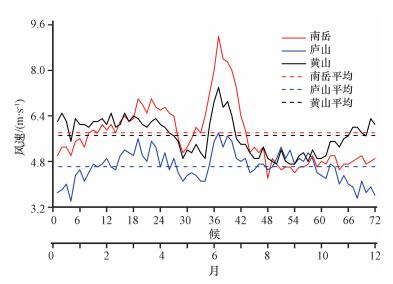
1957-2012年逐候平均风速的变化显示 (图 4), 3个站最大风速均出现在7月, 南岳站、黄山站最小风速出现在9月, 庐山站出现在12月, 南岳站、庐山站四季风速特征表现为“春夏大、秋冬小”, 黄山站则为“秋季小、春夏冬大”; 从候平均风速变化来看, 风速变化呈“双峰型”分布, 分别在第20候 (4月6-10日) 前后、第33候 (6月10-14日) 前后存在峰值。这可能与东亚季风进退有关系, 王遵娅等 (2008)指出在4月第2候至7月第1候为我国江南地区主雨季。
|
图 4 南岳站、庐山站和黄山站多年平均风速的逐候演变 Figure 4 The seasonal cycle of pentad-mean wind speeds at Nanyue, Lushan and Huangshan stations |
对比发现, 第1~18候 (1-3月) 南岳站、庐山站候平均风速呈增大趋势, 黄山站风速变化不大。3个站候平均风速在第19~59候 (3月1日至10月25日) 的变化趋势基本一致, 第60~72候 (11-12月) 南岳站山风速呈略增大趋势, 庐山站风速却呈减小趋势, 黄山站风速呈明显增大趋势。
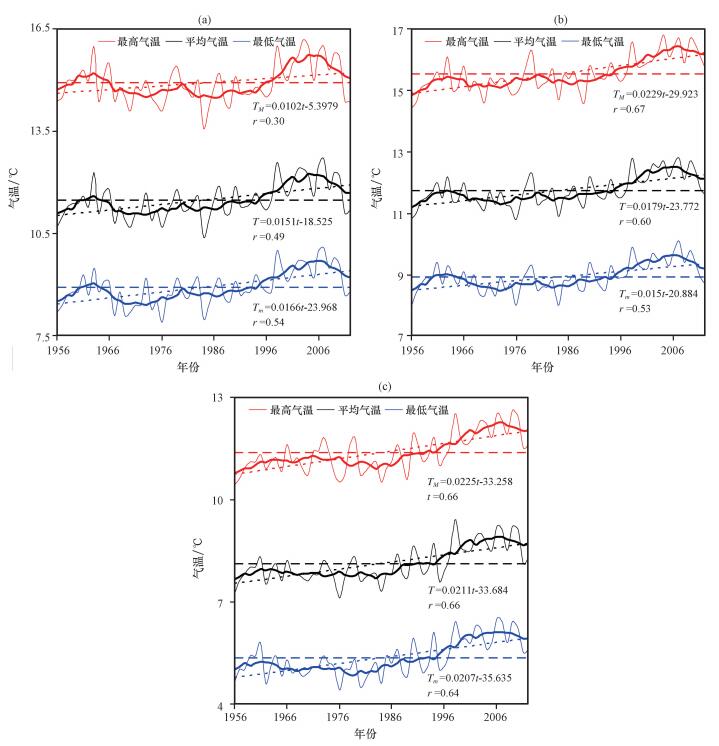
3.2 气温如图 5所示, 1956-2012年3个高山站年平均最低气温、平均气温和最高气温均呈明显上升趋势, 气温时间变化相似。南岳站年平均最低气温增加的幅度最大、平均气温增加幅度次之、最高气温增加幅度最小, 线性趋势分别为0.17, 0.15, 0.10 ℃·(10a)-1(最低气温和平均气温均通过0.01显著性水平检验, 最高气温通过0.05显著性水平检验); 庐山站、黄山站年平均最高气温增加的幅度最大, 平均气温增加幅度次之, 最低气温增加幅度最小, 其中庐山站的线性趋势分别为0.23, 0.18, 0.15 ℃·(10a)-1, 黄山站的线性趋势分别为0.23, 0.21, 0.21 ℃·(10a)-1(均通过0.01显著性水平检验)。7年滑动平均曲线表明, 20世纪最后15年左右增温速度最快, 进入21世纪之后气温增加趋势有所减缓。这与全球表面气温的时间变化比较一致, 全球变暖趋势在持续, 但近15年升温速率趋于平缓, WMO (2011)2010年全球气候状况声明指出2001-2010年的10年是创纪录的最暖10年, 这与长期全球变暖趋势相一致。对比发现, 3个站气温上升趋势与我国气温显著上升趋势是一致的 (中国气象局气候变化中心, 2014), 但增长速率南岳站、庐山站较华中地区更快, 黄山站与华东地区增长速率比较一致。
|
图 5 1956-2012年南岳站 (a)、庐山站 (b) 和黄山站 (c) 年平均最高气温、平均气温、最低气温的逐年变化 细实线表示逐年变化, 粗实线表示7年滑动平均曲线, 长虚线为多年平均线, 短虚线为趋势线 Figure 5 The time series of annual-mean daily maximum, daily mean, and daily minimum temperatures at Nanyue (a), Lushan (b) and Huangshan (c) during the period of 1956-2012.Thin solid lines represent the annual means, thick solid lines represent the 7-year running averages, the short-dashed lines represent the linear trends, and the long-dashed lines represent the climatological averages |
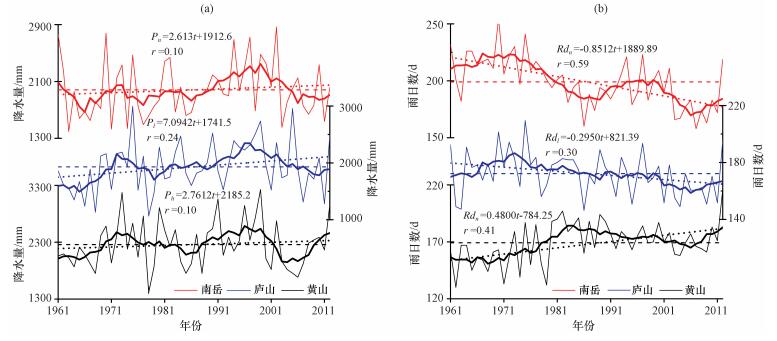
从1961-2012年3个站年降水量和雨日数的时间变化曲线 (图 6) 可看出, 3个站年降水量均呈不显著上升趋势, 线性趋势分别为26.1, 70.9, 28.0 mm·(10a)-1(均未通过0.10显著性水平检验); 7年滑动平均曲线表明, 20世纪60年代中后期到70年代中期、90年代初到本世纪初降水量偏多, 其余时段降水量偏少。这与我国近几十年来主雨带的年代际移动有一定关系, 20世纪90年代主雨带位于长江流域 (严华生等, 2001), 对应三个站处于降水偏多时期, 之后雨带北抬, 长江以南地区降水明显减少 (中国气象局气候变化中心, 2014)。
|
图 6 1961-2012年南岳站、庐山站、黄山站年降水量 (a) 和年雨日数 (b) 的逐年变化 细实线表示逐年变化曲线, 粗实线表示7年滑动平均曲线, 短虚线表示趋势线, 长虚线表示多年平均线 Figure 6 The time series of annual precipitation (a) and rain days (b) at Nanyue, Lushan and Huangshan stations. The green and blue lines denote annual precipitation amount and rain days, respectively.The thin solid lines represent the annual means, the thick solid lines represent the 7-year running averages, the short-dashed lines represent the linear trends, and the long-dashed lines represent the climatological averages |
南岳站、庐山站雨日呈显著减少趋势, 线性趋势分别为-8.5, -3.3 d·(10a)-1(南岳站通过0.01显著性水平检验, 庐山站通过0.05显著性水平检验), 7年滑动平均曲线表明, 雨日数在20世纪80年代初以前偏多, 80年代初至90年代末在平均值附近波动, 90年代末以后偏少; 黄山站雨日数呈显著增多趋势, 线性趋势为4.8 d·(10a)-1(通过0.01显著性水平检验), 7年滑动平均曲线表明, 在20世纪70年代后期之后偏多, 60年代初至70年代后期偏少。南岳站、庐山站雨日数与中国平均雨日数的变化趋势一致 (中国气象局气候变化中心, 2014), 均呈显著减少趋势, 其中南岳站雨日数减少的趋势较中国平均更为明显。
对比发现, 南岳站、庐山站降水量呈不显著增加趋势, 而雨日数呈显著减少趋势, 与很多研究结果比较一致 (陈晓燕, 2010; 张琪和李跃清, 2014), 但黄山站降水量呈不显著增加趋势, 雨日数呈显著增加趋势, 与一些研究结果不尽相同 (张立波等, 2013)。
许多研究表明, 20世纪60年代中期开始, 东亚夏季风有年代际减弱的趋势 (Wang, 2001; Xue, 2001; 宋燕和季劲钧, 2001), 且于20世纪70年代中期出现转折。而全球大气环流也在历史同期发生了一次突变, 并能够清楚地在大气风场、温度和降水等气候要素场的变化上表现出来 (Wang, 2002; 侯伟芬和王谦谦, 2004; 王少鹏等, 2010)。上面的分析显示, 3个高山站风速明显减小的时期与季风的年代际减弱趋势基本吻合, 东亚季风明显减弱可能是引起3个站风速减弱的原因, 同时可能还会影响到温度和降水等气候要素场的变化。前面分析还发现3个站气温与风速的变化趋势相反, 降水量在20世纪70年代中期至本世纪初有较好的反位相关系, 风速呈明显减小趋势, 到90年代至本世纪初风速减小趋势趋缓, 而降水量呈增加的趋势, 在20世纪90年代至21世纪初达到最多的年代, 而南岳站、庐山站在该时段风速为最小。
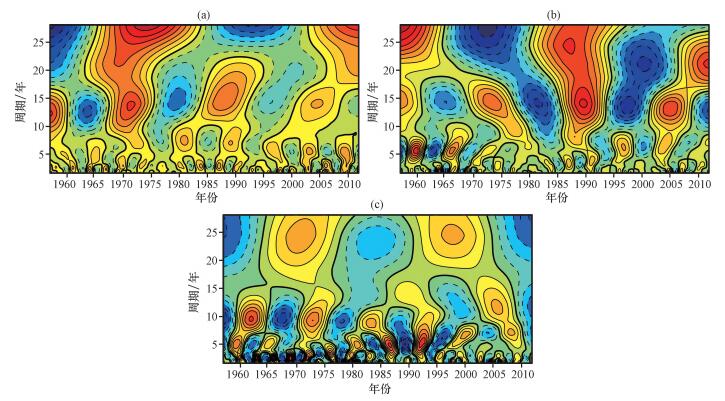
4 气候要素的周期分析 4.1 平均风速Morlet小波分析可以用来揭示时间序列里的周期演变特征 (Torrence and Compo, 1998; 邓自旺和林振山, 1999; 韩荣青等, 2009)。从3个站1957-2012年平均风速的Morlet小波结果 (图 7) 可看出, 南岳站年平均风速存在2~3年、5~7年和15~19年振荡周期 (图 7a), 对其进行Morlet小波功率谱分析发现 (图略), 2~3年振荡周期在20世纪60年代和80年代、还有21世纪最初10年较显著, 准15年振荡周期在1995年以前明显, 随后逐渐减弱消失。
|
图 7 南岳站 (a)、庐山站 (b) 和黄山站 (c) 平均风速的Morlet小波系数实部变化 Figure 7 The real-component contours of the Morlet wavelet coefficients for the wind speed at Nanyue (a), Lushan (b) and Huangshan (c) stations |
庐山站年平均风速可以分析出准2~3年、5~7年、准15年、和准25年的振荡周期 (图 7b)。但是这些周期的功率谱在统计时段内均不显著 (图略)。
黄山站年平均风速存在2~3年、5~7年和准10年的振荡周期 (图 7c), 在20世纪60年代初至80年代初具有显著的2~3年振荡周期, 80年代中后期至90年代初具有显著的5~7年振荡周期 (图略)。
4.2 气温对3个站1956-2012年平均气温、平均最高气温和平均最低气温进行Morlet小波分析 (图略) 发现, 3个站的周期变化类似, 均存在3个特征时间尺度, 分别是2~3年、5~7年和准15年左右的振荡周期。其中南岳站气温在20世纪60年代初至70年代初、90年代初、20032010年2~3年振荡周期较显著, 70年代末至2004年5~7年振荡周期较明显; 庐山站气温在60年代初至60年代末、80年代中期至90年代初、2005年前后2~3年振荡周期较显著, 70年代中期至90年代中后期5~7年振荡周期较明显; 黄山站气温在60年中期、2005-2010年2~3年振荡周期较显著, 70年代中期至2000年前后5~7年振荡周期较明显。
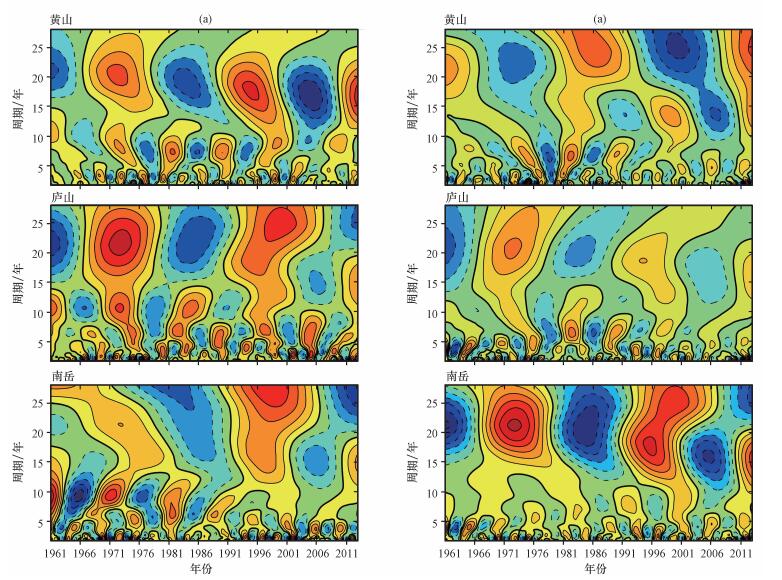
4.3 降水和雨日图 8给出3个站1961-2012年降水量和雨日的Morlet小波结果。南岳站降水存在2~3年和准10年的振荡周期, 在20世纪80年代中期以前、90年代中期至2005年2~3年振荡周期较显著 (图略)。庐山站降水量存在2~3年、5~7年、准10年和准22年的振荡周期, 在统计时段内2~3年振荡周期均较显著 (图略)。黄山站降水存在2~3年、6~10和15~20年左右的振荡周期, 在60年代中期至2005年前后2~3年振荡周期较显著, 在80年代初至80年代后期6~10年振荡周期较显著 (图略)。
|
图 8 南岳站、庐山站和黄山站年降水量的Morlet小波系数实部变化 Figure 8 The real-component contours of Morlet wavelet coefficients for annual precipitation at Nanyue, Lushan and Huangshan stations |
南岳站、庐山站雨日数均存在2~3年、5~7年、准10年和准22年左右的振荡周期, 其中南岳站在70年代中期以前、80年代初至80年代末、90年代初至2005年2~3年振荡周期较显著, 庐山站在60年代末至80年代初、80年代末至2010年2~3年振荡周期较显著, 在80年代初至80年代中期4~6年振荡周期较显著 (图略)。黄山站雨日数存在2~3年、5~7年、准10年和准25年左右的振荡周期, 在80年代末以前2~3年振荡周期较显著。
上述3个站气象要素的2~3年振荡周期与平流层大气环流的准2年周期振荡 (QBO) 和对流层大气环流的准2年周期振荡 (TBO)(郑彬和梁建茵, 2005; 李建平和曾庆存, 2005; 徐建军等, 1997; 贾建颖等, 2009) 比较一致。这可能是由于平流层QBO通过改变对流层的大气环流形势从而影响着对流层中的季风环流、降水过程 (郑彬等, 2010)。5~7年左右的振荡周期可能与ENSO事件的3~7年的准周期相关, ENSO事件是气候系统年际变化中的最强外强迫信号, 以遥相关的形式间接影响全球天气气候的变化 (施能等, 2004)。10~15年、20~25年左右的振荡周期与太阳活动的准11年、22年振荡周期比较一致, 说明3个站气象要素的变化可能受太阳活动影响 (段长春和孙绩华, 2006; 周群和陈文, 2012)。
5 结论与讨论(1) 南岳、庐山和黄山3个高山站年平均风速均呈明显减小趋势, 三3个站在20世纪60年代末期之后时间变化特征相似, 3个站年最大小时风速在20世纪60年代中后期明显减小, 之前最大小时风速较大, 变化趋势不明显, 之后最大小时风速明显减小, 且呈显著减小趋势。3个站风向存在明显的季节转换, 夏半年盛行偏南风, 冬半年盛行偏北风。南岳站和庐山站风速呈现“春夏大、秋冬小”, 黄山站呈现“秋季小、春夏冬大”。3个站有比较一致的2~3年、5~7年周期变化, 在大周期变化略有不同, 其中南岳站为15~20年、其他两站为20~25年。
(2)3个站气温均呈明显上升趋势, 南岳站年平均最低气温增加的幅度最大、平均气温增加幅度次之、最高气温增加幅度最小, 而庐山站和黄山站反之。南岳站多年平均气温、平均最高气温均低于庐山, 两站多年平均最低气温均为8.9 ℃。黄山站海拔较另外两站高, 气温均低于两站3~4 ℃。3个站气温存在2~3年、5~7年和准15年的振荡周期。
(3)3个站降水量均呈不显著上升趋势, 南岳站、庐山站雨日数呈显著下降趋势, 黄山站呈显著上升趋势。3个站降水量有比较一致的2~3年、5~7年的周期变化, 在大周期变化有所不同。3个站雨日数的周期变化比较一致, 均存在2~3年、5~7年、准11年和准25年周期。
本文只是从气候统计上对我国中东部3个高山站气象要素的变化特征做了对比分析, 缺乏对风速、气温、降水三者关系的内在机理研究, 且3个站气象要素的天气气候成因及与低海拔站的气候变化差异等并未涉及, 这将是下一步研究的方向。此外, 3个站气象要素的周期变化与平流层、ENSO、太阳活动的联系也需要更进一步的研究。
| Barry R G. 2008. Mountain Weather and Climate[M]. 3rd Edition. Cambridge: Cambridge University Press. | |
| Beniston M, Diaz H F, Bradley R S. 1997. Climatic change at high elevation sites:An overview[J]. Climatic Change, 36: 233–251. DOI:10.1023/A:1005380714349 | |
| Beniston M, Stephenson D. 2004. Extreme climatic events and their evolution under changing climatic conditions[J]. Global Planet Change, 44: 1–9. DOI:10.1016/j.gloplacha.2004.06.001 | |
| Bücher A, Dessens J. 1991. Secular trend of surface temperature at an elevated observatory in the Pyrenees[J]. J Climate, 4: 859–868. DOI:10.1175/1520-0442(1991)004<0859:STOSTA>2.0.CO;2 | |
| Chan R Y, Vuille M, Hardy D R, et al. 2007. Intraseasonal precipitation variability on Kilimanjaro and the East African region and its relationship to the large-scale circulation[J]. Theor Appl Climatol, 93: 149–165. | |
| Chen H, Yu R, Li J, et al. 2010. Why nocturnal long-duration rainfall presents an eastward-delayed diurnal phase of rainfall down the Yangtze River Valley[J]. J Climate, 23: 905–917. DOI:10.1175/2009JCLI3187.1 | |
| Gultepe I, Isaac G A, Joe P, et al. 2014. Roundhouse (RND) mountain top research site:Measurements and uncertainties for winter alpine weather conditions[J]. Pure Appl Geophys, 171: 59–85. DOI:10.1007/s00024-012-0582-5 | |
| Joe P, Doyle C, Wallace A, et al. 2010. Weather services, science advances, and the Vancouver 2010 Olympic and Paralympic Winter Games[J]. Bull Amer Meteor Soc, 91: 31–36. DOI:10.1175/2009BAMS2998.1 | |
| Karl T R, Diaz H F, Kukla G. 1998. Urbanization:Its detection and effect in the United States climate record[J]. J Climate, 1: 1099–1123. | |
| Milbrandt J A, Thériault J, Mo R. 2014. Modeling the phase transition associated with melting snow in a 1D kinematic framework:Sensitivity to the microphysics[J]. Pure Appl Geophys, 171: 303–322. DOI:10.1007/s00024-012-0552-y | |
| Mo R, Joe P, Isaac G A, et al. 2014. Mid-mountain clouds at Whistler during the Vancouver 2010 Winter Olympics and Paralympics[J]. Pure Appl Geophys, 171: 157–183. DOI:10.1007/s00024-012-0540-2 | |
| Stekl J, Podzimek J. 1993. Old mountain meteorological station Milesovka (Donnersberg) in central Europe[J]. Bull Amer Meteor Soc, 74: 831–834. DOI:10.1175/1520-0477(1993)074<0831:OMMSMI>2.0.CO;2 | |
| Stekl J, Podzimek J. 2012. Old mountain meteorological station Milesovka (Donnersberg) in Central Europe[J]. Bull Amer Meteor Soc, 74: 831–834. | |
| Torrence C, Compo G P. 1998. A practical guide to wavelet analysis[J]. Bull Amer Meteor Soc, 79(1): 61–78. DOI:10.1175/1520-0477(1998)079<0061:APGTWA>2.0.CO;2 | |
| Vautard R, J Cattiaux, Yiou P, et al. 2010. Northern Hemisphere atmospheric stilling partly attributed to an increase in surface roughness[J]. Nature Geoscience, 3: 756–761. DOI:10.1038/ngeo979 | |
| Wang Huijun. 2001. The weakening of the Asian monsoon circulation after the end of 1970's[J]. Adv Atmos Sci, 18(3): 376–386. DOI:10.1007/BF02919316 | |
| Wang Huijun. 2002. The instability of the East Asian summer monsoon-ENSO relations[J]. Adv Atmos Sci, 19(1): 1–11. DOI:10.1007/s00376-002-0029-5 | |
| Weber R O, Talkner P, Auer I, et al. 1997. 20th-century changes of temperature in the mountain regions of central Europe[J]. Climatic Change, 36: 327–344. DOI:10.1023/A:1005378702066 | |
| Williams C, Avery S. 1996. Diurnal winds observed in the tropical troposphere using 50 MHz wind profilers[J]. J Geophys Res, 101: 15051–15060. DOI:10.1029/96JD01013 | |
| WMO (2010).2011.WMO statement on the status of the global climate in 2010[R].Press release No.1074. | |
| Xue Feng. 2001. Interannual to interdecadal variation of East Asian summer monsoon and its association with the global atmospheric circulation and sea surface temperature[J]. Adv Atmos Sci, 18(4): 567–575. DOI:10.1007/s00376-001-0045-x | |
| Yu R, Li J, Chen H. 2009. Diurnal variation of surface wind over central eastern China[J]. Clim Dyn, 33: 1089–1097. DOI:10.1007/s00382-008-0478-3 | |
| 陈德桥, 戴泽军, 叶成志, 等. 2012. 南岳高山1953-2010年风的气候特征分析[J]. 气象, 38(8): 977–984. Chen Deqiao, Dai Zejun, Ye Chengzhi, et al. 2012. An analysis of climatic variations in winds observed at the Nanyue Mountain observatory during 1953-2010[J]. Meteor Mon, 38(8): 977–984. | |
| 陈德桥, 戴泽军, 叶成志, 等. 2014. 我国中东部两个高山气象站风的气候特征及对夏季风的响应[J]. 热带气象学报, 31(1): 137–144. Chen Deqiao, Dai Zejun, Ye Chengzhi, et al. 2014. Climatological characteristics of winds at two mountainous meteorological stations in central-eastern china and their responses to the summer monsoon[J]. J Trop Meteor, 31(1): 137–144. | |
| 陈静静, 叶成志, 陈红专, 等. 2011. "10·6"湖南大暴雨过程MCS的环境流场特征及动力分析[J]. 暴雨灾害, 30(4): 313–320. Chen Jingjing, Ye Chengzhi, Chen Hongzhuan, et al. 2011. Characteristics of the environmental flow of MCS and its dynamic conditions in 10·6 heavy rainfall in Hunan Province[J]. Torrential Rain and Disasters, 30(4): 313–320. | |
| 陈静静, 叶成志, 傅承浩, 等. 2015. 5类南岳高山气象站风场对湖南不同天气型强降水的指示作用[J]. 暴雨灾害, 34(2): 126–132. Chen Jingjing, Ye Chengzhi, Fu Chenghao, et al. 2015. Indicative significance of five patterns of wind at the Nanyue Mountain Meteorological Station on various severe precipitation events in Hunan[J]. Torrential Rain and Disasters, 34(2): 126–132. | |
| 陈乾, 陈添宇, 张逸轩, 等. 2011. 祁连山区能量场特征与降水分布的关系分析[J]. 冰川冻土, 33(5): 1046–1054. Chen Qian, Chen Tianyu, Zhang Yixuan. 2011. Analyses of energy field characteristics and precipitation in Qilian Mountains[J]. J Glaciology Geocryology, 33(5): 1046–1054. | |
| 陈晓燕, 尚可政, 王式功, 等. 2010. 近50年中国不同强度降水日数时空变化特征[J]. 干旱区研究, 27(5): 766–772. Chen Xiaoyan, Shang Kezheng, Wang Shigong, et al. 2010. Analysis on the spatiotemporal characteristics of precipitation under different intensities in China in recent 50 years[J]. Arid Zone Res, 27(5): 766–772. | |
| 戴进, 余兴, 徐小红. 2008. 秦岭地区气溶胶对地形云降水的抑制作用[J]. 大气科学, 32(6): 1319–1332. Dai Jin, Yu Xing, Xu Xiaohong, et al. 2008. The suppression of aerosols to the orographic precipitation in the Qinling Mountains[J]. Chinese J Atmos Sci, 32(6): 1319–1332. | |
| 林振山, 邓自旺. 1999. 子波气候诊断技术的研究[M]. 北京: 气象出版社. Lin Zhenshan, Deng Ziwang. 1999. The research of the diagnostic techniques of wavelet climatologies[M]. Beijing: China Meteorological Press. | |
| 丁仁海, 王学龙. 2009. 九华山暴雨地形增幅作用的观测分析[J]. 暴雨灾害, 28(4): 377–381. Ding Renhai, Wang Longxue. 2009. Observational analysis of topograpical effect on heavy rainfall in Jiuhua Mountain[J]. Torrential Rain and Disasters, 28(4): 377–381. | |
| 董佩明, 赵思雄. 2004. 引发梅雨锋暴雨的频发型中尺度低压 (扰动) 的诊断研究[J]. 大气科学, 28(6): 876–891. Dong Peiming, Zhao Sixiong. 2004. A diagnostic study of mesoscale lows (disturbances) on Meiyu Front and associated heavy rainfall[J]. Chinese J Atmos Sci, 28(6): 876–891. | |
| 段春锋, 缪启龙, 曹雯, 等. 2012. 以高山站为背景研究城市化对气温变化趋势的影响[J]. 大气科学, 36(4): 811–822. Duan Chunfeng, Miao Qilong, Cao Wen, et al. 2012. Effect of urbanization on variation trends of air temperatures based on mountain stations[J]. Chinese J Atmos Sci, 36(4): 811–822. | |
| 段长春, 孙绩华. 2006. 太阳活动异常与降水和地面气温的关系[J]. 气象科技, 34(4): 381–386. Duan Changchun, Sun Jihua. 2006. Relationship between abnormal solar activities and precipitation and temperature in China[J]. Meteor Sci Technol, 34(4): 381–386. | |
| 韩荣青, 陈丽娟, 李维京, 等. 2009. 2-5月我国低温连阴雨和南方冷害的时空分布特征[J]. 应用气象学报, 20(3): 312–320. Han Rongqing, Chen Lijuan, Li Weijing, et al. 2009. The spatial and temperal characteristics of China continuous cold rainy weather and south cold damage from February to May[J]. J Appl Meteor Sci, 20(3): 312–320. | |
| 侯伟芬, 王谦谦. 2004. 江南地区近50年地面气温的变化特征[J]. 高原气象, 23(3): 400–406. Hou Weifen, Wang Qianqian. 2004. The change characteristics of surface air temperature between Changjiang River and Nanling Mountain in recent 50 years[J]. Plateau Meteor, 23(3): 400–406. | |
| 贾建颖, 孙照渤, 刘向文, 等. 2009. 中国东部夏季降水准两年周期振荡的长期演变[J]. 大气科学, 33(2): 397–407. Jia Jianying, Sun Zhaobo, Liu Xiangwen, et al. 2009. Evolution of summer precipitation quasi-biennial oscillation in eastern China[J]. Chinese J Atmos Sci, 33(2): 397–407. | |
| 李建平, 曾庆存. 2005. 一个新的季风指数及其年际变化和与雨量的关系[J]. 气候与环境研究, 10(3): 351–365. Li Jianping, Zeng Qingcun. 2005. A new monsoon index, its interannual variability and relation with monsoon precipitation[J]. Climatic Environ Res, 10(3): 351–365. | |
| 林长城, 肖辉, 赵卫红, 等. 2006. 福建高山、重点城市春季TSP对降水酸度的影响[J]. 热带气象学报, 22(4): 405–410. Lin Changcheng, Xiao Hui, Zhao Weihong, et al. 2006. The influence of TSP on acidity of rain water in high-mountain and urban areas during springtime in Fujian Province[J]. J Trop Meteor, 22(4): 405–410. | |
| 刘增基, 林新彬, 王世德, 等. 1997. 闽南地区汛期短历时降水气候特征[J]. 气象, 23(8): 50–54. Liu Zengji, Lin Xinbin, Wang Shide, et al. 1997. The climatic features analysis of short-period precipitation in South Fujian during rainy season[J]. Meteor Mon, 23(8): 50–54. | |
| 施能, 陈绿文, 封国林, 等. 2004. 1920-2000年全球陆地降水气候特征与变化[J]. 高原气象, 23(4): 435–443. Shi Neng, Chen Luwen, Feng Guolin, et al. 2004. Climate characters and changes in global land precipitation field from 1920 to 2000[J]. Plateau Meteor, 23(4): 435–443. | |
| 宋燕, 季劲钧. 2001. 60年代亚非夏季风十年尺度的突变[J]. 大气科学, 25(2): 200–208. Song Yan, Ji Jinjun. 2001. The interdecadal abrupt change of the African-Asian summer monsoon in the 1960s[J]. Chinese J Atmos Sci, 25(2): 200–208. | |
| 孙淑清. 1979. 关于低空急流对暴雨触发作用的一种机制[J]. 气象, 5(4): 8–10. Sun Shuqing. 1979. A mechanism of triggering effect of low level jet on heavy rain[J]. Meteor Mon, 5(4): 8–10. | |
| 王娟, 姜卉芳, 穆振侠, 等. 2011. 高寒山区气温垂直分布的估测方法研究——以玛纳斯河为例[J]. 水资源与水工程学报, 22(3): 44–47. Wang Juan, Jiang Huifang, Mu Zhenxia, et al. 2011. Research on estimating method on vertical distribution of air temperature at high and cold mountain area:Case of the Manas River[J]. J Water Resources & Water Engineering, 22(3): 44–47. | |
| 王少鹏, 王志恒, 朴世龙, 等. 2010. 我国40年来增温时间存在显著的区域差异[J]. 科学通报, 55(16): 1538–1543. Wang Shaopeng, Wang Zhiheng, Piao Shilong, et al. 2010. Regional differences in the timing of recent air warming during the past four decades in China[J]. Chinese Sci Bull, 55(16): 1538–1543. | |
| 王毅荣, 张存杰. 2006. 河西走廊风速变化及风能资源研究[J]. 高原气象, 25(6): 1196–1202. Wang Yirong, Zhang Cunjie. 2006. Changes of wind speed and wind energy over Gansu Corridor[J]. Plateau Meteor, 25(6): 1196–1202. | |
| 王遵娅, 丁一汇, 何金海, 等. 2004. 近50年来我国气候变化特征的再分析[J]. 气象学报, 62(2): 228–236. Wang Zunya, Ding Yihui, He Jiinhai, et al. 2004. An updating analysis of the climate change in China in recent 50 years[J]. Acta Meteor Sinica, 62(2): 228–236. | |
| 王遵娅, 丁一汇. 2008. 中国雨季的气候学特征[J]. 大气科学, 32(1): 1–13. Wang Zunya, Ding Yihui. 2008. Climatic characteristics of rainy seasons in China[J]. Chinese J Atmos Sci, 32(1): 1–13. | |
| 魏凤英. 1999. 现代气候统计诊断与预测技术[M]. 北京: 气象出版社. Wei Fengying. 1999. Comtemporary techniques on statistic diagnoses and prediction of climate[M]. Beijing: China Meteorological Press. | |
| 徐建军, 朱乾根, 施能. 1997. 近百年东亚季风长期变化中主周期振荡的奇异谱分析[J]. 气象学报, 55(5): 620–627. Xu Jianjun, Zhu Qiangen, Shi Neng. 1997. The singular spectral analysis of periodic oscillation in long-term variation of East-Asian monsoon in recent century[J]. Acta Meteor Sinica, 55(5): 620–627. | |
| 严华生, 李艳, 曹杰, 等. 2001. 近百年中国汛期雨带类型气候变化[J]. 热带气象学报, 17(4): 462–468. Yan Huasheng, Li Yan, Cao Jie, et al. 2001. The climatic variation law of rain belt type in flood seasons of about 100 years in China[J]. J Trop Meteor, 17(4): 462–468. | |
| 叶成志, 陈静静, 傅承浩. 2012. 南岳高山站风对湖南2011年6月两例暴雨过程的指示作用[J]. 暴雨灾害, 31(3): 242–247. Ye Chengzhi, Chen Jingjing, Fu Chenghao. 2012. Wind variations at the Nanyue Mountain Observatory as indicators for two different kinds of heavy precipitation in Hunan[J]. Torrential Rain and Disasters, 31(3): 242–247. | |
| 尹洁, 毛亮, 张剑明, 等. 2014. 南岳站风对赣北暴雨的指示作用[J]. 暴雨灾害, 33(4): 363–371. Yin jie, Mao Liang, Zhang Jianming, et al. 2014. Indicative analysis of wind variations at the Nanyue Mountain Station to heavy rain over Northern Jiangxi[J]. Torrential Rain and Disasters, 33(4): 363–371. | |
| 张爱英, 任国玉, 郭军, 等. 2009. 近30年我国高空风速变化趋势分析[J]. 高原气象, 28(3): 680–687. Zhang Aiying, Ren Guoyu, Guo Jun, et al. 2009. Change trend analyses on upper-air wind speed over china in past 30 years[J]. Plateau Meteor, 28(3): 680–687. | |
| 张立波, 景元书, 娄伟平, 等. 2013. 近50a华东地区雨日数及降水量的变化特征[J]. 大气科学学报, 36(4): 426–433. Zhang Libo, Jing Yuanshu, Lou Weiping, et al. 2013. Variability of rainy days and rainfall in East China in recent 50years[J]. Trans Atmos Sci, 36(4): 426–433. | |
| 张琪, 李跃清. 2014. 近48年西南地区降水量和雨日的气候变化特征[J]. 高原气象, 33(2): 372–383. DOI:10.7522/j.issn.1000-0534.2013.00032 Zhang Qi, Li Yueqing. 2014. Climatic variation of rainfall and rain day in Southwest China for last 48 years[J]. Plateau Meteor, 33(2): 372–383. DOI:10.7522/j.issn.1000-0534.2013.00032 | |
| 张万诚, 万云霞, 肖子牛, 等. 2006. 中国西南纵向岭谷区近百年降水的时空变化特征[J]. 自然资源学报, 21(5): 802–809. Zhang Wancheng, Wan Yunxia, Xiao Ziniu, et al. 2006. The spatio-temporal variations of the longitudinal range-gorge region precipitation in recent 100 years in southeast China[J]. J Natural Resources, 21(5): 802–809. | |
| 赵成义, 施枫芝, 盛钰, 等. 2011. 近50a来新疆气温降水随海拔变化的区域分异特征[J]. 冰川冻土, 33(6): 1203–1213. Zhao Chengyi, Shi Fengzhi, Sheng Yu, et al. 2011. Regional differentiation characteristics of precipitation changing with altitude in Xinjiang region in recent 50 years[J]. J Glaciology Geocryology, 33(6): 1203–1213. | |
| 赵玉春, 许小峰, 崔春光. 2012. 中尺度地形对梅雨锋暴雨影响的个例研究[J]. 高原气象, 31(5): 1268–1282. Zhao Yuchun, Xu Xiafeng, Cui Chunguang. 2012. Case study of the impact of mesoscale topography on the Meiyu Frontal Rrainstorm[J]. Plateau Meteor, 31(5): 1268–1282. | |
| 郑彬, 梁建茵. 2005. 对流层准两年周期振荡的研究进展[J]. 热带气象学报, 21(1): 79–86. Zheng Bin, Liang Jianyin. 2005. Advance in studies of tropospheric biennial osciliation[J]. J Trop Meteor, 21(1): 79–86. | |
| 郑彬, 林爱兰, 谷德军, 等. 2010. 对流层准两年周期振荡最新研究进展[J]. 热带气象学报, 26(4): 504–508. Zheng Bin, Lin Ailan, Gu Dejun, et al. 2010. The latest research progress on the tropospheric biennial oscillation[J]. J Trop Meteor, 26(4): 504–508. | |
| 中国气象局气候变化中心. 2014. 中国气候变化监测公报 (2013年)[R]. 北京: 气象出版社. Center on Climate Change CMA.2014.China climate change bulletin (2013)[R].Beijing:Meteorological Press. | |
| 周群, 陈文. 2012. 太阳活动11年周期对ENSO事件海温异常演变和东亚降水的影响[J]. 大气科学, 36(4): 851–862. Zhou Qun, Chen Wen. 2012. Influence of the 11-year solar cycle on the evolution of ENSO-related SST anomalies and rainfall anomalies in East Asia[J]. Chinese J Atmos Sci, 36(4): 851–862. |
2. Hunan Climate Center, Changsha 410118, China;
3. National Laboratory for Coastal and Mountain Meteorology, Environment and Climate Change Canada, Vancouver, BC, Canada
 2017, Vol. 36