2. 中国科学院内陆河流域生态水文重点实验室, 兰州 730000;
3. 中国科学院大学, 北京 100049
IPCC第五次气候变化评估报告指出:过去半个世纪以来, 全球几乎所有地区都经历了升温过程, 变暖最快的区域为北半球中纬度地区(Ji et al, 2014)。中国西北地区气温上升速率高达0.34 ℃·(10a)-1, 明显高于全球平均水平(0.12 ℃·(10a)-1)(赵传成等, 2011)。Hansen et al(1999)指出北半球中高纬度地区冬季增暖明显。李庆祥等(2010)和张世轩等(2011)发现中国冬季气温升高幅度高于年均值。任国玉等(2005)指出, 我国增温最明显区域为北方和青藏高原地区, 最显著季节为冬春季。Chen et al(2014)认为, 西北地区冬季气温变化对年平均气温升高的贡献率高达57.01%。因此, 西北地区冬季大幅度升温可能是拉动年平均温度抬升的主要原因。
负积温是指日平均气温稳定小于0 ℃的温度总和, 综合反映了冷季的持续时间和低温强度, 能较好的反映冷季寒冷程度。在负积温研究方面, 陈建文等(2003)、桑建人等(2007)以及杨小利和辛吉武(2007)分别对不同区域负积温的变化特征进行分析; 顾卫等(2002)用负积温指标分析了渤海和黄海北部海冰的时空分布特征; 钱锦霞等(2014)和郑冬晓等(2015)具体分析了负积温与冬小麦种植区、冻害频率的关系; 牛丽等(2011)用负积温指标表征冻土变化趋势, 分析了西北地区典型流域冻土退化对水文过程的影响; 刘德祥等(2005)、孙兰东和刘德祥(2008)分别对西北地区热量资源研究表明, 西北地区小于0 ℃的负积温资源绝对值减少非常明显, 其气候变暖主要归结于最低气温的升高。以上研究虽然关注了负积温的变化特征及其与农业布局、冻害频率等的关系, 但均以有限的气象站点资料表征整个研究区或不同分区, 未能考虑到气象要素的空间变异性, 不足以准确反映研究区负积温时空变化特征。有研究表明, 全球的升温效应在高纬度和高海拔地区被放大, 并且产生了很大影响(曹斌等, 2015)。因此, 对于我国高海拔山区负积温的详细研究亟待开展。
祁连山区位于青藏高原东北边缘, 具有高山、积雪、冰川、山谷、盆地等较为复杂的地形地貌, 是石羊河、黑河和疏勒河的发源地, 是河西走廊绿洲的生命之源(尹宪志等, 2009), 也是巴丹吉林沙漠和腾格里沙漠生态维持的基础。祁连山是气候变化的敏感地带, 但山区气象站点较少且主要分布在中低山带(王兴等, 2010), 站点信息难以较准确反映山区整体变化。因此, 在祁连山区负积温栅格化基础上, 探讨山区负积温时空分布及变化的研究方法, 分析负积温时空分布、变化及转移情况, 为山区畜牧业布局、物候变化、植被带移动、沙尘暴频率、冻土退化以及水资源管理等研究提供科学参考。
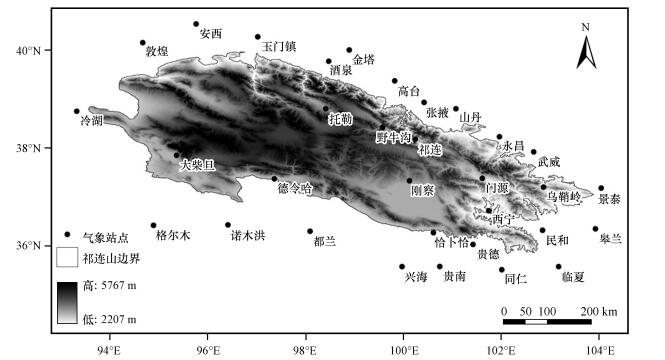
2 资料选取与方法介绍 2.1 资料选取气象数据来源于中国气象科学数据共享服务网, 包括祁连山区及周边共32个国家站点逐日平均气温, 以及各气象站点经纬度和高程数据(图 1)。DEM数据来源于中国西部环境与生态科学数据中心, 空间分辨率为90 m。

|
图 1 研究区域及气象站点分布 Figure 1 The study area and the distribution of meteorological stations |
选用负积温初日、终日和持续时间表征负积温时长变化特征。为消除日平均气温逐日变化的不稳定波动, 采取农业气候学中常用的5日滑动平均法(马德栗和陈正洪, 2010; 郑冬晓等, 2015), 来确定日平均气温稳定通过小于0 ℃的初日和终日, 初日和终日之间的日数记为持续时间。
2.2.2 负积温动态度指标负积温动态度指标反映研究区年代间某积温段面积变化幅度, 即:
| $ K = \frac{{{A_2} - {A_1}}}{{{A_1}}} \times \frac{1}{{{t_2} - {t_1}}} \times 100\% , $ | (1) |
式中: K为负积温动态度; A1为t1年代负积温面积; A2为t2年代负积温面积; t2 -t1为年代间隔; A2-A1为年代间隔内负积温面积变化量。
2.2.3 负积温变化重要性指数运用负积温变化重要性指数(Ci), 筛选出负积温变化的主要积温段, 即:
| $ {C_i} = {A_i}/A \times 100\% , $ | (2) |
| $ A = \sum\limits_{i = 1}^n {{A_i}} , $ | (3) |
式中: Ci为积温段i的负积温变化重要性指数; Ai为积温段i负积温变化面积; A为研究区各积温段负积温变化面积之和; Ci值越大, 说明积温段i变化越占主导。
由于负积温为负值, 为便于叙述和比较, 对于负积温的描述用绝对值表示。为便于时空变化分析, 把负积温分为6个积温段: Ⅰ(3000 ℃以上)、Ⅱ(2500~3000 ℃)、Ⅲ(2000~2500 ℃)、Ⅳ(1500~2000 ℃)、Ⅴ(1000~1500 ℃)、Ⅵ(1000 ℃以下)。
2.3 研究方法 2.3.1 线性回归法采用线性回归法, 分析32个气象站点1960-2015年负积温时长变化趋势。线性方程的斜率表征时间序列的平均趋势, 即:
| $ y = b + at, $ | (4) |
式中: t为时间序列; b为回归截距; a为回归斜率; 本文以a的10倍作为时间序列的平均趋势。
2.3.2 负积温栅格化许多学者针对气象数据栅格化问题已经进行了一系列研究(岳文泽等, 2005; 王智等, 2012)。本文采用“多元回归+残差插值”方法进行负积温栅格化操作。具体方法:利用数字高程模型DEM获取研究区经度、纬度、海拔等要素, 以28个(90%)站点负积温作为输出变量, 以站点经度、纬度和海拔作为输入变量构建多元回归方程并计算回归负积温, 然后利用实际观测负积温与回归负积温相减得到残差, 分别利用反距离权重IDW、普通克里格OK、样条函数SPLINE三种常见空间插值方法对残差结果进行空间插值, 最后将空间化的回归负积温与残差插值相加得到预测结果, 利用余下4个(10%)站点的实际观测值, 采用交叉验证方法(岳文泽等, 2005; 王智等, 2012), 选取平均绝对误差MAE、平均相对误差MRE和均方根误差RMSE作为评价指标, 准确验证不同方法之间的相对精度。
3 结果与分析 3.1 不同插值方法结果对比通过分析表 1和表 2, 研究区负积温多元线性回归方程拟合效果较好, R2均高于0.86, 且均通过了显著性检验。通过交叉验证, 普通克里格OK插值方法平均绝对误差MAE、平均相对误差MRE和均方根误差RMSE三个指标精度均最高。故本文采用普通克里格OK插值方法获得的数据对研究区负积温进行分析。
| 表 1 研究区负积温多元线性回归方程 Table 1 Multiple linear regression equations of accumulated negative temperature in Qilian Mountains |
| 表 2 三种插值方法误差交叉验证结果 Table 2 Results of cross-validation errors by three methods |
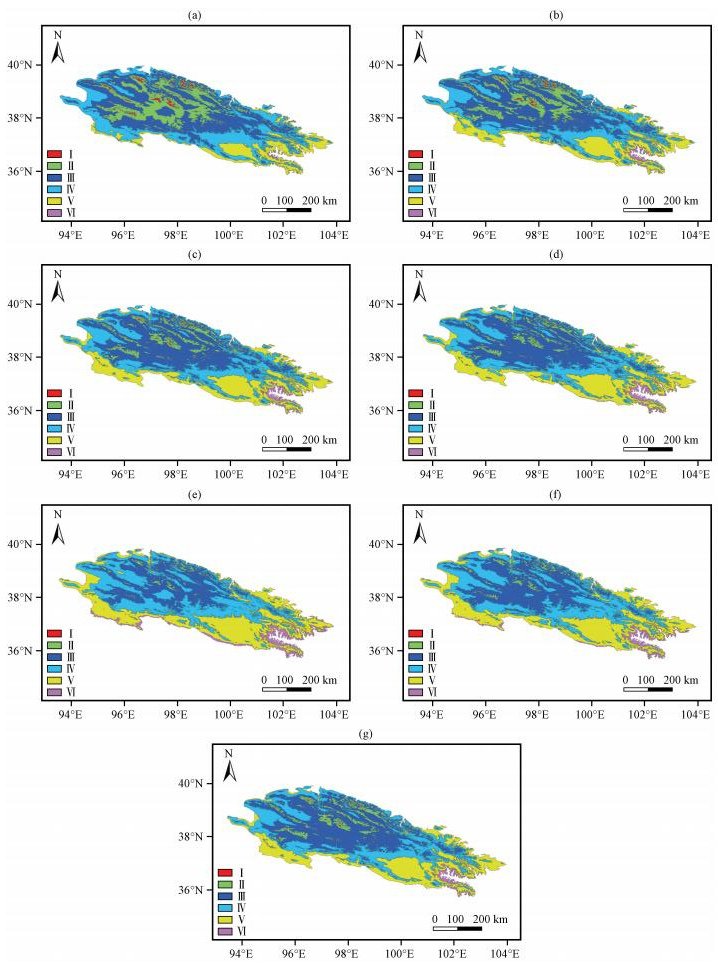
采用“多元回归+残差插值”方法, 通过普通克里格OK插值, 分别获取祁连山区不同时段负积温空间分布及变化资料(图 2, 图 3)。

|
图 2 研究区负积温空间分布 (a) 1960年代, (b) 1970年代, (c) 1980年代, (d) 1990年代, (e) 2000年代, (f) 2010年以后(2010-2015年), (g)多年平均(1960-2015年) Figure 2 The spatial distribution of accumulated negative temperature in Qilian Mountains. (a)1960s, (b) 1970s, (c) 1980s, (d) 1990s, (e) 2000s, (f) after 2010 (from 2010 to 2015), (g) multi-year average from 1960 to 2015 |

|
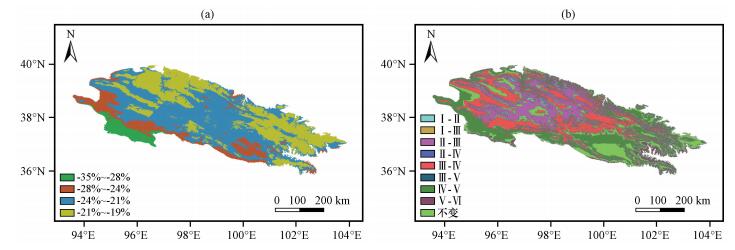
图 3 研究区负积温空间变化(1960年代至2010年以后) (a)负积温动态度空间分布, (b)负积温类型空间转移 Figure 3 The spatial change of accumulated negative temperature in Qilian Mountains from 1960s to after 2010. (a) dynamic index of accumulated negative temperature, (b) transfer types of accumulated negative temperature |
祁连山区多年平均(19602015年)负积温分布在607~3507 ℃之间, 平均值为1851 ℃, 区域分布差异性较大; 从面积角度分析, 积温段面积比重Ⅲ(34.30%)>Ⅳ(31.68%)>Ⅴ(25.33%)>Ⅱ(6.69%)>Ⅵ(1.76%)>Ⅰ(0.24%), Ⅲ、Ⅳ和Ⅱ占据了总面积的91.31%;从区域分布看(图 2g), 除积温段Ⅵ外, 其余5个积温段, 按顺序近似呈环状分布, 积温值由外向内递增; 从动态度角度分析, 从1960年代到2010年以后, 祁连山区栅格尺度上负积温动态度为-6.7%~-2.1%, 平均为-3.3%。通过arcgis最优化分类(图 3a)可以发现, 负积温动态度自南向北, 基本呈带状分布, 动态度绝对值呈递减趋势。
3.3 负积温变化特征分析 3.3.1 时长变化通过线性回归分析, 分别用斜率的10倍表示初日、终日和持续天数的时间序列变化趋势, 结果表明(表 3), 所有站点均表现出初日推迟、终日提前以及持续天数缩短趋势。其中, 初日、终日、持续天数分别有10, 19和28个站点通过了P < 0.01的极显著性检验; 分别有20, 27和29个站点通过了P < 0.05的显著性检验; 分别有21, 31和32个站点通过了P < 0.1的显著性检验。从19602015年, 平均每10年初日推迟0.1~3.1天, 平均推迟1.3天; 终日提前0.4~4.9天, 平均提前2.4天; 持续时间缩短0.6~7.9天, 平均缩短3.7天。
| 表 3 负积温时长变化趋势统计检验 Table 3 Statistical tests of the change tendency of the initial date, termination date and sustainable days |
通过对19602015年各年代负积温变化数据统计分析(表 4和表 5), 研究区负积温主要变化特征如下:
| 表 4 研究区各积温段面积及所占比重 Table 4 Area and its proportion of different accumulated temperature segment in Qilian Mountains |
| 表 5 研究区各积温段面积变化及动态度 Table 5 Area change and dynamic index of different accumulated temperature segment in Qilian Mountains |
(1) 积温段Ⅰ和Ⅱ面积减少趋势明显, 但近期呈增加趋势。从1960年代到2000年代期间, 研究区积温段Ⅰ和Ⅱ面积持续减少, 是祁连山区负积温变化的显著特征, 也是全球气候变暖的必然结果。积温段Ⅰ和Ⅱ面积分别从2683 km2和35588 km2减少到8 km2和3046 km2, 分别减少了2675 km2和32542 km2, 平均动态度分别为-33.24%和-30.48%。在面积持续减少的同时, 积温段Ⅰ和Ⅱ面积比重也持续下降, 分别从1.41%和18.76%下降到0.004%和1.61%。但从2000年代到2010年以后, 积温段Ⅰ和Ⅱ面积持续减少趋势停滞, 反而呈增加趋势, 面积分别增加了26 km2、1233 km2, 表明从2000年代到2010年以后变暖趋势处于相对停滞阶段。
(2) 积温段Ⅲ和Ⅳ面积分别波动减少和增加。积温段Ⅲ面积呈减少-增加-减少-减少-增加趋势, 整体呈减少趋势。从1960年代的65952 km2减少到2010年以后的51116 km2, 面积比重从34.76%降低到26.94%, 平均动态度为-4.5%, 减少幅度不大。积温段Ⅳ面积呈减少-增加-增加-增加-减少趋势, 整体呈增加趋势。从1960年代的58318 km2增加到2010年以后的11485 km2, 面积比例从30.74%增加到36.79%, 平均动态度为3.94%, 增加幅度较小。
(3) 积温段Ⅴ和Ⅵ面积显著增加, 近期呈减少趋势。从1960年代到2000年代期间, 积温段Ⅴ和Ⅵ面积持续显著增加, 分别从26550 km2和652 km2增加到61818 km2和10048 km2, 分别增加了35269 km2和9396 km2, 平均动态度分别为44.28%和480.65%, 积温段Ⅵ增加幅度最大。积温段Ⅴ和Ⅵ面积比重也分别从13.99%和0.34%迅速上升到32.58%和5.30%。但从2000年代到2010年以后, 积温段Ⅴ和Ⅵ面积呈减少趋势, 在一定程度上反映了2000年代到2010年以后变暖趋势处于相对停滞阶段。
3.4 负积温转移特征分析 3.4.1 主要转移类型通过分析研究区1960年代至2010年以后各积温段负积温变化重要性指数(表 6), 结果表明:积温段保持不变的面积仅占32.48%, 主要分布在祁连山区东南角(图 3b)。负积温发生转移的类型中, Ⅲ~Ⅳ(38.10%)、Ⅳ~Ⅴ(29.12%)和Ⅱ~Ⅲ(26.51%)三类负积温变化重要指数Ci值之和高达93.73%, 表明这三类转移是祁连山区负积温转移的主要类型。
| 表 6 1960年代至2010年以后研究区各积温段变化的主要类型 Table 6 The main types of the change of accumulated temperature segment in Qilian Mountains from 1960s to after 2010 |
通过对比分析研究区1960年代至1970年代和1960年代至2010年以后各积温段负积温转移矩阵(表 7), 研究区负积温转移方向呈现以下特点: 1960年代至2010年以后, 负积温单向转移, 即从积温值较高的积温段向较低的积温段转移; 相邻年代间, 负积温双向转移, 但从积温值较高的积温段向较低的积温段转移占绝对优势, 体现了气候波动变暖趋势。
| 表 7 1960年代至1970年代和1960年代至2010年以后研究区各积温段负积温转移矩阵 Table 7 Analysis of transfer matrix of accumulated negative temperature from 1960s to 1970s and from 1960s to after 2010 |
采用“多元回归+残差插值”方法获取祁连山区负积温空间栅格化数据, 通过交叉验证, OK插值方法精度最优。在此基础上具体分析了祁连山区负积温的时空分布及变化特征, 主要结论如下:
(1) 祁连山区多年平均(1960-2015年)负积温分布在607~3507 ℃之间, 平均值为1851 ℃, 区域分布差异性较大; 从面积角度分析, 积温段Ⅲ、Ⅳ和Ⅱ占据了总面积的91.31%;从区域分布来看, 除积温段Ⅵ外, 其余5个积温段, 按顺序近似呈环状分布, 积温值由外向内递增; 从动态度角度分析, 从1960年代到2010年以后, 祁连山区栅格尺度上负积温动态度为-6.7%~ -2.1%, 平均为-3.3%, 负积温动态度自南向北, 基本呈带状递减。
(2) 线性回归分析表明, 祁连山区所有站点均表现出负积温初日推迟、终日提前、持续天数缩短趋势, 每10年初日平均推迟1.3天, 终日平均提前2.4天, 持续时间平均缩短3.7天。绝大部分站点通过了显著性检验。
(3) 在负积温面积变化方面, 积温段Ⅰ和Ⅱ面积减少是祁连山区负积温变化的显著特征, 也是全球气候变暖的必然结果。但从2000年代到2010年以后, 积温段Ⅰ和Ⅱ面积持续减少趋势停滞, 反而呈增加趋势, 表明2000年代到2010年以后变暖趋势处于相对停滞阶段; 积温段Ⅲ和Ⅳ面积分别呈波动减少和增加趋势, 增减幅度较小; 从1960年代到2000年代期间, 积温段Ⅴ和Ⅵ面积显著增加, 但从2000年代到2010年以后, 积温段Ⅴ和Ⅵ面积呈减少趋势, 进一步反映了变暖趋势的相对停滞。
(4) 在负积温转移方面, Ⅲ~Ⅳ(38.10%)、Ⅳ~Ⅴ(29.12%)和Ⅱ~Ⅲ(26.51%)三类负积温变化重要指数Ci值之和高达93.73%, 表明这三类转移是祁连山区负积温转移的主要类型; 从1960年代到2010年以后, 负积温单向转移, 即从积温值较高的积温段向较低的积温段转移; 相邻年代间, 负积温双向转移, 但从积温值较高的积温段向较低的积温段转移仍占绝对优势, 体现了气候波动变暖趋势。
Chen Y N, Deng H J, Li B F, et al. 2014. Abrupt change of temperature and precipitation extremes in the arid region of Northwest China[J]. Quaternary International, 336: 35–43.
DOI:10.1016/j.quaint.2013.12.057 |
|
Hansen J, Ruedy R, Glaseoe J, et al. 1999. GISS analysis of surface temperature change[J]. J Geophys Res, 104(D24): 30997–31022.
DOI:10.1029/1999JD900835 |
|
Ji F, Wu Z H, Huang J P, et al. 2014. Evolution of land surface air temperature trend[J]. Nature Climate Change, 4(6): 462–466.
DOI:10.1038/nclimate2223 |
|
曹斌, 张廷军, 彭小清, 等. 2015. 黑河流域年冻融指数及其时空变化特征分析[J]. 地球科学进展, 30(3): 357–366.
DOI:10.11867/j.issn.1001-8166.2015.03.0357 Cao Bin, Zhang Tingjun, Peng Xiaoqing, et al. 2015. Spatial variability of freezing-thawing index over the Heihe River Basin[J]. Adv Earth Sci, 30(3): 357–366.
DOI:10.11867/j.issn.1001-8166.2015.03.0357 |
|
陈建文, 刘耀武, 徐小红, 等. 2003. 陕北、渭北冬季负积温变化特征及趋势预测[J]. 中国农业气象, 24(2): 8–11.
Chen Jianwen, Liu Yaowu, Xu Xiaohong, et al. 2003. Variation and trend prediction of winter negative accumulated temperature in Shanbei and Weibei Regions[J]. Chinese J Agrometeor, 24(2): 8–11.
|
|
顾卫, 史培军, 刘杨, 等. 2002. 渤海和黄海北部地区负积温资源的时空分布特征[J]. 自然资源学报, 17(2): 168–173.
DOI:10.11849/zrzyxb.2002.02.007 Gu Wei, Shi Peijun, Liu Yang, et al. 2002. The characteristics of temporal and spatial distribution of negative accumulated temperature in Bohai Sea and north Yellow Sea[J]. J Natural Res, 17(2): 168–173.
DOI:10.11849/zrzyxb.2002.02.007 |
|
李庆祥, 董文杰, 李伟, 等. 2010. 近百年中国气温变化中的不确定性估计[J]. 科学通报, 55(16): 1544–1554.
DOI:10.1007/s11434-010-3209-1 Li Qingxiang, Dong Wenjie, Li Wei, et al. 2010. Assessment of the uncertainties in temperature change in China during the last century[J]. Chinese Sci Bull, 55(16): 1544–1554.
DOI:10.1007/s11434-010-3209-1 |
|
刘德祥, 董安祥, 邓振镛. 2005. 中国西北地区气候变暖对农业的影响[J]. 自然资源学报, 20(1): 119–125.
DOI:10.11849/zrzyxb.2005.01.017 Liu Dexiang, Dong Anxiang, Deng Zhenyong. 2005. Impact of climate warming on agriculture in Northwest China[J]. J Natural Res, 20(1): 119–125.
DOI:10.11849/zrzyxb.2005.01.017 |
|
马德栗, 陈正洪. 2010. 荆州主要界限温度初终日、持续天数和积温的变化[J]. 长江流域资源与环境, 19(Z2): 72–78.
Ma Deli, Chen Zhenghong. 2010. On the change of the main boundary temperature(≥ 10℃ & ≥ 20℃) in Jingzhou city[J]. Resources and Environment in the Yantze Basin, 19(Z2): 72–78.
|
|
牛丽, 叶柏生, 李静, 等. 2011. 中国西北地区典型流域冻土退化对水文过程的影响[J]. 中国科学, 41(1): 85–92.
DOI:10.1007/s11430-010-4073-1 Niu Li, Ye Baisheng, Li Jing, et al. 2011. Effect of permafrost degradation on hydrological processes in typical basins with varying permafrost coverage in Western China[J]. Science China:Earth Sciences, 41(1): 85–92.
DOI:10.1007/s11430-010-4073-1 |
|
钱锦霞, 李娜, 韩普. 2014. 冬季气候变暖对山西省冬小麦可种植区的影响[J]. 地理学报, 69(5): 672–680.
DOI:10.11821/dlxb201405010 Qian Jinxia, Li Na, Han Pu. 2014. Influence of climate warming in winter on the winter wheat cultivable area in Shanxi Province[J]. Acta Geographica Sinica, 69(5): 672–680.
DOI:10.11821/dlxb201405010 |
|
任国玉, 初子莹, 周雅清, 等. 2005. 中国气温变化研究最新进展[J]. 气候与环境研究, 10(4): 701–716.
Ren Guoyu, Chu Ziying, Zhou Yaqing, et al. 2005. Recent progresses in studies of regional temperature changes in China[J]. Climatic Environ Res, 10(4): 701–716.
|
|
桑建人, 刘玉兰, 韩世涛, 等. 2007. 宁夏冬季负积温变化特征[J]. 气象科学, 27(2): 202–207.
Sang Jianren, Liu Yulan, Han Shitao, et al. 2007. Character of the climate change for the negative accumulated temperature in Ningxia[J]. Scientia Meteor Sinica, 27(2): 202–207.
|
|
孙兰东, 刘德祥. 2008. 西北地区热量资源对气候变化的响应特征[J]. 干旱气象, 26(1): 8–12.
Sun Landong, Liu Dexiang. 2008. Characteristics of heat response in response to climate change in Northwest China[J]. J Arid Meteor, 26(1): 8–12.
|
|
王兴, 张强, 郭铌, 等. 2010. 祁连山区冬半年积雪分布及变化的遥感研究[J]. 高原气象, 29(2): 366–372.
Wang Xing, Zhang Qiang, Guo Ni, et al. 2010. Remote sensing research of snow cover distribution and variation in Qilian Mountains in the winter half year of 1996-2002[J]. Plateau Meteor, 29(2): 366–372.
|
|
王智, 师庆东, 常顺利, 等. 2012. 新疆地区平均气温空间插值方法研究[J]. 高原气象, 31(1): 201–208.
Wang Zhi, Shi Qingdong, Chang Shunli, et al. 2012. Study on spatial interpolation method of mean air temperature in Xinjiang[J]. Plateau Meteor, 31(1): 201–208.
|
|
杨小利, 辛吉武. 2007. 甘肃省冬季负积温资源的变化特征及预测[J]. 资源科学, 29(4): 114–120.
Yang Xiaoli, Xin Jiwu. 2007. The change characteristics and trend prediction of negative accumulated temperature in Gansu Province[J]. Resour Sci, 29(4): 114–120.
|
|
尹宪志, 张强, 徐启运, 等. 2009. 近50年来祁连山区气候变化特征研究[J]. 高原气象, 28(1): 85–90.
Yin Xianzhi, Zhang Qiang, Xu Qiyun, et al. 2009. Characteristics of climate change in Qilian Mountains region in recent 50 years[J]. Plateau Meteor, 28(1): 85–90.
|
|
岳文泽, 徐建华, 徐丽华. 2005. 基于地统计方法的气候要素空间插值研究[J]. 高原气象, 24(6): 974–980.
Yue Wenze, Xu Jianhua, Xu Lihua. 2005. A study on spatial interpolation methods for climate variables based on geostatistics[J]. Plateau Meteor, 24(6): 974–980.
|
|
张世轩, 张璐, 孙树鹏, 等. 2011. 全球变暖情况下中国季节的变化[J]. 高原气象, 30(3): 659–667.
Zhang Shixuan, Zhang Lu, Sun Shupeng, et al. 2011. Changes of the seasons in mainland China under global warming[J]. Plateau Meteor, 30(3): 659–667.
|
|
赵传成, 王雁, 丁永建, 等. 2011. 西北地区近50年气温及降水的时空分布[J]. 高原气象, 30(2): 385–390.
Zhao Chuancheng, Wang Yan, Ding Yongjian, et al. 2011. Spatial-temporal variations of temperature and precipitation in northern China in recent 50 years[J]. Plateau Meteor, 30(2): 385–390.
|
|
郑冬晓, 杨晓光, 赵锦, 等. 2015. 气候变化背景下黄淮冬麦区冬季长寒型冻害时空变化特征[J]. 生态学报, 35(13): 4338–4346.
Zheng Dongxiao, Yang Xiaoguang, Zhao Jin, et al. 2015. Spatial and temporal patterns of freezing injury during winter in Huang-Huai Winter Wheat Area under climate change[J]. Acta Ecologica Sinica, 35(13): 4338–4346.
|
2. Key Laboratory of Inland Ecohydrology, Chinese Academy of Sciences, Lanzhou 730000, China;
3. University of Chinese Academy of Sciences, Beijing 100049, China
 2017, Vol. 36
