2. 中国科学院大学, 北京 100049
青藏高原(下称高原)作为全球海拔最高地区, 平均海拔在4 000 m以上, 著有“第三极”之称(Qiu, 2008), 其对气候变化非常敏感, 被认为是“全球气候变化的驱动器与放大器”(潘保田等, 1996; Cheng et al, 2007)。高原因其独特的气候条件和地貌单元孕育了大面积的冻土, 根据最新高原多年冻土分布范围研究显示, 多年冻土面积约1.06×10⁶ km2, 占区域总面积的40 %, 季节冻土约1.46×10⁶ km2, 占区域总面积的56 % (Zou et al, 2017)。近年来, 随着全球气候变暖加剧, 高原也表现出快速变暖趋势。多年冻土已发生退化、活动层厚度显著增加(吴通华, 2005; Cheng et al, 2007; 李韧等, 2012)。在多年冻土区和季节冻土区中, 土壤冻融循环对水文和陆地生态系统具有重要影响, 反过来, 水文和陆地生态系统的变化又对土壤水分和能量平衡产生作用, 从而影响气候(葛骏等, 2016)。由于地-气间能量和水分交换主要发生在近地表层, 因此研究近地表冻融状况非常重要(杨梅学等, 2006)。近地表土壤冻融状况是陆面过程中重要的参数, 它不仅影响土壤与大气水热交换(李述训等, 2002; Zhang et al, 2003), 同时对农业(Henry et al, 2013)、生态(Knox et al, 2001)、水文(Niu et al, 2006)以及土壤碳循环(Larsen et al, 2002; Geogan et al, 2004; Urakawa et al, 2014)产生直接或间接的影响(Wang et al, 2015)。
表征近地表土壤冻融状况参数主要有冻结起始时间、冻结结束时间、冻结持续时间以及冻结天数。传统上, 研究土壤冻融循环主要通过站点监测和数值模拟的手段(王澄海等, 2002; Sinha et al, 2008; 谢志鹏等, 2017)。如Wang et al(2015)利用气象站636个站点的0 cm地表温度资料, 对中国境内近地表土壤冻融时间变化研究发现, 中国东部和西部的冻融时间相差较大, 且东部主要受纬度的影响, 而在西部, 海拔起决定因素。Guo et al(2014)使用CLM4.0模式和高分辨率气象资料研究高原1981-2010年土壤冻融循环对气候变暖的响应, 发现冻结结束时间提前速率要快于冻结开始时间, 且指出近地表冻融状况并不能反映深层土壤情况。近年来, 随着遥感技术的快速发展, 使得监测区域或更大尺度范围的土壤冻融循环得以实现, 尤其是被动微波的应用(Zhang et al, 2005)。Jin et al(2009)开发了一套决策树算法, 利用SSM/I亮温资料研究了中国近地表土壤冻结状况, 精度高达91.7 %, 并生成一套共享产品。Li et al(2012)利用SSM/I亮温数据分析了高原近地表土壤冻融状况发现, 1988-2007年间, 高原近地表土壤冻结起始时间推后, 结束时间提前。
虽然目前对高原地区的土壤冻融循环研究较多, 但由于长时间序列的日数据资料获取较难, 多数研究利用短期的野外观测资料分析土壤日冻融循环(杨梅学等, 2006)。而对于长时间尺度的近地表土壤季节冻融循环研究较少, 且多数采用遥感和数值模拟手段(罗斯琼等, 2008; 张寅生等, 2015)。尽管遥感资料相对于短期野外观测具有较长时间序列, 但其空间分辨率和精度有待提高(张廷军等, 2009)。而由于数值模式自身存在一定的不确定性, 不同参数的选取会直接影响所输出的结果, 且模拟结果的空间分辨率较低, 对于局地小区域的模拟可能存在较大误差(王澄海等, 2002)。
近年来, 随着观测站点近地表长时间序列的日尺度气象数据公开共享, 研究者开始对近地表土壤冻融循环开始深入研究(Wang et al, 2015)。但针对高原地区长期近地表土壤冻融循环的研究较少。为此, 利用1980-2015年长时间序列的地面观测台站资料, 对高原近地表土壤冻融时间特征进行分析, 深入认识和了解近几十年高原近地表土壤冻融循环情况, 为气候变化提供事实依据, 同时也为遥感和数值模式的验证提供基础。
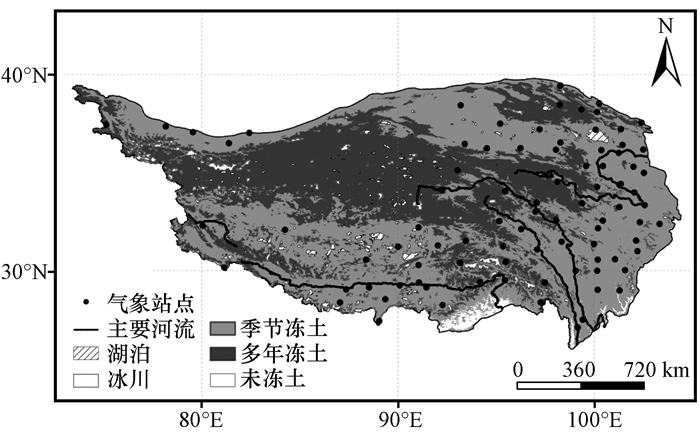
2 资料与方法 2.1 资料来源所用资料源自中国气象局气象数据中心(http://data.cma.cn)提供的高原地区1980年7月1日至2016年6月30日, 共87个气象台站的0 cm日最低地表温度及日平均气温数据。站点主要分布在季节冻土上, 只有少数站点在多年冻土区内(图 1)。为了保证数据的可靠性, 对所有站点的数据进行质量控制。对所有缺失数据进行逐个排查和插补, 发现大部分数据质量很好, 经质量控制后, 只有部分站点某一天数据出现缺失, 为此采用前后两天数据的线性回归进行插补。另外, 排查发现, 有部分站点2014年9月份数据缺失, 由于9月份是冻结开始的重要时间段之一, 为了保证结果的可靠性, 对这些缺失数据不进行处理, 统计分析过程中, 如果冻融时间出现在2014年9月, 则忽略该年份。为了将一个连续的冻结期包含在一年内, 且综合高原独特的地质气候特征, 将当年的7月1日至次年6月30日定义为一个完整的冻融循环年(Frauenfeld et al, 2007), 如1980年7月1日至1981年6月30日作为1980年的数据, 由此形成1980-2015年共36年的资料。为了对比分析气温与土壤冻融循环的关系, 将气温资料也做以上的处理。
|
图 1 研究区气象站点分布 Figure 1 Distribution of meteorological stations in the study area |
已有大量研究对如何定义土壤冻结状况有许多不同的方法(Li et al, 2012; Wang et al, 2015), 但研究土壤冻融循环方面, 大多数学者利用日最低温度与判断阈值的关系来定义冻结状况, 根据不同的目的, 所选用的阈值不同, 主要有低于-2.2 ℃(完全冻结)和低于0 ℃(可能冻结)的阈值, 欧洲环境署给定的阈值也是0 ℃(Anandhi et al, 2013)。也有学者将持续土壤温度低于0 ℃来判断土壤冻结状态(Sinha et al, 2008; Li et al, 2012)。本文冻结状况的定义主要借鉴Wang et al(2015)的方法, 其中冻结起始时间和结束时间分别为日最低地表温度小于或等于0 ℃的第一天和最后一天, 为了方便表示, 文中用天的序号表示, 即一年有365或366天, 1月1日为第1天, 1月2日为第2天, 以此类推; 冻结持续时间指冻结起始时间至结束时间的天数, 而冻结天数指日最低地表温度小于或等于0 ℃的天数, 冻结持续时间和冻结结束时间的纵坐标为天数, 由于冻结持续时间内存在部分日期的日最低地表温度大于0 ℃的情况, 所以冻结持续时间一般要大于冻结天数。之所以选用此方法主要有三方面考虑, 其一是大多数对土壤冻融循环的研究都利用最低土壤温度; 其二, 高原有大面积冻土分布, 全年地温较低, 而严格的判定标准很有可能会忽略一部分的土壤日冻融循环; 其三, 地表作为地-气能量交换界面, 对气候变化非常敏感, 尽管在第一次出现负温之后仍然会出现正温, 但是最先出现负温的这个时间对很多农业生态过程具有重要意义。
文中主要采用线性回归和相关分析法分析近地表土壤冻融状况趋势变化及其与气温、海拔和纬度相关关系, 并利用非参数Mann-Kendall检验对冻融时间变化进行突变分析。所有变化趋势均利用Pearson检验对其进行显著性检验, 检验标准有α=0.05和α=0.01两种, 当数据通过以上任意一种显著性检验, 则认为该变化趋势显著。
Mann-Kendall(M-K)检验是一种非参数检验方法, 由Mann et al(1945)于1945年最先提出, 用于检验气候变化趋势, 之后经Goossens et al(1987)的发展, 成为一种检测气候突变的方法。M-K检验不适用于有多个突变点的时间序列的检测, 该方法只能确定其中突变点最为显著的时间, 而其他突变点不能被检测出(吕少宁等, 2010)。文中时间变化序列只有一个突变点, 故用M-K检验可以较好的检测出突变信息。
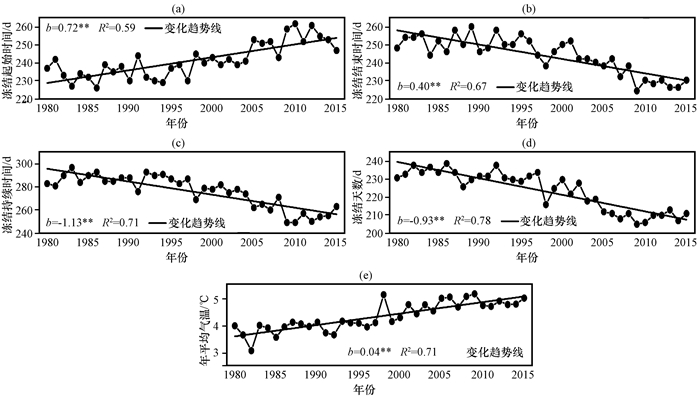
3 结果与讨论 3.1 近地表土壤冻融状况的时间变化特征图 2为高原1980-2015年间冻结起始时间、冻结结束时间、冻结持续时间、冻结天数变化及其与年平均气温变化序列。结果显示, 1980-2015年高原年平均温度呈显著增温趋势, 上升速率为0.04 ℃·a-1, 冻结起始时间以0.72 d·a-1的速度增加, 冻结结束时间呈显著下降趋势, 其变化速率为0.40 d·a-1, 在冻结起始时间和结束时间共同作用下, 冻结持续时间呈现显著下降趋势, 速率达到1.13 d·a-1, 冻结天数同样呈现出下降趋势, 变化速率为0.93 d·a-1。整个研究期间, 冻结开始时间推迟约26天, 冻结结束时间提前约14天, 冻结持续时间和冻结天数分别缩短37天和41天左右。过去36年间, 不同时段的冻结时间有明显的差异(图略)。20世纪80年代, 气温处于相对平稳状态, 因此冻融时间均没有明显变化。90年代以后, 气温开始缓慢上升, 冻结起始时间也随之呈显著上升趋势, 速率为1.05 d·a-1, 冻结结束时间以0.57 d·a-1速率下降, 冻结持续时间和冻结天数的下降速率分别为1.62 d·a-1和1.23 d·a-1。值得注意的是, 在1998年所有冻结时间均出现极端变化现象。冻结起始时间快速上升, 冻结结束时间、冻结持续时间和冻结天数呈现1980-1998年以来最小值, 这可能与1997年出现了一次非常强的厄尔尼诺事件有关, 使得次年高原地区出现气温异常增高, 从而造成冻结时间出现局部异常现象。自21世纪以来, 随着气温的稳步上升, 冻结时间变化呈现出历史最高阶段。
|
图 2 青藏高原近地表冻结起始时间变化(a)、冻结结束时间(b)、冻结持续时间(c)、冻结天数(d)及年平均气温(e)变化序列 冻结起始时间和冻结结束时间的纵坐标表示天的序号; 冻结持续时间和冻结天数的纵坐标为天数 Figure 2 he series of temporal variation of the first date (a), the last date (b), duration days (c), freeze days (d) and the annual mean temperature (e) of the near-surface soil freeze over the Qinghai-Tibetan Plateau.The Y-axis of the first date and the last date of soil freeze mean the numbers of the day; the Y-axis of the duration and freeze days means days |
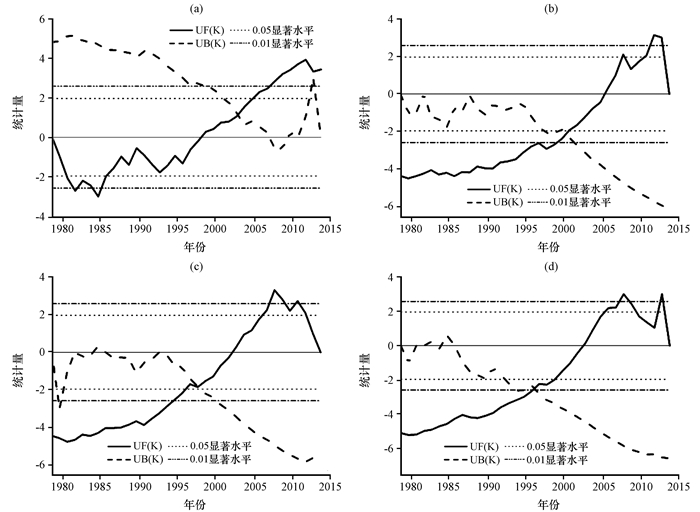
对高原近地表土壤冻融时间进行M-K检验(图 3), 结果显示, M-K检验与时间序列变化趋势表现一致, 但冻融时间变化均发生了突变现象。其中, 冻结开始时间和冻结结束时间突变点分别发生于2003年和2002年。研究发现, 2002年之前冻结开始时间主要发生在8月初, 2002年之后主要在9月初期; 冻结结束时间也有类似的规律, 即2002年之后结束时间要明显早于2002年之前。而冻结持续时间和冻结天数突变时间分别发生在1998年和1997年。发生突变的主要原因可能是1997年爆发了自20世纪以来最强的一次厄尔尼诺事件(许武成等, 2004), 使得次年气温异常升高, 降雨剧增, 土壤温度也随之升高。而随后10年左右, 高原乃至全球出现了气温“停滞”现象, 气温开始缓慢上升, 局部地区甚至呈下降趋势(Easterling et al, 2009; Yu et al, 2013; An et al, 2016)。但是, 许多研究者表明, 这种“停滞”现象在高原地区并不存在, 1998年之后的气温依然处于快速变暖阶段(Duan et al, 2015), 21世纪的气温仍处于历史高峰期, 冻土仍在快速退化(Kuang et al, 2016; Wu et al, 2015)。之所以出现四种冻融状态突变时间不一致, 可能与本文用最低温度定义冻结时间有关, 虽然1998年之后的冻结起始时间已经发生了变化, 但由于冻结起始时间对最低地温非常敏感度, 一旦出现小于0 ℃的情况就开始冻结, 而当极端事件之前出现过负温, 则这种极端事件很可能会被忽略, 但随着时间的积累, 气温缓慢上升, 使得这种突变在2002-2003年发生。而冻结持续时间在冻结起始时间和结束时间双重影响下, 其对极端气候变化的敏感度要高, 冻结结束时间则主要是负温天数的累积, 因此对极端时间也较敏感, 这可能导致冻结起始时间突变事件发生在2002-2003年, 而冻结持续时间和冻结天数则发生在1997-1998年。
|
图 3 青藏高原近地表土壤冻结起始时间(a)、结束时间(b)、持续时间(c)和冻结天数(d)的M-K检验结果 Figure 3 The M-K test results of the change of the first date (a), the last date (b), duration days (c) and freeze days (d) of the near-surface soil freeze |
已有许多学者采用不同手段监测冻融循环变化(表 1), 对比发现, 虽然研究时间序列和研究地区不尽相同, 但是都显示出共同的变化趋势, 即冻结起始时间推迟, 冻结结束时间提前, 冻结持续时间和冻结天数均缩短, 且高原地区的冻融状况变化幅度要大于全国水平, 这与Wang et al(2015)的研究结果相似。但Wang et al(2015)研究的是整个中国区域, 虽然高原地区也包含在内, 但其并没有对高原土壤冻融状况进行详细分析, 且在时间变化趋势上, 由于研究区分布面积较大, 地形复杂, 对所有站点进行年平均后会过滤掉部分信息, 使得整体变化较平缓, 并不能真实的反映出高原土壤冻融变化情况。为了进一步对比本研究与利用遥感和数值模式手段分析高原土壤冻融循环的差别, 分别计算了1981-2010年和1988-2007年各冻结状况的变化。结果显示, 本研究计算出的冻结起始时间比遥感技术和数值模式方法的结果分别多约5天和10天, 冻结结束时间比遥感技术少约7天, 而与数值模拟结果相似, 冻结天数比遥感技术结果少约13天, 冻结持续时间比数值模拟多了一倍。造成以上结果主要有三个因素, 一是不同研究所用数据和手段不同; 二是对于冻结状态的定义不尽相同; 三是遥感数据和数值模式自身存在一定的不确定性, 有高估或低估的可能性。
| 表 1 不同研究方法所计算的近地表土壤冻融状况变化 Table 1 The change of the near-surface soil freeze-thaw status with different methods |
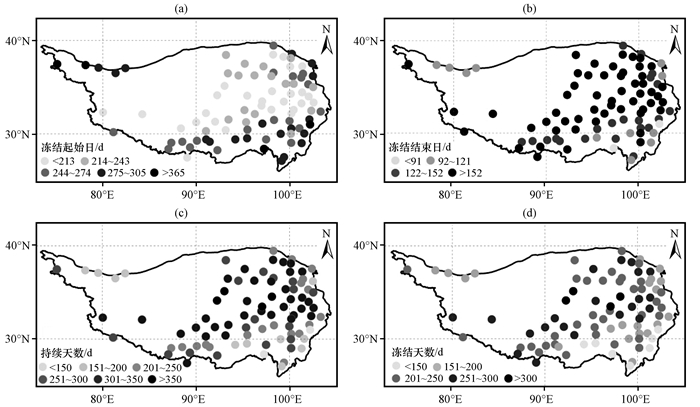
由高原地区87个站点近36年的平均冻融状况变化的空间分布(图 4)可知, 高原中东部地区冻结起始时间较早, 主要发生在7月, 冻结结束时间较晚, 多数在6月期间, 该区域大多数站点冻结持续时间在300天以上, 部分站点持续时间长达350天左右。而东南及西北小部分地区冻结起始时间较晚, 且冻结结束时间较早, 持续时间较短, 均不足200天。主要原因是该区域属于季节性冻土且海拔较低, 东南部还有少量的未冻土存在, 因此该地区地温相比其他地区要高。虽然冻结天数要小于冻结持续时间, 但仍然表现出与其相似的空间分布特征。
|
图 4 高原近地表土壤冻结起始时间(a)、结束时间(b)、持续时间(c)和冻结天数(d)的变化分布 Figure 4 The maps of changes of the first date (a), the last date (b), duration days (c) and freeze days (d) of the near-surface soil freeze over the Qinghai-Tibetan Plateau |
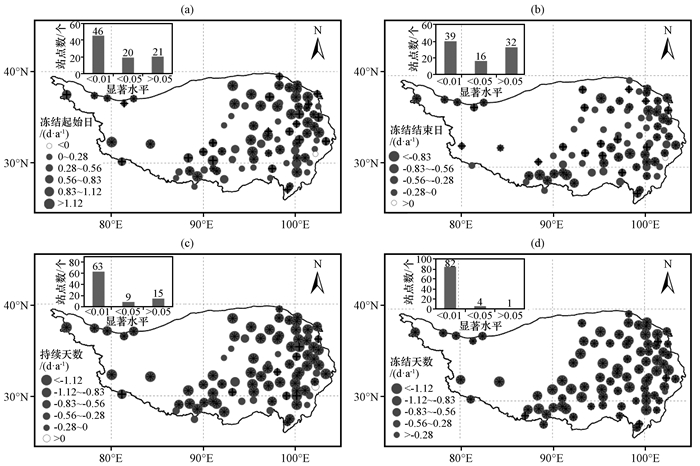
从高原观测站多年冻融状况变化速率的空间分布(图 5)可以看出, 近36年高原全区冻融状况变化表现一致。除个别站点以外, 几乎所有站点均显示为冻结起始时间推迟, 结束时间提前、持续时间和冻结天数缩短, 且多数站点变化趋势显著, 所占比例分别为76 %, 63 %, 83 %和99 %。局部地区变化速率略有不同, 东部地区变化最快, 西部适中, 变化较慢的站点零星分布在中部和南部地区, 但多数变化并不显著。值得注意的是, 有个别站点出现相反的变化趋势, 如位于高原东部边缘的小金观测站, 其冻结起始时间提前、冻结结束时间推迟, 变化趋势并不显著。可能的原因是, 小金县是2008年汶川地震重要受灾区之一, 受地震的影响, 震后气温将明显下降(牛晓宁等, 2012), 自2009年以来该地区年平均气温呈显著下降。
|
图 5 高原近地表土壤冻结起始时间(a)、结束时间(b)、持续时间(c)和冻结天数(d)的时间变化速率分布 “*”表示通过了α=0.01显著水平; “+”表示通过了α=0.05显著水平; 柱状图表示通过不同显著水平和未通过显著水平的站点数 Figure 5 The map of rate of change ofthe first date (a), the last date (b), duration days (c) and freeze days (d) of the near-surface soil freeze over the Qinghai-Tibetan Plateau.An asterisk indicates the station that past the significant level at α=0.01 and the crosss indicates the station that past the significant level at α=0.05; The bar chart indicates the number of stations that past the significant level or not |
气温是影响地-气水热交换的主要因素(李述训等, 2002)。为了揭示高原地区气温对土壤冻融状况的影响, 分别对观测站的冻结起始时间、冻结结束时间、冻结持续时间和冻结天数与年平均气温进行相关性分析(图 6)。结果发现, 所有冻融时间与年平均气温的相关性均大于0.9, 且达到99 %置信水平, 表明气温与土壤冻融状态有很好的相关性。受气温变暖趋势的影响, 高原近地表土壤温度也随之上升, 冻结起始时间推迟, 结束时间提前, 使得冻结持续时间明显缩短, 冻结天数也随之减少。气温每上升1 ℃, 冻结起始时间推迟约7.77天, 结束时间提前约5.14天, 持续时间和冻结天数分别缩短约12.91天和10.85天。而冻结持续时间的缩短造成冻土区活动层厚度逐渐增加, 多年冻土范围不断缩小, 使得沉积在多年冻土中的温室气体(如CO2和CH4等)被释放到大气中, 进一步加快气候变暖, 形成一个正反馈(Larsen et al, 2002; Grogan et al, 2004)。但气温并不能完全解释土壤冻融变化, 要想全面的揭示土壤冻融状况, 还需考虑其他诸多因素, 如积雪、土壤水分、植被或人为影响(Sinha et al, 2008)。前人研究指出, 土壤水分很可能是影响冻融循环的另一个主要因素(杨梅学等, 2000; 赵林等, 2000)。

|
图 6 青藏高原近地表土壤冻融状况与年平均气温的相关性分析 b表示线性斜率, r表示相关系数, **表示通过α=0.01显著水平 Figure 6 Relationships between the near-surface soil freeze-thaw status and annual mean air temperature over the Qinghai-Tibetan Plateau.The slope of the linear is b, the Pearson correlation coefficience is r and the double asterisk represents the linear slope and the correlation coefficience that past the significance level at α=0.01 |
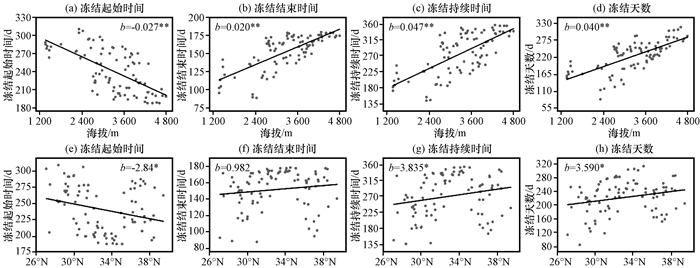
邱国庆等(1995)提出高原年平均气温在空间上表现出“三向地带性”, 与海拔和纬度有很好的相关性, 而与经度的关系最弱, 因此对冻结起始时间、结束时间、持续时间和冻结天数与海拔和纬度的相关性进行分析(图 7, 表 2)。研究表明, 高原近地表土壤冻融状况变化与海拔存在显著相关, 相关系数均在0.6以上, 与纬度的相关性较弱, 主要原因是高原近地表土壤冻融循环主要受气温的影响, 而高原上的气温主要由海拔决定, 高原属于世界海拔最高地区, 平均海拔约4 000 m(Qiu, 2008), 所以, 海拔对土壤冻融循环的影响较大, 这与许多研究结果表现一致(Li et al, 2012; Wang et al, 2015; Peng et al, 2016)。进一步分析海拔与冻融状况变化的关系发现, 海拔每上升1 000 m, 冻结起始时间提前约26天, 结束时间推迟约20天, 持续时间增加约47天以及冻结天数增加约40天。而根据气温递减率可知, 一般海拔上升100 m, 气温降低约0.6 ℃, 这样计算发现, 当气温降低1 ℃, 冻结天数提前约4.33天, 结束时间推迟约3.33天, 持续时间和冻结天数分别增加7.83天和6.67天。而这种变化显然小于前文气温与冻融时间关系所得结果, 这也证实了气温对土壤冻融状况有滞后作用(胡国杰等, 2014)。
|
图 7 青藏高原近地表土壤冻融状况与海拔和纬度的相关性分析 b表示线性斜率, *表示通过α=0.05显著水平, **表示通过α=0.01显著水平 Figure 7 Relationships between the near-surface soil freeze-thaw status and altitude and latitude over the Qinghai-Tibetan Plateau.The slope of the linear is b, an asterisk and the double asterisk represents the linear slope that past the significance level at α=0.05 and α=0.01 respectively |
| 表 2 青藏高原近地表冻融状况与海拔、纬度的相关系数 Table 2 The correlation coefficience between the near-surface soil freeze-thaw status and altitude, latitude over the Qinghai-Tibetan Plateau |
利用1980-2015年高原87个气象观测站点的0 cm地表温度和气温数据, 分析了高原近地表土壤冻融状况的时空变化特征, 并探讨了冻融状况与气温、海拔和纬度的相关性。得出以下几个结论:
(1) 近36年高原近地表土壤冻融时间发生显著变化。1980-2015年间, 冻结起始时间呈上升趋势, 变化速率为0.72 d·a-1, 结束时间以0.40 d·a-1速率下降, 持续时间和冻结天数均呈现下降趋势, 变化速率分别为1.13 d·a-1和0.93 d·a-1。20世纪90年代以后, 冻融状况开始波动上升, 尤其是冻结起始时间和结束时间, 其变化速率分别达到1.05 d·a-1和0.57 d·a-1。在此期间, 冻融时间变化均发生了突变现象, 冻结开始时间、冻结结束时间、冻结持续是时间和冻结天数突变时间分别发生在2003, 2002, 1998和1997年。
(2) 空间上, 整个高原的冻融状况表现一致, 局部地区表现略有差异。高原中东部地区冻结起始时间较早, 结束时间较晚, 持续时间和冻结时间较长; 而在东南部及西北地区表现相反。变化趋势上, 几乎所有站点均表现为冻结起始时间推迟, 结束时间提前、持续时间和冻结天数缩短, 且大多数站点变化趋势显著, 个别站点出现相反变化, 但均未通过显著性检验。总体而言, 高原东部地区冻融时间变化最快, 西部适中, 变化较慢的站点零星分布在中部和南部地区。
(3) 冻融时间与年平均气温的相关性非常显著, 相关系数均大于0.9。气温每上升1 ℃, 冻结起始时间推迟约7.77天, 结束时间提前约5.14天, 持续时间和冻结天数分别缩短约12.91天和10.85天。但气温对近地表土壤冻融循环存在滞后作用。
(4) 近地表土壤冻融时间变化与海拔存在很好的相关关系, 随着海拔的上升, 冻结起始时间显著提前, 结束时间推迟, 持续时间和冻结天数则表现出增多趋势; 而与纬度的相关性较弱。
An W L, Hou S G, Zhang W B, et al. 2016. Possible recent warming hiatus on the northwestern Tibetan Plateau derived from ice core records[J]. Scientific Reports, 6: 32813.
DOI:10.1038/srep32813 |
|
Anandhi A, Perumal S, Gowda P H, et al. 2013. Long-term spatial and temporal trends in frost indices in Kansas, USA[J]. Climatic Change, 120(1): 169–181.
|
|
Cheng G D, Wu T H. 2007. Responses of permafrost to climate change and their environmental significance, Qinghai-Tibet Plateau[J]. Journal of Geophysical Research Earth Surface, 112: F02S03.
DOI:10.1029/2006JF000631 |
|
Duan A M, Xiao Z X. 2015. Does the climate warming hiatus exist over the Tibetan Plateau?[J]. Scientific Reports, 5: 13711.
DOI:10.1038/srep13711 |
|
Easterling D R, Wehner M F. 2009. Is the climate warming or cooling?[J]. Geophys Res Lett, 36(8): 262–275.
|
|
Frauenfeld O W, Zhang T, Mccreight J L, et al. 2007. Northern Hemisphere freezing/thawing index variations over the twentieth century[J]. Int J Climatol, 27(1): 47–63.
DOI:10.1002/(ISSN)1097-0088 |
|
Goossens C, Berger A. 1987. How to recognize an abrupt climatic change?[J]. Nato Asi Series, 216: 31–45.
|
|
Grogan P, Michelsen A, Ambus P, et al. 2004. Freeze-thaw regime effects on carbon and nitrogen dynamics in sub-arctic health tundra mesocosms[J]. Soil Biology & Biochemistry, 36(4): 641–654.
|
|
Guo D L, Wang H. 2014. Simulated change in the near-surface soil freeze/thaw cycle on the Tibetan Plateau from 1981 to 2010[J]. Chinese Sci Bull, 59(20): 2439–2448.
DOI:10.1007/s11434-014-0347-x |
|
Henry H A L, 2013. Soil freezing dynamics in a changing climate: Implications for agriculture[M]//plant and microbe adaptations to cold in a changing world, 17-27.
|
|
Jin R, Li X, Tao C. 2009. A decision tree algorithm for surface soil freeze/thaw classification over China using SSM/I brightness temperature[J]. Remote Sensing of Environment, 113(12): 2651–2660.
DOI:10.1016/j.rse.2009.08.003 |
|
Knox J C. 2001. Agricultural influence on landscape sensitivity in the Upper Mississippi River Valley[J]. Catena, 42(2-4): 193–224.
DOI:10.1016/S0341-8162(00)00138-7 |
|
Kuang X X, Jiao J J. 2016. Review on climate change on the Tibetan Plateau during the last half century[J]. J Geophys Res Atmos, 121(8): 1–29.
|
|
Larsen K S, Jonasson S, Michelsen A. 2002. Repeated freeze-thaw cycles and their effects on biological processes in two arctic ecosystem types[J]. Applied Soil Ecology, 21(3): 187–195.
DOI:10.1016/S0929-1393(02)00093-8 |
|
Li X, Jin R, Pan X, et al. 2012. Changes in the near-surface soil freeze-thaw cycle on the Qinghai-Tibetan Plateau[J]. International Journal of Applied Earth Observation & Geoinformation, 17(1): 33–42.
|
|
Mann H B. 1945. Nonparametric test against trend[J]. Econometrica, 13(3): 245–259.
DOI:10.2307/1907187 |
|
Niu G Y, Yang Z L. 2006. Effects of frozen soil on snowmelt runoff and soil water storage at a continental scale[J]. Journal of Hydrometeorology, 7(5): 937–952.
DOI:10.1175/JHM538.1 |
|
Peng X Q, Frauenfeld O W, Cao B, et al. 2016. Response of changes in seasonal soil freeze/thaw state to climate change from 1950 to 2010 across China[J]. Journal of Geophysical Research Earth Surface, 121: 1984–2000.
DOI:10.1002/2016JF003876 |
|
Qiu J. 2008. China:The third pole[J]. Nature, 454(24): 393–369.
|
|
Sinha T, Cherkauer K A. 2008. Time series analysis of soil freeze and thaw processes in Indiana[J]. Journal of Hydrometeorology, 9(5): 936–950.
DOI:10.1175/2008JHM934.1 |
|
Urakawa R, Shibata H, Kuroiwa M, et al. 2014. Effects of freeze-thaw cycles resulting from winter climate change on soil nitrogen cycling in ten temperate forest ecosystems throughout the Japanese archipelago[J]. Soil Biology & Biochemistry, 74: 82–94.
|
|
Wang K, Zhang T, Zhong X H, et al. 2015. Changes in the timing and duration of the near-surface soil freeze/thaw status from 1956 to 2006 across China[J]. The Cryosphere, 9(3): 1321–1331.
DOI:10.5194/tc-9-1321-2015 |
|
Wu Q B, Hou Y D, Yun H B, et al. 2015. Changes in active-layer thickness and near-surface permafrost between 2002 and 2012 in alpine ecosystems, Qinghai-Xizang (Tibet) Plateau, China[J]. Global & Planetary Change, 124: 149–155.
|
|
Yu K, Xie S P. 2013. Recent global-warming hiatus tied to equatorial Pacific surface cooling[J]. Nature, 501(7467): 403–407.
DOI:10.1038/nature12534 |
|
Zhang T J, Armstrong R L, Smith J G, et al. 2003. Investigation of the near-surface soil freeze-thaw cycle in the contiguous United States:Algorithm development and validation[J]. J Geophys Res:Atmos, 108(D22).
DOI:10.1029/2003JD003530 |
|
Zhang T J. 2005. Historical overview of permafrost studies in China[J]. Physical Geography, 26(4): 279–298.
DOI:10.2747/0272-3646.26.4.279 |
|
Zou D, Zhao L, Yu S, et al. 2017. A new map of permafrost distribution on the Tibetan Plateau[J]. The Cryosphere, 11: 2527–2542.
DOI:10.5194/tc-11-2527-2017 |
|
葛骏, 余晔, 李振朝, 等. 2016. 青藏高原多年冻土区土壤冻融过程对地表能量通量的影响研究[J]. 高原气象, 35(3): 608–620.
Ge J, Yu Y, Li Z C, et al. 2016. Impacts of freeze/thaw processes on land surface energy fluxes in the permafrost region of Qinghai-Xizang Plateau[J]. Plateau Meteor, 35(3): 608–620.
DOI:10.7522/j.issn.1000-0534.2016.00032 |
|
胡国杰, 赵林, 李韧, 等. 2014. 青藏高原多年冻土区土壤冻融期间水热运移特征分析[J]. 土壤, 46(2): 355–360.
Hu G J, Zhao L, Li R, et al. 2014. Characteristics of hydro-thermal transfer during freezing and thawing period in permafrost regions[J]. Soils, 46(2): 355–360.
|
|
李韧, 赵林, 丁永建, 等. 2012. 青藏公路沿线多年冻土区活动层动态变化及区域差异特征[J]. 科学通报, 57(30): 2864–2871.
Li R, Zhao L, Ding Y J, et al. 2012. Temporal and spatial variations of the active layer along the Qinghai-Tibet Highway in a permafrost region[J]. Chinese Science Bulletin, 57(30): 2864–2871.
|
|
李述训, 南卓铜, 赵林. 2002. 冻融作用对地气系统能量交换的影响分析[J]. 冰川冻土, 24(5): 506–511.
Li S X, Nan Z T, Zhao L. 2002. Impact of soil freezing and thawing process on thermal exchange between atmosphere and ground surface[J]. Journal of Glaciolgy & Geocryology, 24(5): 506–511.
|
|
罗斯琼, 吕世华, 张宇, 等. 2008. CoLM模式对青藏高原中部BJ站陆面过程的数值模拟[J]. 高原气象, 27(2): 259–271.
Luo S Q, Lü S H, Zhang Y, et al. 2008. Simulation analysis on land surface process of BJ site of central Tibetan Plateau Using CoLM[J]. Plateau Meteor, 27(2): 259–271.
|
|
吕少宁, 李栋梁, 文军, 等. 2010. 全球变暖背景下青藏高原气温周期变化与突变分析[J]. 高原气象, 29(6): 1378–1385.
Lü S N, Li D L, Wen J, et al. 2010. Analysis on periodic variations and abrupt change of air temperature over Qinghai-Xizang Plateau under global warming[J]. Plateau Meteor, 29(6): 1378–1385.
|
|
牛晓宁, 张济世. 2012. 全球地震活动与气温的相关性分析及统计特征[J]. 兰州交通大学学报, 31(3): 108–111.
Niu X T, Zhang J S. 2012. Correlation analysis and statistical characteristics of global earthquake and temperature[J]. Journal of Lanzhou Jiaotong University, 31(3): 108–111.
|
|
潘保田, 李吉均. 1996. 青藏高原:全球气候变化的驱动机与放大器——Ⅲ.青藏高原隆起对气候变化的影响[J]. 兰州大学学报(自科版), 32(1): 108–115.
Pan B T, Li J J. 1996. Qinghai-Tibetan Plateau:A driver and amplifier of the global climatic change[J]. Journal of Lanzhou University(Natural Sciences), 32(1): 108–115.
|
|
邱国庆, 程国栋. 1995. 中国的多年冻土——过去与现在[J]. 第四纪研究, 15(1): 13–22.
Qiu G Q, Cheng G D. 1995. Permafrost in China:Past and present[J]. Quaternary Sciences, 15(1): 13–22.
|
|
王澄海, 董文杰, 韦志刚. 2002. 陆面模式中土壤冻融过程参数化研究进展[J]. 地球科学进展, 17(1): 44–52.
Wang C H, Dong W J, Wei Z G. 2002. The development of study on the soil freezing-thaw process in land surface model[J]. Advance in Earth Sciences, 17(1): 44–52.
|
|
吴通华, 2005. 青藏高原多年冻土对全球气候变化的响应研究[D]. 兰州: 中国科学院寒区旱区环境与工程研究所.
Wu T H, 2005. A study on response of permafrost to global climate change in Qinghai-Tibetan Plateau[D]. Ph. D. thesis. Cold and Arid Regions Environmental and Engineering Research Institute, Chinese Academy of Sciences, Lanzhou, in China.
|
|
谢志鹏, 胡泽勇, 刘火霖, 等. 2017. 陆面模式CLM4.5对青藏高原高寒草甸地表能量交换模拟性能的评估[J]. 高原气象, 36(1): 1–12.
Xie Z P, Hu Z Y, Liu H L, et al. 2017. Evaluation of the surface energy exchange simulations of land surface model CLM4.5 in alpine meadow over the Qinghai-Xizang Plateau[J]. Plateau Meteor, 36(1): 1–12.
DOI:10.7522/j.issn.1000-0534.2016.00012 |
|
许武成, 王文, 马劲松, 等. 2004. 1997——1998年厄尔尼诺事件的特征、成因及对气候的影响[J]. 海洋学研究, 22(3): 1–8.
Xu W C, Wang W, Ma J S, et al. 2004. The characteristics, causes of formation and climatic impact of the 19971998 El Ni(n)o event[J]. Donghai Marine Science, 22(3): 1–8.
|
|
杨梅学, 姚檀栋, HiroseN, 等. 2006. 青藏高原表层土壤的日冻融循环[J]. 科学通报, 51(16): 1974–1976.
Yang M X, Yao T D, Hirose N, et al. 2006. Diurnal freeze/thaw cycles of the ground surface on the Tibetan Plateau[J]. Chinese Sci Bull, 51(16): 1974–1976.
DOI:10.3321/j.issn:0023-074X.2006.16.020 |
|
杨梅学, 姚檀栋, 勾晓华. 2000. 青藏公路沿线土壤的冻融过程及水热分布特征[J]. 自然科学进展, 10(5): 443–450.
Yang M X, Yao T D, Gou X H. 2000. Soil melting freezing processes and water heat distribution feature along the Qinghai-Xizang Highway[J]. Progress in Natural Science, 10(5): 443–450.
|
|
张廷军, 晋锐, 高峰. 2009. 冻土遥感研究进展——可见光、红外及主动微波卫星遥感方法[J]. 地球科学进展, 24(9): 963–972.
Zhang T J, Jin R, Gao F. 2009. Overview of the satellite remote sensing of frozen ground:visible-thermal Infrared and radar sensor[J]. Advances in Earth Science, 24(9): 963–972.
|
|
张寅生, 马颖钊, 张艳林, 等. 2015. 青藏高原坡面尺度冻融循环与水热条件空间分布[J]. 科学通报, 60(7): 664–673.
Zhang Y S, Ma Y Z, Zhang Y L, et al. 2015. Hillslope patterns in thaw-freeze cycle and hydrothermal regimes on Tibetan Plateau[J]. Chinese Science Bulletin, 60(7): 664–673.
|
|
赵林, 程国栋, 李述训, 等. 2000. 青藏高原五道梁附近多年冻土活动层冻结和融化过程[J]. 科学通报, 45(11): 1205–1211.
Zhao L, Cheng G D, Li S X, et al. 2000. Thawing and freezing processes of active layer in Wudaoliang region of Tibetan Plateau[J]. Chinese Sci Bull, 45(11): 1205–1211.
DOI:10.3321/j.issn:0023-074X.2000.11.018 |
2. University of Chinese Academy of Science, Beijing 100049, China
 2018, Vol. 37
