对全球范围气候变化的关注, 已然成为各国政府和科学界乃至普通民众广泛关注的热点, 并且着重分析了气温和降水的变化规律, 从过去和现在的变化中预测出未来的气候变化趋势。地球表层的水分状况的变化, 即区域的干湿状况问题正越来越被关注(施雅风, 2003; 李育等, 2015)。青藏高原(下称高原)作为世界上最高大的高原, 对中国(莫申国等, 2004)、亚洲(吴国雄等, 2004)乃至全球的气候变化(郑度等, 2002)都有着深刻的影响, 因此倍受国内外气象学者们的关注。高原作为周边地区的水汽集中地也被称为湿池(陶诗言等, 2000; 王霄等, 2009; 谢启玉等, 2015), 因其特殊的地形和所处地理位置, 成为中国大部分地区灾害性天气和气候的水汽输送关键区(周玉淑等, 2005; 施晓晖等, 2009; 丁一汇等, 2003)。因此, 高原水资源的变化受到广泛的关注。达瓦次仁(2010)对高原的水资源变化做了较详细的描述, 发现近几十年来, 西藏的诸多湖泊表现出明显的萎缩现象, 近20年来, 黄河源区水域面积减少9.03%, 近20条河流干涸; 湖泊面积减少5.28%, 约有345个湖泊干涸。受诸多观测条件的限制, 自20世纪80年代以来, 对于高原上空的水汽资源的研究一直受到人们的关注。研究表明高原在夏季是水汽的汇(Feng et al, 2012; 解承莹等, 2014), 水汽主要由中纬度西风带和印度夏季风输送而来(杨逸畴等, 1987; Lin et al, 2015), 并以两阶梯接力的方式被输送到高原上(徐祥德等, 2014), 并且由印度西南季风输送的水汽比西风带输送的更充沛(林厚博等, 2016)。另外, Xu et al(2008)进一步分析得到高原主要的水汽来自阿拉伯海, 而孟加拉湾次之。
作为“亚洲水塔”(Liu et al, 2000), 高原的降水和水汽输送将影响到整个水循环系统。其降水主要集中在南部和东南部, 而西北部偏干(Zhou et al, 2012; You et al, 2015a)。可降水量也表现出和降水量相似的空间分布形态(梁宏, 2006)。作为反映干湿状况的另一个物理量, 相对湿度也对水资源的变化有一定的指示作用(周顺武等, 2011; 刘玉英等, 2016)。Wu et al(2007)对高原相对湿度进行探索, 发现在1971—2000年, 相对湿度在高原的东南和西南部呈现出增加的趋势。You et al (2015a)发现, 1961—2013年高原上相对湿度在夏季达到最大值, 而其冬季最小。另外, 区域平均的年均相对湿度呈现出减少的趋势, 并且此趋势在夏季达到最大。早在2010年, Hardwick et al(2010)和Simmons et al(2010)就发现全球大部分地区存在温度升高但相对湿度却减少的变化事实, 但对于这种变化的响应解释却相对较少。本文通过对高原地表相对湿度的变化分析, 探究高原地表空气中相对湿度是否也存在这样的变化。并通过分析水汽的输送和风场的分布变化来解释和描述相对湿度的这种变化特征。
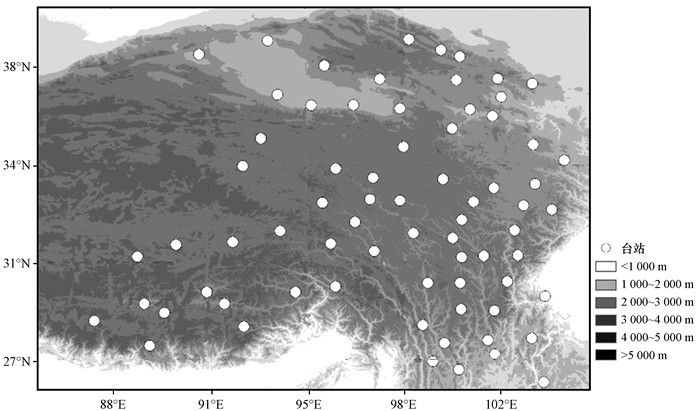
2 资料与方法 2.1 资料选取地表相对湿度和地面气温数据来自中国气象局气候信息中心提供的1961—2014年逐月的高原台站资料。该套资料在高原上共有156个台站, 其中有124个台站自1961以来保持着持续的逐日的观测。在这些台站中, 排除了38个海拔低于2 000 m的台站和12个存在数据问题的台站; 高原的西部台站非常稀疏并且分布不均匀, 这可能影响整个地区该要素的变化, 遂排除了高原西部的3个台站。最终选取了剩下71个海拔高于2 000 m的站点数据(You et al, 2015b)(图 1)。根据所选观测站点的分布, 选取高原中东部86°E—105°E、26°N—40°N作为研究区域。结合欧洲中期天气预报中心(ECMWF)提供的ERA-Interim再分析资料(Dee et al, 2011)1979—2014年1°×1°的月平均风场、比湿场以及地面气压场, 计算高原及附近整层垂直积分的水汽输送通量来研究相对湿度变化原因。
|
图 1 高原及其周边地区的地形(阴影区)和所选71个站点位置(白点)分布 Figure 1 The distribution of topography (the shaded) and 71 surface stations (white dots) over the Qinghai-Tibetan Plateau and its surroundings |
整层大气水汽输送通量公式:
| $ Q=-\frac{1}{g}\int _{_{{{P}_{s}}}}^{^{{{P}_{t}}}}\vec{V}q\text{d}P\text{ }, ~ $ | (1) |
该式包括纬向和经向的水汽输送通量:
| $ {{Q}_{纬}}=-\frac{1}{g}\int _{_{Ps}}^{^{{{P}_{t}}}}uq\text{d}P\text{ }, $ | (2) |
| $ {{Q}_{经}}=-\frac{1}{g}\int _{_{{{P}_{s}}}}^{^{{{P}_{t}}}}vq\text{d}P\text{ }, $ | (3) |
式中:
在水汽输送的水平积分上采用如下计算公式:
纬向水汽收支:
| $ {{F}_{u}}=\int {{Q}_{\lambda }}a\text{d}\mathit{\Phi }\text{ }, $ | (4) |
经向水汽收支:
| $ {{F}_{v}}=\int {{Q}_{\mathit{\Phi }}}a\cos \mathit{\Phi }\text{d}\lambda \text{ }, $ | (5) |
区域净收支:
| $ {{D}_{s}}=\sum ({{F}_{u}}, \text{ }{{F}_{v}})\text{ }, $ | (6) |
式中: Φ为经度; λ为纬度; a为地球半径。
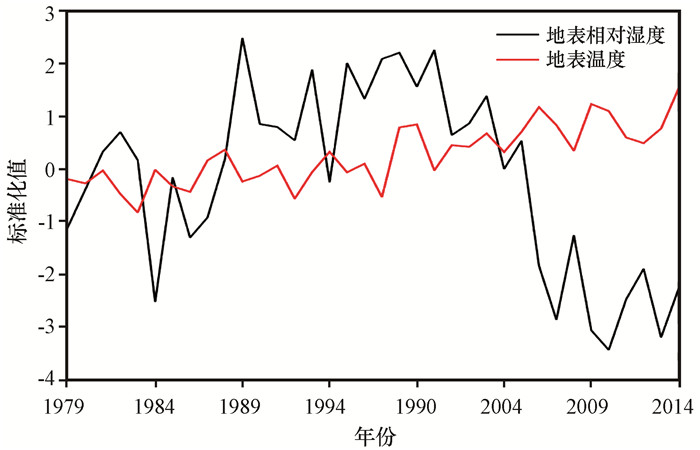
3 高原中东部地表相对湿度变化特征通过计算得到了1979—2014年高原中东部71个站点地表相对湿度和地表温度的变化曲线(图 2), 由图 2可知, 尤其是2000年后, 该地区地表气温存在持续增暖的变化趋势, 这也是高原对全球气温增暖的响应(张人禾等, 2015)。黄芳芳等(2016)对2001—2012年高原地表气温进行研究, 也发现了此缓慢上升的趋。同样引起关注的是该地区地表相对湿度的变化特征, 在2000年之后原本微弱增加的相对湿度开始快速减弱。
|
图 2 1979—2014年青藏高原中东部71个观测站点标准化后地表相对湿度和地表温度的变化曲线 Figure 2 Regional anomaly of surface relative humidity and surface temperature on the annual basis over the Qinghai-Tibetan Plateau from the 71 surface stations from 1979 to 2014 |
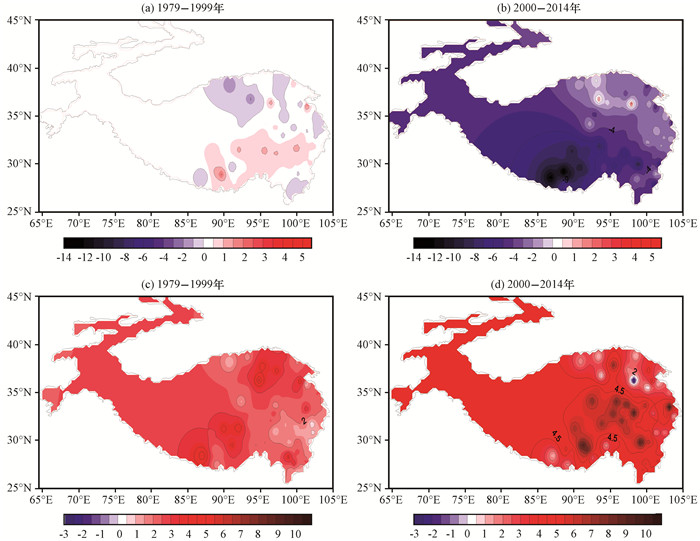
为了区分2000年前后高原地表相对湿度和地表气温的不同变化, 分别计算了1979—1999年和2000—2014年此两个时间段内地表相对湿度和地表气温的变化趋势(图 3)。在2000年之前地表相对湿度[图 3(a)]在高原中东部增加和减弱的变化趋势并不显著, 在高原中部偏南部相对湿度存在较弱的增加趋势而偏北部有相对湿度减弱的趋势。相比较之下, 2000年之后[图 3(b)], 高原整体出现大幅度的相对湿度减弱的变化趋势, 尤其是位于高原的中部偏南部地区, 该地区相对湿度减少变化幅度最大达到-10%·(10a)-1。在2000年之后, 高原相对湿度的减少主要位于高原南部偏西部地区。Gao et al (2014)发现高原上湿润的南部和东南部有变干的趋势, 此结果在一定程度上与本文的发现相切合。而对于高原的地表温度, 在2000年之前高原增温幅度较弱[图 3(c)], 增温幅度的大值区集中在西南角和东北角; 而在2000年之后高原的整体呈现较强的增温趋势[图 3(d)]。
|
图 3 1979—1999年(左)、2000—2014年(右)青藏高原地表相对湿度倾向率[a, b, 单位: %·(10a)-1]和地表气温倾向率[c, d, 单位: ℃·(10a)-1]分布 Figure 3 The spatial patterns of trend of surface relative humidity [a, b, unit: %·(10a)-1] and the surface temperature [c, d, unit: ℃·(10a)-1] over the Qinghai-Tibetan Plateau from 71 surface stations during 1979—1999 (left) and 2000—2014 (right) |
根据Clausius-Clapeyron方程, 温度的升高通过影响饱和水汽压变化, 使饱和水汽压增加(Isaac et al, 2012)。在该地区, 随着地表温度的不断升高, 地表大气中能够容纳的水汽量将会增加。但是在高原中东部地表的相对湿度却成急速减小的趋势。对于这样的相对湿度随着温度的不断增高而减小的现象, 结合Clausius-Clapeyron方程中温度、饱和水汽压以及相对湿度之间的关系, 接下来将从高原中东部的水汽输送的变化来研究其相对湿度的减小原因。
4 高原及其周边水汽输送变化利用ERA-Interim再分析资料计算了高原周围多年平均水汽输送情况(图 4)。2000年前后两个时段水气输送的路径并未有显著区别[图 4(a), (b)], 都表现为高原南部全年整层水汽输送以西南方向为主, 其他地区以纬向输送为主。源自南半球的强东风水汽输送越过赤道到达北半球赤道低纬地区, 并转向形成一条强大的偏西风水汽输送大值带, 由索马里附近向着北半球中高纬输送, 到达孟加拉湾后受到副高的影响转向东北, 将孟加拉湾上的水汽携带至高原南部。而对于高原中部以及北部地区, 水汽主要是由西风带携带至此。

|
图 4 1979—1999年(a)、2000—2014年(b)高原(矩形框)及其周边整层水汽输送通量[矢量, 单位: kg·(m·s)-1]和2000年之后经向水汽输送通量变化趋势[c, 彩色区, 单位: kg·(m·s)-1·(10a)-1] Figure 4 The spatial patterns of the vertically integrated water vapor transport [vector, unit: kg·(m·s)-1] over the Qinghai-Tibetan Plateau (rectangle) during 1979—1999 (a) and 2000—2014 (b) as well as the trend of meridional integrated water vapor transport after 2000 [c, color area, unit: kg·(m·s)-1·(10a)-1] |
2000年前后虽然水汽输送的路径移动改变较小, 但是在高原南部的水汽输送强度区存在强、弱之分。通过计算2000年之后的经向的水汽输送通量趋势[图 4(c)]可发现, 由孟加拉湾输送到高原南部的水汽通量有减少的趋势。高原南部的水汽减弱区与高原相对湿度的减弱趋势最强区域相对应, 这样的对应也许正是相对湿度减少的真正原因所在。
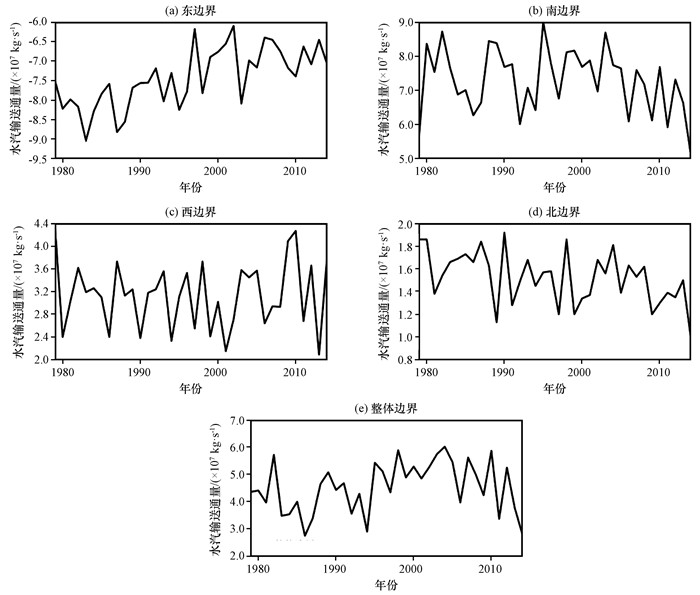
为了将研究区域水汽输送的研究定量化, 通过净水汽输送通量公式, 计算了各边界以及全区的净水汽输送通量(图 5)。在图 5中, 1979—2014年高原东边界是唯一一条年平均水汽处于向外输出的边界[图 5(a)], 输出值为-7.42×10⁷ kg·s-1(表 1), 其他三条边界(南、西和北边界)的多年平均水汽输送都表现为输入[图 5(b)~(d)], 输入量分别为7.30×10⁷ kg·s-1、3.14×10⁷ kg·s-1和1.52×10⁷ kg·s-1(表 1)。定量数据之后发现, 高原的南边界年平均水汽输入的量值最大, 是整个区域主要的水汽输入边界。从南边界逐年变化来看[图 5(b)], 通过南边界进入高原的水汽在2000年之前呈现波动状态, 但是在2000年之后, 该边界的水汽输送有减少的趋势。西边界向高原的水汽输送变化始终处于波动状态, 并没有水汽量增加或者减少这样单边倒的变化[图 5(c)]; 而北边界有水汽的输入, 虽然在量级上最小, 但其在2000年之后水汽输送的量和南边界一样都在减弱[图 5(d)]。
|
图 5 1979—2014年研究区域东(a)、南(b)、西(c)、北(d)和整体(e)边界的净水汽输送通量变化 Figure 5 Annual average net water vapor transport flux through the east (a), south (b), west (c), north (d) boundary and the sum of them (e) of Qinghai-Tibetan Plateau from 1979 to 2014 |
| 表 1 研究区域各边界信息 Table 1 The information of each boundary |
南边界是主要的水汽输送边界, 南边界输入水汽量的减少, 导致高原整个区域的净水汽输送量在2000年之后处于逐渐减少阶段[图 5(e)]。这使得进入高原的水汽逐渐减少, 结合前面关于Clausius-Clapeyron方程中温度、饱和水汽压以及相对湿度之间的关系, 不难发现:高原温度不断升高, 使得空气中饱和水汽压逐渐增大, 即随着温度逐渐升高, 空气中能够容纳的水汽含量逐渐增多, 但是在2000年之后外界向高原输送的水汽逐渐减少, 也就是说2000年之后高原的温度持续在增高, 空气中能够容纳更多的水汽, 但实际情况却是外界向高原输送的水汽没有增加却相应的逐渐减少, 这就导致高原上的空气中实际存在的水汽占可以容纳至饱和状态的水汽比值逐渐减小, 即相对湿度逐渐减小, 最终造成了图 2中高原相对湿度在2000年之后快速减小的现象。
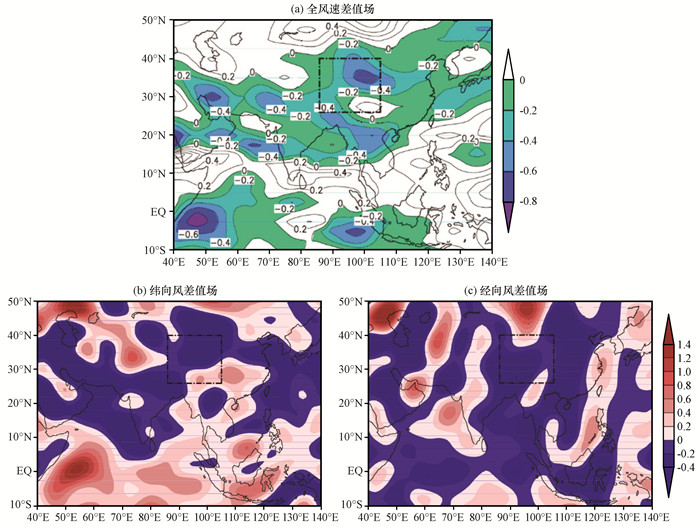
5 高原水汽输送通量变化的动力因素高原的水汽输送是一个动力输送过程, 其减弱的原因分析离不开对该动力过程的分析。500 hPa层的风速变化分析结果表明: 2000年之后500 hPa层的全风速相对于1979—2014年年平均, 在高原中大部分区域以及其西南侧全风速都较弱[图 6(a)]; 特别的, 对于纬向风[图 6(b)], 2000年之后的时间段中, 高原四周除了南侧地区存在减弱的中心区域, 高原其他周围地区并没有明显的减弱中心, 这与图 5(c)中水汽输送通量没有单边的增加或者减少的现象一致; 同样的, 高原四周大部分地区的经向风在2000年之后的变化也处于减弱的状态, 尤其是高原水汽输送主要来源的南边界以南[图 6(c)]。经向风的减弱是直接导致向高原南边界输送水汽减少的直接原因。
|
图 6 青藏高原(矩形框)及其四周500 hPa层全风速(a, 等值线, 彩色区为负值区)、纬向风(b)和经向风(c)于2000—2014年与1979—2014年年平均的差值场(单位: m·s-1) 数据源于NCEP/NCAR再分析资料 Figure 6 The difference fields of the wind speed (a, contour, and the negative values are emphasized by the shadow field), the zonal wind speed (b), and the meridional wind speed (c) between the average fields of 2000—2014 and 1979—2014 over Qinghai-Tibetan Plateau at 500 hPa from NCEP/NCAR reanalsis dataset.Unit: m·s-1 |
利用高原71个站点的观测资料分析了高原地表气温和相对湿度的变化特征, 并利用欧洲中期天气预报中心(ECMWF)提供的ERA-Interim再分析资料对其变化现象进行了大气环流场的分析和解释, 得到如下初步结论:
(1) 1979—2014年高原地表气温变化曲线呈现持续增高趋势, 而其相对湿度自2000年之后迅速减少。从气候倾向率的分布情况来看, 2000年之后, 高原大部分区域地表气温增温明显快于2000年之前的增温幅度; 而地表相对湿度则呈现在高原西南角上减少幅度的极大值区域。
(2) 2000年之后年平均水汽输送通量分布在高原西南角出现一个较弱的负值区, 与地表相对湿度气候倾向率的负值区一致。
(3) 高原年平均整层水汽输送以南边界的输入为主, 输入值为7.30×10⁷ kg·s-1, 东边界是其唯一一条水汽输出的边界, 其输出值为-7.42×10⁷ kg·s-1, 与2000年之后相对湿度减弱的中心区相对应, 高原南边界的水汽输送也呈现逐渐减弱的趋势。对于高原整体而言, 年平均水汽的输送为净输入, 年平均净水汽输入量达4.54×10⁷ kg·s-1, 其在2000年之后同样呈现逐渐减弱的趋势。
(4) 通过500 hPa层的风速变化发现2000年之后风速呈减弱的趋势, 主要表现为经向风的减弱。
根据Clausius-Clapeyron方程中温度、饱和水汽压以及相对湿度之间的相互关系, 高原地表空气温度持续增加, 导致空气中所能容纳的水汽能力增强, 而此时外界向高原提供的水汽并没有相应增加反而呈现减弱的态势, 这样实际存在的水汽占所能容纳水汽的比值逐渐降低, 即相对湿度的数值呈现减少的趋势。而造成高原水汽输送减弱主要是由于环境风场的减弱使得南边界水汽输送减弱导致的。至于风场的减弱原因本文还未深入讨论, 可能是由于位于高原的持续增温导致海陆热力差异逐渐减弱, 这在今后的研究中还需要深入地讨论。
Dee D P, Uppala S M, Simmons A J, et al. 2011. The ERA-Interim reanalysis:configuration and performance of the data assimilation system[J]. Quart J Roy Meteor Soc, 137(656): 553–597.
DOI:10.1002/qj.v137.656 |
|
Feng L, Zhou T J. 2012. Water vapor transport for summer precipitation over the Tibetan Plateau:Multidata set analysis[J]. J Geophys Res Atmos, 117(D20): 85–99.
|
|
Gao Y H, Cuo L, Zhang Y X. 2014. Changes in moisture flux over the Tibetan Plateau during 1979—2011 and possible mechanisms[J]. J Climate, 27: 1876–1893.
DOI:10.1175/JCLI-D-13-00321.1 |
|
Hardwick J R, Westra S, Sharma A. 2011. Observed relationships between extreme sub-daily precipitation, surface temperature, and relative humidity[J]. Geophys Res Lett, 37(22): L22805.
|
|
Lin H B, You Q L, Jiao Y, et al. 2015. Spatial and temporal characteristics of the precipitation over the Tibetan Plateau from 1961 to 2010 based on high resolution grid-observation dataset[J]. J Natural Resour, 30(2): 271–281.
|
|
Liu X D, Chen B D. 2000. Climatic warming in the Tibetan Plateau during recent decades[J]. Int J Climatol, 20(14): 1729–1742.
DOI:10.1002/(ISSN)1097-0088 |
|
Isaac V, Wijngaarden W A V. 2012. Surface water vapor pressure and temperature trends in North America during 1948—2010[J]. J Climate, 25(10): 3599–3609.
DOI:10.1175/JCLI-D-11-00003.1 |
|
Simmons A J, Willett K M, Jones P D, et al. 2010. Low-frequency variations in surface atmospheric humidity, temperature, and precipitation:Inferences from reanalyses and monthly gridded observational datasets[J]. J Geophys Res, 115(D1): 1–21.
|
|
Wu S H, Yin Y H, Du Z, et al. 2007. Climatic trends over the Tibetan Plateau during 1971—2000[J]. J Geographical Sci, 17(2): 141–151.
DOI:10.1007/s11442-007-0141-7 |
|
Xu X D, Shi X Y, Wang Y Q, et al. 2008. Data analysis and numerical simulation of moisture source and transport associated with summer precipitation in the Yangtze River Valley over China[J]. Meteorology & Atmospheric Physics, 100(1-4): 217–231.
|
|
You Q L, Min J Z, Lin H B, et al. 2015a. Observed climatology and trend in relative humidity in the central and eastern Tibetan Plateau[J]. J Geophys Res Atmos, 120(9): 3610–3621.
DOI:10.1002/2014JD023031 |
|
You Q L, Min J Z, Zhang W, et al. 2015b. Comparison of multiple datasets with gridded precipitation observations over the Tibetan Plateau[J]. Climate Dyn, 45: 791–806.
DOI:10.1007/s00382-014-2310-6 |
|
Zhou S W, Wu P, Wang C H, et al. 2012. Spatial distribution of atmospheric water vapor and its relationship with precipitation in summer over the Tibetan Plateau[J]. Acta Geographica Sinica, 22(5): 795–809.
|
|
达瓦次仁. 2010. 全球气候变化对青藏高原水资源的影响[J]. 西藏研究(4): 90–99.
Dawa C R. 2010. Impacts of global warming on the water resources of Tibetan Plateau[J]. Tibetan Studies(4): 90–99.
|
|
丁一汇, 胡国权. 2003. 1998年中国大洪水时期的水汽收支研究[J]. 气象学报, 61(2): 129–145.
Ding Y H, Hu G Q. 2003. A study on water vapor budget over China during the 1998 severe flood periods[J]. Acta Meteor Sinica, 61(2): 129–145.
DOI:10.11676/qxxb2003.014 |
|
黄芳芳, 马伟强, 李茂善, 等. 2016. 藏北高原地表温度对气候变化响应的初步分析[J]. 高原气象, 35(1): 55–63.
Huang F F, Ma W Q, Li M S, et al. 2016. Analysis on responses of land surface temperature on the northern Tibetan Plateau to climate change[J]. Plateau Meteor, 35(1): 55–63.
DOI:10.7522/j.issn.1000-0534.2015.00075 |
|
梁宏, 刘晶淼, 章建成, 等. 2006. 青藏高原大气总水汽量的反演研究[J]. 高原气象, 25(6): 1055–1063.
Liang H, Liu J M, Zhang J C, et al. 2006. Research on retrieval of the amount of atmospheric water vapor over Qinghai-Xizang Plateau[J]. Plateau Meteor, 25(6): 1055–1063.
|
|
林厚博, 游庆龙, 焦洋, 等. 2016. 青藏高原及附近水汽输送对其夏季降水影响的分析[J]. 高原气象, 35(2): 309–317.
Lin H B, You Q L, Jiao Y, et al. 2016. Water vapor transportation and its influences on precipitation in summer over Qinghai-Xizang Plateau and its surroundings[J]. Plateau Meteor, 35(2): 309–317.
DOI:10.7522/j.issn.1000-0534.2014.00146 |
|
李育, 朱耿睿. 2015. 三大自然区过渡地带近50年来气候类型变化及其对气候变化的响应[J]. 地球科学进展, 30(7): 791–801.
Li Y, Zhu G R. 2015. Changes of climate zones in the Transition area of three natural zones during the past 50 years and their responses to climate change[J]. Adv Earth Sci, 30(7): 791–801.
DOI:10.11867/j.issn.1001-8166.2015.07.0791 |
|
刘玉英, 李宇凡, 谢今范, 等. 2016. 东北高空湿度变化特征及其与地面气温和降水的关系[J]. 地理科学, 36(4): 628–636.
Liu Y Y, Li Y F, Xie J F, et al. 2016. Climate change characteristics of free atmospheric humidity and its relationship with temperature and precipitation in northeast China[J]. Sci Geographica Sinica, 36(4): 628–636.
|
|
莫申国, 张百平, 程维明, 等. 2004. 青藏高原的主要环境效应[J]. 地理科学进展, 23(2): 88–96.
Mo S G, Zhang B P, Cheng W M, et al. 2004. Major environmental effects of the Tibetan Plateau[J]. Progress in Geography, 23(2): 88–96.
DOI:10.11820/dlkxjz.2004.02.011 |
|
施晓晖, 徐祥德, 程兴宏. 2009. 2008年雪灾过程高原上游关键区水汽输送机制及其前兆性"强信号"特征[J]. 气象学报, 67(3): 478–487.
Shi X H, Xu X D, Cheng X H. 2009. Premonitory of water vapor transport in the upstream key region over the Tibetan Plateau[J]. Acta Meteor Sinica, 67(3): 478–487.
DOI:10.11676/qxxb2009.048 |
|
施雅风. 2003. 中国西北气候由暖干向暖湿转型问题评估[M]. 北京: 气象出版社, 17-25.
Shi Y F. 2003. An assessment of the issues of climatic shift from warm-dry to warm-wet in northwest China[M]. Beijing: China Meteorological Press, 17-25.
|
|
陶诗言, 陈联寿. 2000. 第二次青藏高原大气科学试验理论研究进展[M]. 北京: 气象出版社, 106-112.
Tao S Y, Chen L S. 2000. The second research progress of atmospheric science experiment theory in the Tibetan Plateau[M]. Beijing: China Meteorological Press, 106-112.
|
|
吴国雄, 毛江玉, 段安民, 等. 2004. 青藏高原影响亚洲夏季气候研究的最新进展[J]. 气象学报, 62(5): 528–540.
Wu G X, Mao J Y, Duan A M, et al. 2004. Recent progress in the study on the impacts of Tibetan Plateau on Asian summer climate[J]. Acta Meteor Sinica, 62(5): 528–540.
DOI:10.11676/qxxb2004.054 |
|
王霄, 巩远发, 岑思弦. 2009. 夏半年青藏高原"湿池"的水汽分布及水汽输送特征[J]. 地理学报, 64(5): 601–608.
Wang X, Gong Y F, Cen S X. 2009. Characteristics of the moist pool and its moisture transports over Qinghai-Xizang Plateau in summer half year[J]. Acta Geographic Sinica, 64(5): 601–608.
DOI:10.11821/xb200905009 |
|
解承莹, 李敏姣, 张雪芹. 2014. 近30a青藏高原夏季空中水资源时空变化特征及其成因[J]. 自然资源学报, 29(6): 979–989.
Xie C Y, Li M J, Zhang X Q. 2014. Characteristics of summer atmospheric water resources and its causes over the Tibetan Plateau in recent 30 years[J]. J Natural Resour, 29(6): 979–989.
DOI:10.11849/zrzyxb.2014.06.007 |
|
谢启玉, 巩远发, 杨蓉, 等. 2015. 基于ERA-Interim资料分析青藏高原"湿池"变化特征[J]. 自然资源学报, 30(7): 1163–1171.
Xie Q Y, Gong Y F, Yang R, et al. 2015. The characteristics of the moist pool over the Tibet Plateau based on ERA-Interim data[J]. J Natural Resour, 30(7): 1163–1171.
DOI:10.11849/zrzyxb.2015.07.009 |
|
徐祥德, 赵天良, LuChungu, 等. 2014. 青藏高原大气水分循环特征[J]. 气象学报, 72(6): 1079–1095.
Xu X D, Zhao T L, Lu C G, et al. 2014. Characteristics of the water cycle in the atmosphere over the Tibetan Plateau[J]. Acta Meteor Sinica, 72(6): 1079–1095.
DOI:10.11676/qxxb2014.091 |
|
杨逸畴, 高登义, 李澍生. 1987. 雅鲁藏布江下游河谷水汽通道初探[J]. 中国科学(B辑), 17(8): 893–902.
Yang Y C, Gao D Y, Li B S. 1987. Preliminary study of water vapor pass along the downstream of Yarlung Zangbo[J]. Sci China (Ser B), 17(8): 893–902.
|
|
郑度, 林振耀, 张雪芹. 2002. 青藏高原与全球环境变化研究进展[J]. 地学前缘, 9(1): 95–102.
Zheng D, Lin Z Y, Zhang X Q. 2002. Progress in studies of Tibetan Plateau and global environmental change[J]. Earth Science Frontiers, 9(1): 95–102.
|
|
张人禾, 苏凤阁, 江志红, 等. 2015. 青藏高原21世纪气候和环境变化预估研究进展[J]. 科学通报, 60: 3036–3047.
Zhang R H, Su F G, Jiang Z H, et al. 2015. An overview of projected climate and environmental changes across the Tibetan Plateau in the 21st century[J]. Chinese Sci Bull, 60: 3036–3047.
|
|
周顺武, 吴萍, 王传辉, 等. 2011. 青藏高原夏季上空水汽含量演变特征及其与降水的关系[J]. 地理学报, 66(11): 1466–1478.
Zhou S W, Wu P, Wang C H, et al. 2011. Spatial distribution of atmospheric water vapor and its relationship with precipitation in summer over the Tibetan Plateau[J]. Acta Geographica Sinica, 66(11): 1466–1478.
DOI:10.11821/xb201111003 |
|
周玉淑, 高守亭, 邓国. 2005. 江淮流域2003年强梅雨期的水汽输送特征分析[J]. 大气科学, 29(2): 195–204.
Zhou Y S, Gao S T, Deng G. 2005. A diagnostic study of water vapor transport and budget during heavy precipitation over the Changjiang River and the Huaihe River basins in 2003[J]. Chinese J Atmos Sci, 29(2): 195–204.
|
 2018, Vol. 37
