2. 贵州省黔东南州气象局, 贵州 凯里 556000;
3. 贵州省气象信息中心, 贵州 贵阳 550002;
4. 云南省气象信息中心, 云南 昆明 650034
干旱是世界最主要灾害性气候之一, 中国是发展中的干旱气候研究大国, 中蒙干旱气候区是全球独特的中纬度干旱区(钱正安等, 2017a), 而青藏高原地形是中蒙干旱形成的主要因素, 大气环流是中蒙干旱形成的次要因素(钱正安等, 2017b)。钱正安等(2017a, 2017b)还指出近百年的全球气候变化是以全球气温一致变暖、降水气候则更多时、空间变化为主要特征。由于近年来云贵高原东部时有极端干旱事件发生, 如2009年秋季至2010年春季, 贵州遭遇了有气象记录以来持续时间最长、最严重的秋、冬、春连旱(池再香等, 2012a), 严重影响人、畜饮水和小麦、油菜、马铃薯、蔬菜等作物的生长发育。根据降雨、洪水发生规律和气象成因分析, 贵州将4-9月划分为汛期, 全年的降水量主要集中在此期间, 且4-9月又是云贵高原东部水稻、马铃薯、玉米等粮食作物和柑桔类、梨类、桃类以及猕猴桃、苹果等水果作物的生长季节, 温度和降水是影响粮食作物生长发育的主要气象因子(余卫东等, 2007)。
目前, 国内外研究气候干湿状况的方法主要有积温降水比、气温降水比、蒸散降水比、降水蒸散比等, 其中降水蒸散比是最常用的方法(池再香等, 2016;李翔翔等, 2015;杨世刚等, 2011;冯建设等, 2011;王明田等, 2012;任菊章等, 2014;马建勇等, 2012), 池再香等(2016)曾比较积温干燥度指数和相对湿润指数后, 认为积温干燥度指数在云贵高原东部地区辨识干湿状况的能力强, 更适于地形地貌复杂的农业旱涝监测评估。张红丽等(2016)用干燥度指数分析了中国南方和北方气候干燥程度和变化及其差异, 指出北方气候干燥程度对降水依赖比南方强。马柱国等(2005)研究指出了温度在干旱化中的应用。但大多研究主要针对夏季(6-8月)气象干旱(蔡晓军等, 1998;段旭等, 2000;荣艳淑等, 2007;陈丽华等, 2010), 但也有研究年尺度气象干旱的, 如郑建萌等(2017)利用降水距平百分率、综合气象干旱指数、降水气温均一化指数等方法研究云南1961-2012年的年尺度气象干旱。熊光洁等(2014)利用相对湿润指数、标准化降水指数、标准化降水蒸散指数等三种指数分析中国西南地区近61年不同时间尺度干旱特征, 评估该三种指数在西南地区的适用性。通过比较, 从众多方法中选用包含了温度和降水量要素的积温干燥度指数作为干旱指标, 分析1958-2015年云贵高原东部4-9月(下称汛期)干湿分布特征, 并进一步利用Mann-Kendall(简称M-K)和Morlet小波方法, 分析降水量和积温干燥度指数的突变及周期特征以及干、湿状况变化趋势, 对云贵高原东部汛期防旱防涝避灾提供参考依据。
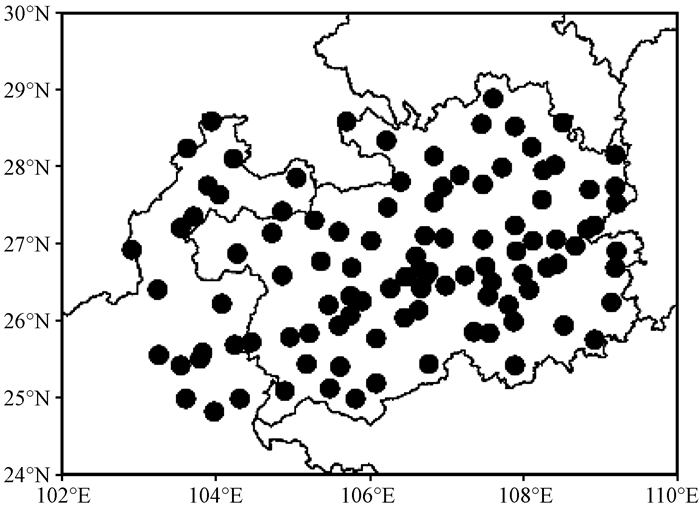
2 资料与方法 2.1 研究区域资料来源云贵高原东部包括贵州省的84个市县和云南东部的20个市县, 地理位置为102°42′E-109°35′E、24°19′N-29°13′N, 研究区域气象站点分布见图 1[文中所涉及的地图来源于中国气象局气象信息综合分析处理系统(MICAPS)地图图形, 底图无修改, 下同]。云贵高原东部104个气象观测站1958-2015年的4月1日至9月30日逐日平均温度和降水量观测资料来源于贵州省气象信息中心和云南省气象信息中心。
|
图 1 云贵高原东部104个气象测站分布 Figure 1 Distribution of 104 meteorological observational stations in the eastern Yunnan-Guizhou Plateau |
积温干燥度指数(K)适用于汛期干旱监测评估, 其计算式(池再香等, 2012a)为:
| $ K = 0.22\frac{{\sum T}}{{\sum R}}{\rm{ }}, $ | (1) |
式中:K为某年汛期(4月1日至9月30日)的积温干燥度指数[单位: ℃·(d·mm)-1]; ∑T为同期日平均温度之和(单位: ℃); ∑R为同期日降水量之和(单位: mm)。K值越大, 表示汛期气候越干燥, 气象干旱越严重; K值越小, 表示汛期气候越湿润, 气象干旱越轻。
参考国家标准《气象干旱等级》中降水距平百分率指标(全国气候与气候变化标准委员会, 2017), 将云贵高原东部近60年汛期逐年降水距平百分率(PA)与同期的积温干燥度值(K)相对应, 规定某级气象干旱等级的积温干燥度指数所对应的降水距平百分率保证率达80%以上, 对汛期积温干燥度指数进行分级(表 1)。
| 表 1 汛期积温干燥度气象干旱等级划分标准 Table 1 The meteorological drought classification standard of accumulated temperature dryness (K) in flood season |
Morlet小波分析不仅能反映信号在时频域上的总体特征, 还能提供局部化的信息, 具有反映信号变化的时间尺度和显示信号变化的时间位置以及突变点的诊断能力。在许多领域得到了广泛的应用, 尤其是在气候变化分析的气候预测方面应用较多(池再香等, 2012b;全利红等, 2007;毛飞等, 2008)。小波母函数为
| $ \psi \left(t \right) = (1 - {t^2})\frac{1}{{\sqrt {2\pi } }}{e^{ - \frac{{{t^2}}}{2}}}{\rm{ }}, - \infty < t < \infty $ | (2) |
式中: t为时间。采用Morlet小波对近60年云贵高原东部汛期降水量和积温干燥度指数进行连续小波变化, 得到小波变换系数的实部时频来揭示汛期降水量和积温干燥度指数的变化特征。
2.2.3 Mann-Kendall突变方法利用M-K方法(魏凤英, 2007)分析不同时间尺度降水量和平均积温干燥度指数的突变情况。原始序列曲线(UF)与反序列曲线(UB)出现交点, 并且交点在临界线之间, 则交点对应的时刻便为突变开始时间。如果超过了临界线的范围, 就确定它为出现突变时间区域(魏凤英, 2007)。
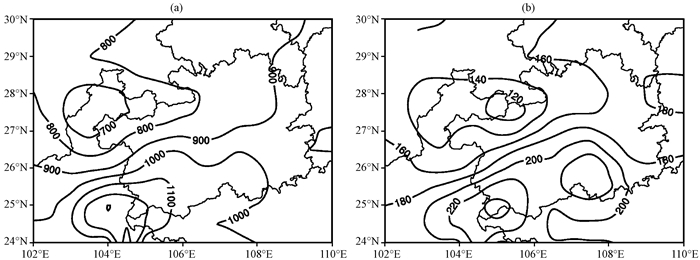
3 结果与分析 3.1 降水量空间分布由云贵高原东部汛期降水量的气候平均分布[图 2(a)]可以看出, 云贵高原东部降水量大多在800~1 000 mm之间, 呈南多北少的空间分布特点, 大值中心(大于1 200 mm)位于云南罗平-贵州兴义一带, 小值中心(小于570 mm)位于云南昭通, 可见降水量大、小值的中心与地形有关。由于昭通位于乌蒙山脉的西北侧, 处于乌蒙山脉的背风坡, 其主要受干燥的大陆气候影响, 云量少, 降水也少。罗平-兴义位于乌蒙山脉的东南侧, 处于乌蒙山脉的迎风坡, 其主要受偏南暖湿气流影响, 云量多, 降水也多。
|
图 2 云贵高原东部汛期降水量气候特征(a)及标准差(b)分布(单位: mm) Figure 2 Precipitation climatic characteristic (a) and standard deviation (b) distribution in flood season in the eastern Yunnan-Guizhou Plateau.Unit: mm |
为了分析云贵高原东部汛期降水量的年际变化程度, 通过汛期降水量的标准差分布[图 2(b)]可以看出, 标准差分布与其降水量空间分布特征相似, 亦呈南高北低。但两者大、小值中心存在明显不同, 标准差有两个大值中心, 分别位于贵州兴义和贵州都匀, 其中心值均超过250 mm, 而小值中心在贵州毕节, 中心值不足110 mm。
由此可见, 云贵高原东部汛期降水量的年际变化空间差异明显。
3.2 降水量变化及周期特征通过云贵高原东部汛期平均降水量的年际变化趋势及突变(图 3)看出, 降水量呈下降趋势[图 3(a)], 线性趋势为-16.13 mm·(10a)-1, 并通过P=0.01显著性水平检验。由图 3(a)还可以看出, 在20世纪50年代后期至70年代和21世纪初至10年代中期表现为“少-多-少-多”的4年周期; 20世纪80年代和90年代分别表现为“多-少”和“少-多”相间的2年周期。从滑动平均曲线看, 其变化具有显著阶段性特点, 20世纪50年代后期至60年代初期平均水平较低, 其降水量为850 mm; 60年代中期至70年代平均水平最高, 其降水量为990 mm; 80年代平均水平略低, 其降水量为910 mm; 90年代平均水平略高, 其降水量为950 mm; 21世纪初年代平均水平最低, 其降水量为800 mm, 是半个世纪降水少、干旱最重的10年; 从2012年开始, 降水量呈增多趋势, 平均值为970 mm, 比前54年平均值增加了100 mm。由此可见, 云贵高原东部汛期降水量与亚洲大陆东部变化趋势是一致的, 以显著减少为主(蒋贤玲等, 2015)。大范围降水的一致减少可能与环境改变和大气环流背景的长期变化有一定的联系。由图 3(b)看出, 降水量序列(UF, 实线)在20世纪60年代至80年代较高, 之后逐渐降低, 且在1997年呈现显著下降趋势。根据原序列与反序列曲线(UB, 虚线)交点的位置, 可以确定在1997/1998年开始出现降水量由多到少的突变, 突变年后, 降水量呈极显著减少趋势, 其线性趋势为-21.53 mm·(10a)-1(P < 0.01), 并在21世纪初年代降水量序列(UF, 实线)较低, 之后逐渐升高。

|
图 3 云贵高原东部汛期降水量年际变化(a, 柱状)及M-K突变检验(b) Figure 3 Interannual variability of precipitation (a, column) and its M-K statistic curve (b) in flood season in the eastern Yunnan-Guizhou Plateau |
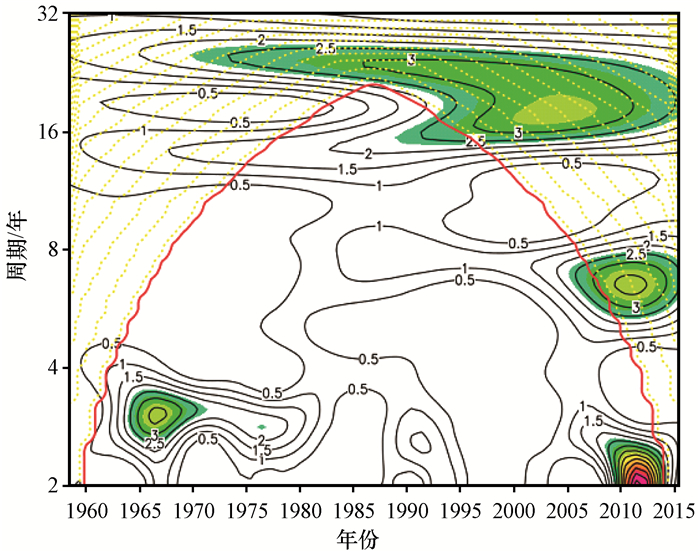
由云贵高原东部汛期降水量的周期特征(图 4)可以看出, 20世纪60-70年代存在3~4年的周期变化, 21世纪初年代存在一个2~3年的周期变化。需要说明的是, 在21世纪初年代至今还存在7年左右和18~20年的周期受头部影响, 可能存在虚假, 在此不予取用。
|
图 4 云贵高原东部汛期降水量周期特征 等值线表示小波变换系数实部, 黄色及红色线表示小波变换受边界影响的区域, 阴影区域表示通过P=0.01显著性水平检验 Figure 4 Periodic features of precipitation on flood season in the eastern Yunnan-Guizhou Plateau. The contour line represents the real part of the wavelet transform coefficient, the yellow and red lines represent areas where the wavelet transform are affected by the boundary, the shaded area indicates that it has passed the significant level test of P=0.01 |
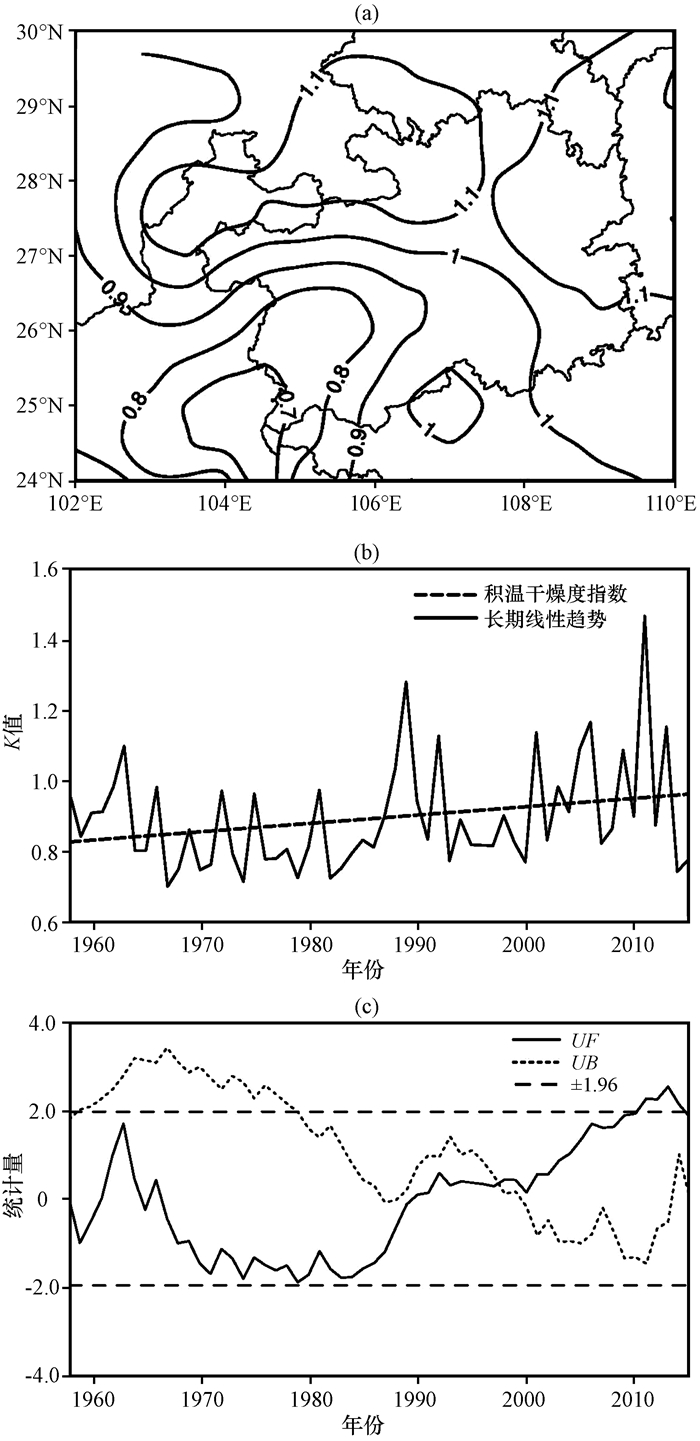
由云贵高原东部汛期积温干燥度的空间分布及其变化趋势和突变(图 5)可以看出, 云贵高原东部积温干燥度指数大/小的空间分布[图 5(a)]与降水量少/多的分布[见图 2(a)]基本一致。积温干燥度指数小值中心[小于0.7 ℃·(d·mm)-1]在云南罗平-贵州兴义之间, 结合表 1可知, 西南部地区积温干燥度指数在0.8 ℃·(d·mm)-1以下, 说明该区域汛期基本无干旱发生; 而积温干燥度指数大值中心[大于等于1.1 ℃·(d·mm)-1]分布在云南昭通-贵州北部和东部, 结合表 1, 说明该区域汛期常有干旱发生。1958-2015年平均积温干燥度指数为0.897 1 ℃·(d·mm)-1, 呈略增加趋势[图 5(b)], 增加率为0.002 ℃·(d·mm)-1·a-1。结合表 1, 近60年来, 云贵高原东部汛期发生特旱的概率为17.2%, 重旱的概率为12.1%, 中旱的概率为8.6%, 轻旱的概率为34.5%, 无旱的概率为27.6%;由此可见, 云贵高原东部汛期发生轻旱及以下等级占主导地位, 其次是特旱等级, 再次是重旱等级, 说明云贵高原东部的汛期一旦有干旱发生, 就比较严重。由图 5(c)看出, 积温干燥度指数序列(UF, 实线)在20世纪60年代中前期较高, 60年代后期逐渐降低, 到80年代后期又逐渐升高, 且在1997年呈现显著升高趋势。根据原序列与反序列曲线(UB, 虚线)交点的位置, 可以确定在1997/1998年开始出现积温干燥度指数由低到高的突变, 突变年后, 积温干燥度指数呈显著增高趋势, 其线性趋势为0.074 6 ℃·(d·mm)-1·a-1(P < 0.01), 但在21世纪10年代之后积温干燥度指数序列(UF, 实线)呈降低趋势。由此可知, 积温干燥度指数较好地反映了云贵高原东部近60年来汛期气候干湿变化趋势, 即1997年之前, 云贵高原东部汛期干旱相对较轻; 1997-2013年, 云贵高原东部汛期干旱相对较重; 2013年之后, 云贵高原东部汛期干旱向较轻趋势变化。且积温干燥度指数变化与同期降水量变化呈反位相关系。
|
图 5 云贵高原东部汛期积温干燥度指数(K)空间分布(a)、年际变化(b)及M-K突变检验(c) Figure 5 The accumulated temperature dryness index (K) on spatial distribution (a) and its annual changes (b) and M-K mutation test (c) in flood season in the eastern Yunnan-Guizhou Plateau |
小波分析主要是能在不同时间频率下表现出变量随时间变化的特征。利用云贵高原东部104个气象观测站1958-2015年温度和降水资料, 计算近60年逐年积温干燥度的平均值[图 5(a), (b)]及其距平值, 分析云贵高原东部积温干燥度距平值小波特征。由图 6看出, 在20年时间频率附近, 主要出现7个干湿交替期, 6个突变点的位置分别在1972, 1981, 1988, 1992, 2003和2013年附近, 与此对应的是1972年以前为弱偏湿期、1981-1988年、1992-2003年和2013年以后为偏湿期, 1972-1981年、1988-1992年和2003-2013年为偏干期。从不同时间频率看, 在1992年附近发生了一次强烈的振动, 云贵高原东部汛期气候由偏干期向偏湿期转型。由此可见, 2016年以后云贵高原东部汛期向偏湿气候趋势发展。
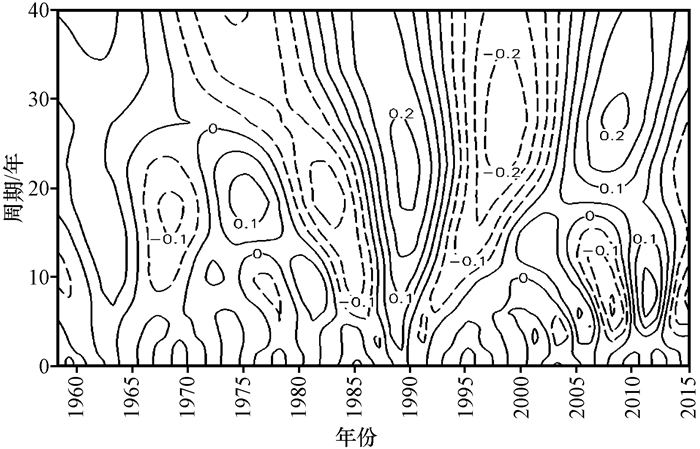
|
图 6 云贵高原东部汛期积温干燥度指数距平小波变化 Figure 6 Annual changes of accumulated temperature dryness index anomaly wavelet in flood season in the eastern Yunnan-Guizhou Plateau |
表 2为干湿均不显著时段(a时段, 1958-1981年)、偏湿最显著时段(b时段, 1982-1988年)、偏干最显著时段(c时段, 1989-1992年)、偏湿过渡时段(d时段, 1993-2003年)、偏干过渡时段(e时段, 2004-2013年)云贵高原东部汛期多年平均各月积温干燥度指数以及对应标准差。总体而言, 汛期具有干湿气候交替发生特征, a时段、b时段和d时段干旱较轻, c时段和e时段干旱较重; 标准差有明显增加趋势, 降水气候在a时段最稳定, 其次b是时段, 再次是c时段; e时段最不稳定, 其次是d时段。各月积温干燥度指数在各时段的分配不同, 4月积温干燥度指数在e时段最高, a时段最稳定; 5月积温干燥度指数在b时段最高, d时段最稳定; 6月积温干燥度指数在e时段最高, c时段最稳定; 7月积温干燥度指数在e时段最高, a时段最稳定; 8月积温干燥度指数在c时段最高, d时段最稳定; 9月积温干燥度指数在d时段最高, e时段最稳定。由此可知, 2014年之后, 云贵高原东部汛期气候向偏湿趋势发展。
| 表 2 不同时段平均积温干燥度指数(K)及标准差 Table 2 The average accumulated temperature dryness index (K) and standard deviation in different periods |
对积温干燥度与各气象因子进行单相关、完全相关分析(表 3)发现, 云贵高原东部汛期平均温度、降水量、蒸发量、日照时数、相对湿度、最高温度和最低温度变化是引起气候干湿的主要因素, 其中降水量与积温干燥度的完全相关系数最大(0.708 9), 平均温度、蒸发量、日照时数、相对湿度、最高温度、最低温度的完全相关系数依次减弱, 风速对积温干燥度无显著影响。
| 表 3 云贵高原东部汛期平均积温干燥度与各气象因子的完全相关系数 Table 3 The complete correlation coefficients between the average accumulated temperature dryness index and the meteorological factors in the eastern Yunnan-Guizhou Plateau |
综合各气象因子变化来看, 近60年来, 平均温度、最高温度、最低温度、日照时数、蒸发量的上升变化以及降水量、相对湿度的下降变化是引起云贵高原东部汛期干旱的主要原因。
4 结论与讨论对云贵高原东部汛期干湿气候变化趋势进行了初步探讨, 得出以下结论:
(1) 从降水气候特征上, 云贵高原东部汛期降水量普遍在800~1 000 mm, 呈现由南向北递减的空间分布特征。但降水量与标准差大、小值的中心位置存在明显不同, 降水量大值中心位于云南罗平-贵州兴义, 其标准差有两个大值中心:一个中心值在贵州兴义, 另一个中心值在贵州都匀; 降水量小值中心位于云南昭通, 其标准差小值中心在贵州毕节。M-K检验结果显示, 降水量在1997/1998年发生由多到少的突变, 突变年后, 降水量呈显著减少趋势, 干旱程度加剧。
(2) 从积温干燥度空间分布上, 云贵高原东部汛期积温干燥度分布与降水量分布呈反位相, 即积温干燥度小值中心(云南罗平-贵州兴义)对应着降水量的大值中心, 但积温干燥度大值中心覆盖面积比降水量小值中心面积偏大, 主要是积温干燥度还受温度的影响。近60年来, 云贵高原东部汛期平均积温干燥度呈增加趋势, 其增加率为0.002 ℃·(d·mm)-1·a-1。M-K检验结果显示, 积温干燥度突变时间与降水量突变时间相同, 突变年后, 积温干燥度显著增高趋势, 其增高率达0.074 6 ℃·(d·mm)-1·a-1, 干旱程度加重, 但2013年之后, 积温干燥度呈降低趋势, 说明2013年之后, 云贵高原东部汛期干旱程度减轻。在20年时间频率附近主要出现7个干湿交替期。气候由偏干期向偏湿期转型, 2016年之后云贵高原东部汛期向偏湿气候趋势发展。
(3) 云贵高原东部汛期积温干燥度与多个气象因子存在显著相关关系, 表明气候干湿变化受多个气象因子的综合影响, 单个气象因子难以体现气候干湿状况的变化。造成云贵高原东部汛期干旱的主要原因是降水量减少, 其次是温度升高。
本研究所采用的积温干燥度指数等级划分标准真实客观地反应了干旱发生程度, 且计算简单, 仅需要逐日平均温度和逐日降水量资料, 能在短时期内或实时地计算出, 有利于大范围应用。云贵高原东部汛期气候在向干旱方向发展, 主要原因是云贵高原东部降水呈减少趋势, 徐建新等(2015)曾得到类似的结果。由于近百年全球平均增暖0.56~0.92 ℃, 但其增暖程度有地区、年代及季节的差异(钱正安等, 2017a, 2017b), 而贵州年平均气温亦呈上升趋势, 其升高率为0.194 ℃·a-1(蒋卓亚, 2017), 贵州西部3-9月平均气温以0.196 ℃·a-1的速度上升(池再香等, 2012b), 气温的升高, 会导致干旱程度的加重, 但云贵高原东部处于孟加拉湾水汽北上与北方冷空气南下的交汇处, 云量多, 对抑制干旱进程起到一定的作用, 且云贵高原东部汛期发生轻旱及以下等级占62.1%, 积温干燥度指数表现为干、湿交替发生。综合上述的分析, 本文认为云贵高原东部汛期未来气候是向偏湿趋势发展。由于云贵高原东部地质地貌复杂, 只用温度和降水两个要素来判断气候干湿变化具有一定的局限性。干旱形成的复杂性, 仍需要进一步地开展研究。
蔡晓军, 李栋梁, 姚辉. 1998. 中国西北地区春末夏初降水的时空变化特征[J]. 高原气象, 17(2): 176–184.
Cai X J, Li D L, Yao H. 1998. Spatiotemporal change on precipitation characteristics from late spring to early summer in Chinese northwest[J]. Plateau Meteor, 17(2): 176–184.
|
|
陈丽华, 周率, 党建涛, 等. 2010. 2006年盛夏川渝地区高温干旱气候形成的物理机制研究[J]. 气象, 36(5): 85–91.
Chen L H, Zhou S, Dang J T, et al. 2010. Research on physical mechanism of summer severe climatic high temperature and drought disasters in Sichuan and Chongqing region in 2006[J]. Meteor Mon, 36(5): 85–91.
|
|
池再香, 杜正静, 陈忠明, 等. 2012a. 2009-2010年贵州秋、冬、春季干旱气象要素与环流特征分析[J]. 高原气象, 31(1): 176–184.
Chi Z X, Du Z J, Chen Z M, et al. 2012a. Analysis on meteorological elements and circulation of drought in Guizhou Province in Autumn-Winter-Spring from 2009 to 2010[J]. Plateau Meteor, 31(1): 176–184.
|
|
池再香, 杜正静, 杨再禹, 等. 2012b. 贵州西部马铃薯生育期气候因子变化规律及其影响分析[J]. 中国农业气象, 33(3): 417–423.
Chi Z X, Du Z J, Yang Z Y, et al. 2012b. Climate factors variation during potato growth period and its effect in western Guizhou province[J]. Chinese J Agrometeor, 33(3): 417–423.
|
|
池再香, 李贵琼, 白慧, 等. 2016. 干季贵州省东西部区域干湿状况差异分析[J]. 中国农业气象, 37(1): 361–367.
Chi Z X, Li G Q, Bai H, et al. 2016. Difference of the dry and wet conditions during dry season in western and eastern of Guizhou province[J]. Chinese J Agrometeor, 37(1): 361–367.
|
|
段旭, 尤卫红, 郑建萌. 2000. 云南旱涝特征[J]. 高原气象, 19(1): 84–90.
Duan X, You W H, Zheng J M. 2000. The drought and flood feature in Yunnan[J]. Plateau Meteor, 19(1): 84–90.
DOI:10.3321/j.issn:1000-0534.2000.01.011 |
|
冯建设, 王建源, 王新堂, 等. 2011. 相对湿润指数在农业干旱监测业务中的应用[J]. 应用气象学报, 22(6): 766–772.
Feng J S, Wang J Y, Wang X T, et al. 2011. The application of relative humidity index to agricultural drought monitoring[J]. J Appl Meteor Sci, 22(6): 766–772.
DOI:10.3969/j.issn.1001-7313.2011.06.016 |
|
蒋贤玲, 马柱国, 巩远发. 2015. 全球典型干湿变化区域水汽收支与降水变化的对比分析[J]. 高原气象, 34(5): 1279–1291.
Jiang X L, Ma Z G, Gong Y F. 2015. Comparative analysis of relationship between moisture budget and precipitation changes among global significantly wetting/drying regions[J]. Plateau Meteor, 34(5): 1279–1291.
DOI:10.7522/j.isnn.1000-0534.2014.00109 |
|
蒋卓亚. 2017. 贵州省平均气温和光照时空变化特征[J]. 气候变化研究快报, 6(2): 116–129.
Jiang Z Y. 2017. Spatial-temporal characteristics of average air temperature and sunshine duration in Guizhou province[J]. Climate Change Res Lett, 6(2): 116–129.
|
|
李翔翔, 居辉, 严昌荣, 等. 2015. 1961-2013年黄淮海平原降蒸差的时空变化特征[J]. 中国农业气象, 36(3): 417–427.
Li X X, Ju H, Yan C R, et al. 2015. Spatiotemporal variability of water deficit in Huang-Huai-Hai plain during 1961-2013[J]. Chinese J Agrometeor, 36(3): 417–427.
|
|
马建勇, 许呤隆, 潘婕. 2012. 基于相对湿润指数的1961-2009年东北地区5-9月干旱趋势分析[J]. 气象与环境学报, 38(3): 90–95.
Ma J Y, Xu Y L, Pan J. 2012. Drought tendency based on standardized precipitation index (SPI) and relative moisture index over Northeast China from May to September during 1961-2009[J]. J Meteor Environ, 38(3): 90–95.
DOI:10.3969/j.issn.1673-503X.2012.03.016 |
|
马柱国, 黄刚, 甘文强, 等. 2005. 近代中国北方干湿变化趋势的多时段特征[J]. 大气科学, 29(5): 671–681.
Ma Z G, Huang G, Gan W Q, et al. 2005. Multi-scale temporal characteristics of the dryness/wetness over northern China during the last century[J]. Chinese J Atmos Sci, 29(5): 671–681.
DOI:10.3878/j.issn.1006-9895.2005.05.01 |
|
毛飞, 唐世浩, 孙涵, 等. 2008. 近46年青藏高原干湿气候区动态变化研究[J]. 大气科学, 32(3): 499–507.
Mao F, Tang S H, Sun H, et al. 2008. A study of dynamic change of dry and wet climate regions in the Tibetan plateau over the last 46 years[J]. Chinese J Atmos Sci, 32(3): 499–507.
DOI:10.3878/j.issn.1006-9895.2008.03.07 |
|
钱正安, 宋敏红, 吴统文, 等. 2017a. 世界干旱气候研究动态及进展综述(Ⅰ):若干主要干旱区国家的研究动态及联合国的贡献[J]. 高原气象, 36(6): 1433–1456.
Qian Z A, Song M H, Wu T W, et al. 2017a. Review of advances in world arid climate research (Ⅰ):Development and contribution of some main dryland countries and the UN[J]. Plateau Meteor, 36(6): 1433–1456.
DOI:10.7522/j.issn.1000-0534.2017.00075 |
|
钱正安, 宋敏红, 吴统文, 等. 2017b. 世界干旱气候研究动态及进展综述(Ⅱ):主要研究进展[J]. 高原气象, 36(6): 1457–1476.
Qian Z A, Song M H, Wu T W, et al. 2017b. Review of advances in advances in world dryland climate research (Ⅱ):Main investigation progress[J]. Plateau Meteor, 36(6): 1457–1476.
DOI:10.7522/j.issn.1000-0534.2017.00075 |
|
全国气候与气候变化标准委员会, 2017.GB/T20481-2017气象干旱等级[S].北京: 中华人民共和国国家质量监督检验检疫总局, 中国国家标准化管理委员会.
Climate and Climate Change of Standard Committee, 2017.GB/T20481-2017 classification of meteorological drought[S].Beijing: General Administration of Quality Supervision, Inspection and Quarantine (AQSIQ), Standardization Administration of China (SAC).
|
|
全利红, 胡非, 程雪玲. 2007. 用小波系数谱方法分析湍流湿度脉动的相干结构[J]. 大气科学, 31(1): 57–63.
Quan L H, Hu F, Cheng X L. 2007. Analysing coherent structures of humidity time series by the spectra analysis of the wavelet transform coefficients[J]. Chinese J Atmos Sci, 31(1): 57–63.
|
|
任菊章, 黄中艳, 郑建萌. 2014. 基于相对湿润指数的云南干旱气候变化特征[J]. 中国农业气象, 35(5): 567–574.
Ren J Z, Huang Z Y, Zheng J M. 2014. Analysis on drought climate change in Yunnan based on relative moisture index[J]. Chinese J Agrometeor, 35(5): 567–574.
DOI:10.3969/j.issn.1000-6362.2014.05.014 |
|
荣艳淑, 余锦华, 段丽瑶. 2007. 20世纪80和90年代华北干旱特征成因分析[J]. 高原气象, 26(2): 319–325.
Rong Y S, Yu J H, Duan L Y. 2007. Cause analysis of drought in 1980s and 1990s in twentieth Century in North China[J]. Plateau Meteor, 26(2): 319–325.
DOI:10.3321/j.issn:1000-0534.2007.02.014 |
|
王明田, 王翔, 黄晚华, 等. 2012. 基于相对湿润指数的西南地区季节性干旱时空分布特征[J]. 农业工程学报, 28(19): 85–92.
Wang M T, Wang X, Huang W H, et al. 2012. Temporal and spatial distribution of seasonal drought in Southwest of China based on relative moisture index[J]. Transactions of the Chinese Society of Agricultural Engineering, 28(19): 85–92.
DOI:10.3969/j.issn.1002-6819.2012.19.012 |
|
魏凤英. 2007. 现代气候统计诊断与预测技术[M]. 2版. 北京: 气象出版社, 14-26.
Wei F Y. 2007. Modern climate diagnostic and statistical forecasting techniques[M]. 2nd ed. Beijing: China Meteorological Press, 14-26.
|
|
熊光洁, 王式功, 李崇银, 等. 2014. 三种干旱指数对西南地区适用性分析[J]. 高原气象, 33(3): 686–697.
Xiong G J, Wang S G, Li C Y, et al. 2014. Analysis of applicability of three drought indices for drought evenes in southwest China[J]. Plateau Meteor, 33(3): 686–697.
DOI:10.7522/j.issn.1000-0534.2013.00007 |
|
徐建新, 慎东方, 雷宏军, 等. 2015. 贵州省近60年旱灾损失非一致性频率分析[J]. 干旱区资源与环境, 29(10): 159–164.
Xu J X, Shen D F, Lei H J, et al. 2015. Drought losses for nearly 60 years in Guizhou based on non-uniform frequency analysis[J]. J Arid Land Resour Environ, 29(10): 159–164.
|
|
杨世刚, 杨德保, 赵桂香, 等. 2011. 三种干旱指数在山西省干旱分析中的比较[J]. 高原气象, 30(5): 1406–1414.
Yang S G, Yang D B, Zhao G X, et al. 2011. Comparison of three drought indices in drought of Shanxi Province[J]. Plateau Meteor, 30(5): 1406–1414.
|
|
余卫东, 赵国强, 陈怀亮. 2007. 气候变化对河南省主要农作物生育期的影响[J]. 中国农业气象, 28(1): 9–12.
Yu W D, Zhao G Q, Chen H L. 2007. Impacts of climate change on growing stages of main crops in Henan province[J]. Chinese J Agrometeor, 28(1): 9–12.
DOI:10.3969/j.issn.1000-6362.2007.01.003 |
|
张红丽, 张强, 刘骞, 等. 2016. 中国南方和北方气候干燥程度的变化特征及差异性分析[J]. 高原气象, 35(5): 1339–1351.
Zhang H L, Zhang Q, Liu Q, et al. 2016. Analysis on variation characteristics and differences of the Climate drying degree between South and North of China[J]. Plateau Meteor, 35(5): 1339–1351.
DOI:10.7522/j.issn.1000-0534.2015.00099 |
|
郑建萌, 黄玮, 陈艳, 等. 2017. 云南极端气象干旱指标的研究[J]. 高原气象, 36(4): 1039–1051.
Zheng J M, Huang W, Chen Y, et al. 2017. A study on meteorological extreme-droughe index for Yunnan province[J]. Plateau Meteor, 36(4): 1039–1051.
DOI:10.7522/j.issn.1000-0534.2016.00067 |
2. Meteorological Bureau of Southeast Guizhou, Kaili 556000, Guizhou, China;
3. Guizhou Meteorological Information Centre, Guiyang 550002, Guizhou, china;
4. Yunnan Meteorological Information Centre, Kunming 650034, Yunnan, China
 2018, Vol. 37