作为数值模式的重要组成部分, 边界层过程通过水汽、热量、动量的交换影响大气状态(赵鸣, 2008)。在中尺度数值模式中, 边界层过程由参数化方法描述, 大致可分为局地、非局地两类(杨玉华等, 2016; 李斐等, 2017)。有关边界层方案对暴雨等灾害性天气的影响已有很多研究(Xu et al, 2000; Wisse et al, 2004; 陈炯等, 2006; 蔡芗宁等, 2006, 2007; 肖玉华等, 2010; 徐慧燕等, 2013; 陈杨瑞雪等, 2016; 栾澜等, 2017), 主要集中在江淮梅雨锋暴雨个例和西南低涡暴雨个例上, 并且研究表明选择合适的边界层方案能显著改善降水模拟效果, 但具体选用哪种方案在很大程度上依赖于个例和所用模式。因此, 有必要研究边界层方案在不同类型暴雨中的表现, 以更好认识各方案在不同天气形势下的适应性和差异性。
暖区暴雨的概念由黄士松(1986)针对华南前汛期暴雨首次提出, 目前暖区暴雨的研究已不局限于华南地区, 还扩展到了江淮、华北等地(谌芸等, 2012; 孙军等, 2012; 陈玥等, 2016; 王宝鉴等, 2016)。随着研究的进行, 在搜集到更多暖区暴雨个例的同时, 也逐渐认识到暖区暴雨发生发展的多样性和复杂性(何立富等, 2016)。当前, 针对典型暖区暴雨个例的研究仍主要集中在观测方面(张晓惠等, 2009; 傅朝等, 2015; 卢焕珍等, 2015), 数值模拟研究相对较少, 且已有研究结果表明模式对此类过程的预报能力十分有限(王淑莉等, 2015)。
2016年7月5-6日, 在副热带高压(简称副高)外围暖湿气流影响下, 鄂东发生了一次大范围强降水天气, 其局地性和突发性之强给生命财产带来严重损失。观测资料的分析表明, 该过程发生前无明显冷平流, 属于典型的暖区暴雨; 且依据陈玥等(2016)对长江中下游地区暖区暴雨的分类可知, 此次鄂东暖区暴雨应属于副高边缘型暖区暴雨, 其对流产生条件较为特殊。为此, 本研究使用WRF模式对该个例进行高分辨率模拟, 重点关注不同边界层方案是如何影响对流触发并最终影响地面降水的, 以增加对现有方案局限性的理解, 为将来提升此类暴雨的预报水平指出可能方向。
2 个例简介、模拟试验设计 2.1 个例简介此次鄂东暖区暴雨主要发生在2016年7月5日12:00(世界时, 下同)至6日12:00, 使用两种资料对该个例进行实况分析, 其中, 天气形势分析采用了美国国家环境预报中心NCEP提供的再分析资料, 该资料水平分辨率为1°×1°, 时间分辨率为每6 h一次; 降水实况则采用国家气象信息中心提供的高分辨率降水数据, 水平分辨率为0.1°×0.1°, 时间分辨率为每1 h一次。
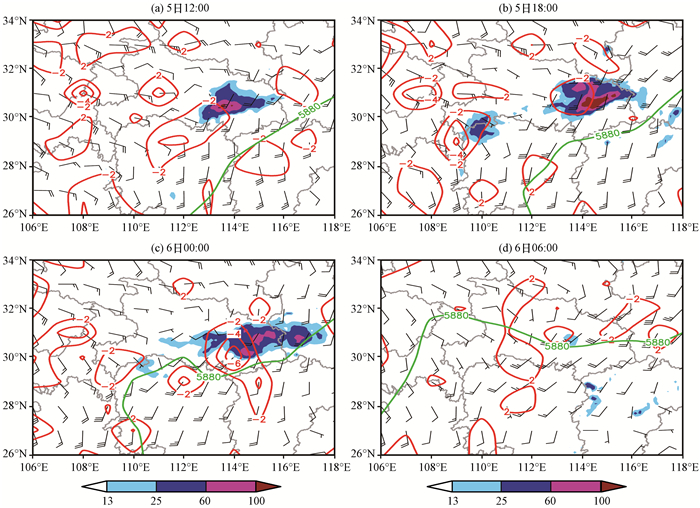
NCEP再分析资料绘制的天气背景结合逐6 h累积降水实况[图 1, 该图及文中所涉及的地图是基于国家测绘地理信息局标准地图服务网站下载的审图号为GS(2016)2892号的中国地图制作, 底图无修改]可见, 暴雨发生时(5日12:00), 低层切变位于湖北中部, 辐合不强, 最大南风风速达12 m·s-1, 位于强降水区以南; 5日18:00, 伴随低空急流加强并北推, 强降水区略向北移动, 且强度增大; 6日00:00之后, 低空急流减弱, 降水随之减弱。
|
图 1 2016年7月56日NCEP再分析资料绘制的850 hPa风场(风羽, 单位: m·s-1)和水汽通量散度(红色等值线, 单位: ×10-7 s-1), 5 880 gpm等高线(绿色等值线)彩色区为起始于该时刻的6 h累积降水实况(单位: mm) Figure 1 The horizontal wind (barb, unit: m·s-1) and moisture flux divergence (red contour, unit: ×10-7 s-1) at 850 hPa, 5 880 gpm isoline (green contour) at different times from NCEP reanalrsis data from 5 to 6 July 2016. The color area is 6-h accumulated precipitation starting at this time (unit: mm) |
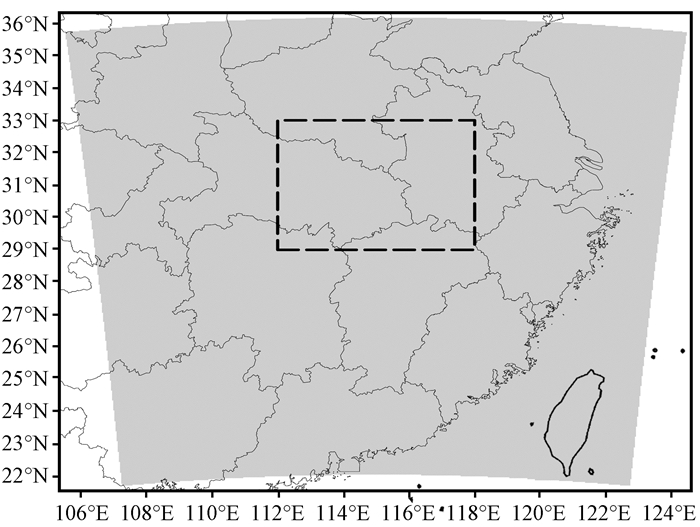
使用WRF-ARW version3.6.1模式(Skamarock et al, 2008)对该过程进行积云可分辨模拟, 水平分辨率为3 km, 格点数为560×530(东西×南北), 垂直方向35层, 模式顶100 hPa。整个模拟区域如图 2所示, 该区域涵盖了我国中东部地区, 图中黑色虚框(112°E118°E, 29°N33°N)代表该个例强降水发生地, 亦为本文计算区域平均降水率的区域。
|
图 2 WRF模拟区域 Figure 2 The domain of WRF model in this study |
除边界层方案外, 模拟时采用的其他物理过程均相同, 包括: RRTM长波辐射方案(Mlawer et al, 1997)、Dudhia短波辐射方案(Dudhia, 1989)、Noah陆面方案(Chen et al, 2001)以及Morrison云微物理方案(Morrison et al, 2005a, 2005b, 2009)。由于模拟时采用了3 km高分辨率, 故未使用积云对流参数化方案。模拟时采用NCEP再分析资料形成初值和边界条件。
做边界层方案敏感试验时, 采用了目前较为流行的3种边界层方案: ACM2方案(Pleim, 2007a, 2007b)、YSU方案(Hong et al, 2006)和MYJ方案(Janjic, 2002)。其中, ACM2和YSU方案都属于非局地方案, 但构建理念有所不同, 前者是显式描述非局地输送, 并加入一个涡流扩散项以更好表征地表附近的局地特点, 后者是在涡流扩散方程中简单加入一个逆梯度项来代表非局地输送; MYJ方案是一个经典的局地方案, 使用Mellor et al(1982)的1.5阶湍流闭合模型来描述湍流。
为合理再现此次暴雨的主要特征, 首先进行了改变起报时刻的试验, 在确定最佳起报时刻后, 再进行边界层方案的敏感试验。最终采用的起报时间为5日18:00(为实况降水发生后6 h), 向前积分至6日12:00, 逐时输出模拟结果。
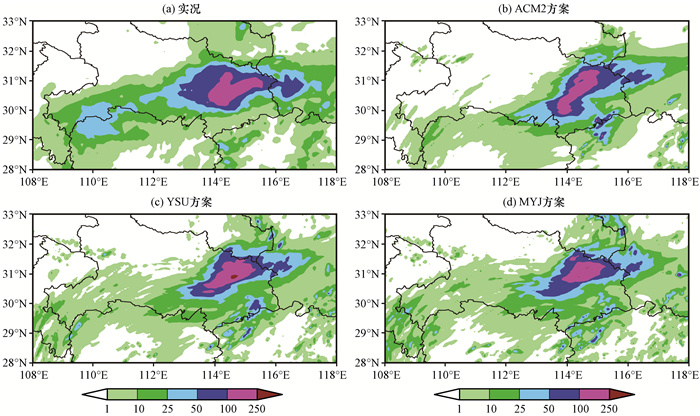
3 降水检验 3.1 总降水时空分布通过2016年7月5日18:00至6日12:00的18 h累积降水分布(图 3)可以看出, 实况降水主要分布在鄂西南-鄂东北一带, 强降水中心位于鄂东, 量值超过100 mm; 使用不同边界层方案完成的模拟试验均能较好地再现鄂东的强降水特征, 且不同方案间的差异并不明显, 尤其是YSU和MYJ方案的18 h累积降水较接近, ACM2方案与这两者还略有不同。
|
图 3 2016年7月5日18:00至6日12:00的18 h累积降水量(单位: mm) Figure 3 18 h accumulated precipitation from observation and simulations from 18:00 on 5 to 12:00 on 6 July 2016. Unit: mm |
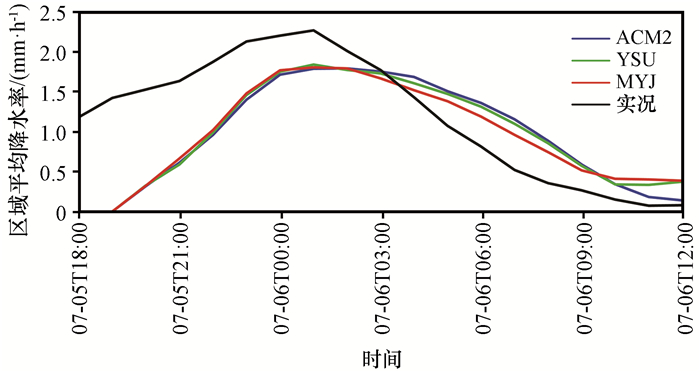
由(112°E118°E, 29°N33°N)区域平均的逐时降水率(图 4)可见, 实况和模拟降水曲线都是先增加后减小, 且达到峰值的时间基本相同, 但在峰值大小和变化快慢上仍有差异, 主要表现为实况峰值较模拟偏大, 且达到峰值后更快减弱。需要指出的是, 在降水曲线上升期, 模拟与实况也存在差异, 但主要归因于模式启动时间(5日18:00)滞后于实况降水的发生时间(5日12:00)。此外, 不同方案下降水曲线的差异不大, 仅在降水减弱期ACM2方案的降水略多于YSU和MYJ。
|
图 4 实况和ACM2、YSU、MYJ方案模拟的区域平均的逐时降水率 Figure 4 Hourly precipitation rate averaged within the area from observation and simulations of ACM2, YSU, MYJ |
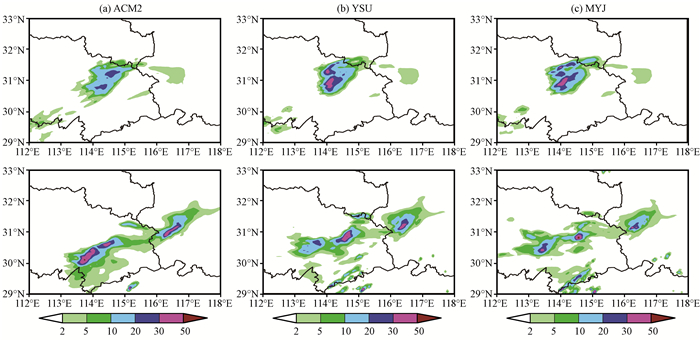
尽管不同方案下18 h累积降水分布、区域平均逐时降水演变差异不大, 但注意到逐时累积降水中短时强降水(≥20 mm·h-1)分布在不同方案下有较大差异(图 5), 如: 5日21:0022:00, YSU和MYJ方案下短时强降水较ACM2明显偏强; 6日04:0005:00情形相反。故分别针对强、弱降水进行检验。
|
图 5 ACM2(a)、YSU(b)、MYJ(c)方案模拟的2016年7月5日21:00-22:00(上)和6日04:00-05:00(下)1 h累积降水量(单位: mm) Figure 5 1 h accumulated precipitation from simulations ACM2(a), YSU(b), MYJ(c) from 21:00 to 22:00 on 5(up) and from 04:00 to 05:00 on 6(down) July 2016. Unit: mm |
规定逐时累积降水中≥20 mm·h-1为强降水, 其余则为弱降水, 从强、弱降水区域平均的逐时变化(图 6)可以看出, 强降水的模拟对边界层方案敏感, 6日03:00之前, YSU和MYJ方案模拟的强降水大于ACM2, 03:00以后情形相反; 与之相比, 弱降水的模拟对边界层方案敏感度较小。

|
图 6 ACM2、YSU和MYJ方案模拟的强(a)弱(b)降水区域平均的逐时降水率 Figure 6 Hourly precipitation rate averaged within the area from simulations of ACM2, YSU and MYJ in strong (a) and weak (b) precipitation area |
下面主要考察不同边界层方案造成短时强降水差异的可能原因, 分为边界层方案影响强对流触发、边界层方案对中尺度环境的作用以及不同边界层方案下的云微物理特征等三部分。考虑到该个例的模拟中YSU和MYJ方案的表现很相像, 故为简化起见, 下文只给出YSU和ACM2方案的对比结果。
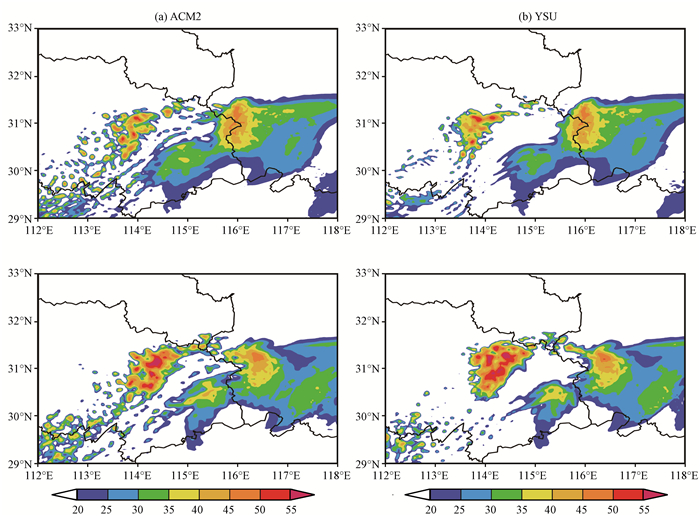
4.1 边界层方案影响强对流触发从强对流触发前最大反射率的变化(图 7)可以看出, 在7月5日20:00, 不同方案下的最大反射率分布差异不大; 1 h之后, YSU方案下最大反射率的强中心范围和量值均大于ACM2, 表明此时该方案的对流更强。
|
图 7 ACM2(a)、YSU(b)方案模拟的2016年7月5日20:00(上)和21:00(下)最大反射率(单位: dBZ) Figure 7 The maximum reflectivity from simulations ACM2 (a), YSU (b) at 20:00 (up) and 21:00 (down) on 5 July 2016. Unit: dBZ |
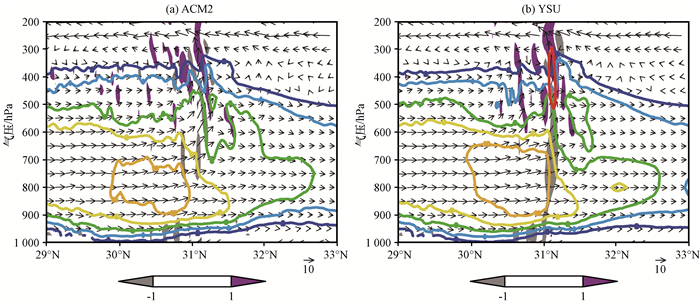
YSU方案下强对流的提前触发与低层流场有关。通过强对流触发前(5日20:00)流场的垂直剖面(为113.5°E114.5°E的平均结果)(图 8)可以看出, 该个例中对流的触发主要由低层南风风速辐合引起, 但不同方案下南风风速有差异, 且700 hPa附近差异尤为明显。具体地, YSU方案模拟的低层南风在31°N以南较ACM2偏强, 在31°N以北则稍弱, 造成该方案低层辐合(图中灰色阴影)明显偏强, 进而更易触发强对流(图中垂直上升速度大于1 m·s-1的区域)。
|
图 8 ACM2(a)、YSU(b)方案模拟的2016年7月5日20:00散度(阴影, 单位: ×10-4 s-1), 风矢量(V; 20×W), V风速(等值线, 间隔2 m·s-1)以及>1 m·s-1的垂直上升速度(红色实线)的纬向平均(113.5°E-114.5°E)的垂直剖面 Figure 8 Vertical cross sections of averaged between 113.5°E and 114.5°E of divergence (the shaded, unit: ×10-4 s-1), wind vectors (V; 20×W), V-wind speed (contours, 2 m·s-1 increment), and vertical velocity exceeding 1 m·s-1 (red contour) from simulations ACM2 (a), YSU (b) at 20:00 on 5 July 2016 |
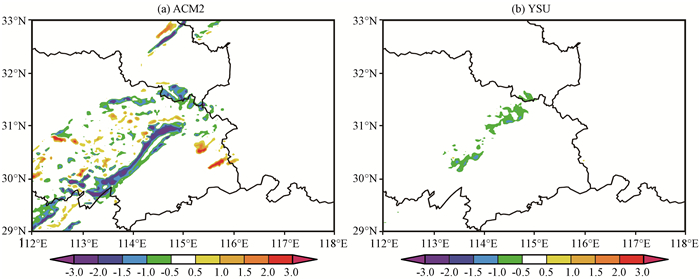
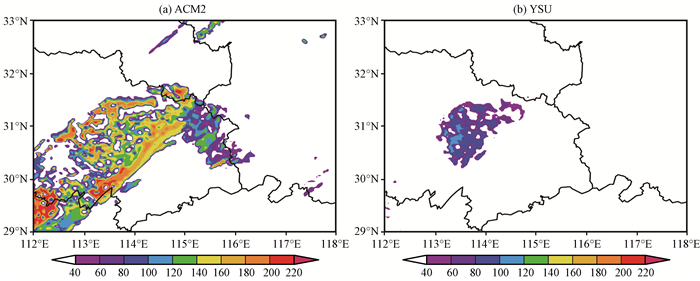
为更好理解不同方案下南风风速的差异, 通过由模式直接输出的边界层过程对经向风倾向
|
图 9 ACM2(a)、YSU(b)方案模拟的2016年7月5日20:00 700 hPa V风倾向(单位: m·s-1·h-1) Figure 9 V-wind tendency at 700 hPa from simulations ACM2 (a) and YSU (b) at 20:00 on 5 July 2016. Unit: m·s-1·h-1 |
|
图 10 ACM2(a)、YSU(b)方案模拟的2016年7月5日20:00 700 hPa涡流扩散系数(单位: m2·s-1) Figure 10 Eddy diffusivity coefficient at 700 hPa from simulations ACM2 (a) and YSU (b) at 20:00 on 5 July 2016. Unit: m2·s-1 |
综上, 对于该个例, 边界层方案影响强对流触发的主要途径是不同方案的涡流扩散性差异造成了边界层倾向差异, 从而引起低层流场差异, 并影响强对流触发。具体到不同方案, 在强对流触发前, YSU和MYJ方案模拟的涡流扩散性系数较ACM2偏小, 边界层V风倾向偏弱, 从而低层南风减速不明显, 使得南风辐合偏强, 提前触发强对流。
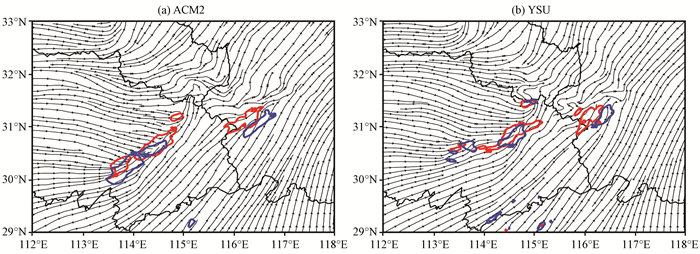
4.2 边界层方案对中尺度环境的作用强对流触发后, 很快发展成熟, 其后便进入消散阶段。在消散阶段, YSU和MYJ方案的强对流能很快消散, 但ACM2方案模拟的强对流似乎维持了更长时间。细致分析后发现, ACM2方案中并不是已有对流维持的时间更长, 而是在低层切变线上有对流新生(图 11)。
|
图 11 ACM2(a)、YSU(b)方案模拟的2016年7月6日04:00 700 hPa风场(流线) 红色、蓝色等值线分别代表终止于该时刻和下一时刻的1 h累积降水≥20 mm的区域 Figure 11 Horizontal wind (stream line) at 700 hPa from simulations ACM2 (a) and YSU (b) at 04:00 on 6 July 2016. Red and blue contours represent 1 h accumulated precipitation exceeding 20 mm valid at this time and next time, respectively |
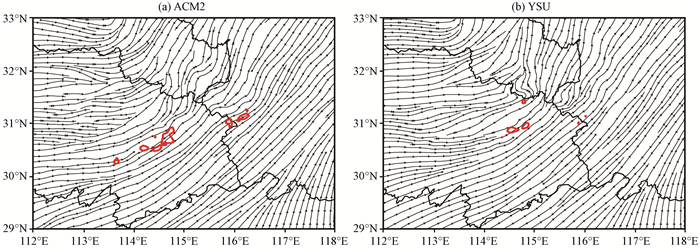
至于为何在消散阶段ACM2方案的低层切变线较其他两种方案更为明显, 则可能与不同方案下强降水对低层流场的调整作用不同有关。为证实该推测, 完成了一组对比试验:该试验除了从强对流消散时(6日03:00)关闭微物理潜热加热外, 所有设置均与原先试验相同。图 12给出了对比试验结果。从图 12中可以看出, 关闭潜热加热后仅1 h, 低层切变线消失, 强对流基本消散殆尽, 且在不同边界层方案下均是如此, 表明与强降水相伴的微物理潜热加热对中尺度环境场的改变作用是巨大的, 边界层过程的作用相对较小。由此可见, 对流的整个生命史是相当复杂的, 涉及到多个物理过程的相互作用及其对环境场的反馈。
|
图 12 关闭潜热加热后ACM2(a)、YSU(b)方案模拟的2016年7月6日04:00 700 hPa风场(流线) 红色、蓝色等值线分别代表终止于该时刻和下一时刻的1 h累积降水≥20 mm的区域 Figure 12 Horizontal wind (stream line) at 700 hPa from simulations ACM2 (a) and YSU (b) conducted with latent heating from the microphysical process turned off at 04:00 on 6 July 2016. Red and blue contours represent 1-h accumulated precipitation exceeding 20 mm valid at this time and next time, respectively |
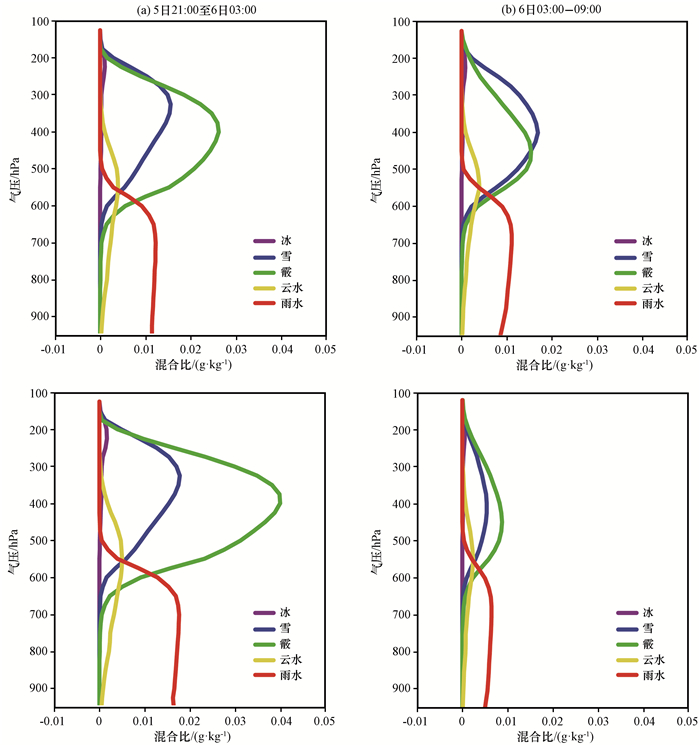
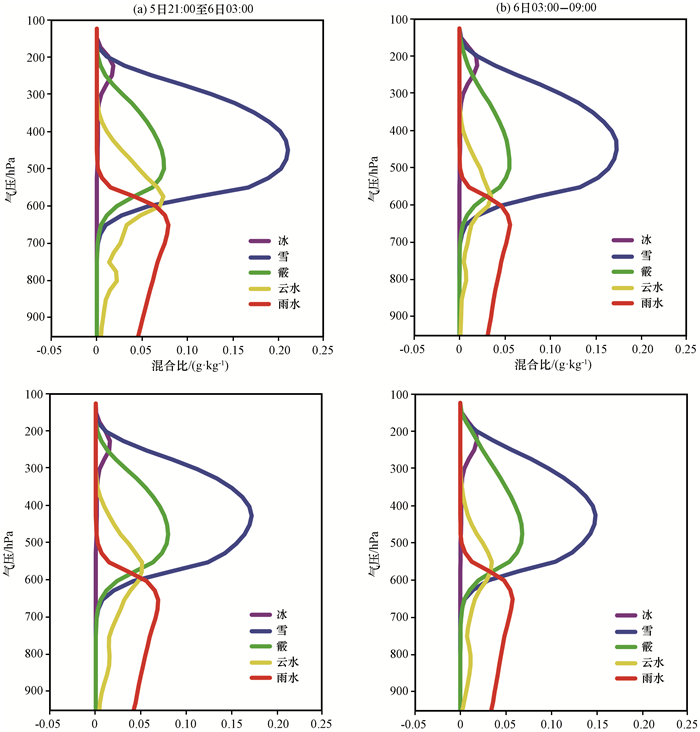
边界层过程对模拟降水的影响是通过云微物理过程来实现的, 为此, 需要考察不同边界层方案下的云微物理特征。首先, 根据强降水的演变特征[图 6(a)]划分不同的降水阶段, 5日21:00至6日03:00为降水发展阶段, 6日03:00-09:00为降水消亡阶段。图 13和图 14分别给出了强、弱降水中不同方案模拟的各类水凝物(冰、雪、霰、云水和雨水)含量在各阶段的平均垂直廓线。
|
图 13 强降水中ACM2(上)、YSU(下)方案模拟的2016年7月5-6日不同阶段各类水凝物含量的垂直廓线 Figure 13 Vertical profiles of temporally-and area-averaged hydrometeor mixing ratios in the strong precipitation region from simulations ACM2 (up) and YSU (down) during 56 July 2016 |
|
图 14 弱降水中ACM2(上)、YSU(下)方案模拟的2016年7月5-6日不同阶段各类水凝物含量的垂直廓线 Figure 14 Vertical profiles of temporally-and area-averaged hydrometeor mixing ratios in the weak precipitation region from simulations ACM2(a) and YSU(b) from 5 to 6 July 2016 |
由图 13可见, 在强降水中, ACM2方案在发展阶段霰含量最多(最大值位于400 hPa附近), 其次是雪和雨, 然后是云水, 冰含量最少; 在消亡阶段, 霰含量明显减小(最大值所在高度稍降低), 雪含量略有增加(最大值高度也降低), 近地面雨水含量略有减小, 云水和冰含量基本未变。与ACM2方案相比, 在发展阶段YSU方案中霰含量显著偏多、雪含量基本相当, 表明霰的融化对雨水形成的贡献更大, 冷云降水过程更强, 对应于近地面雨水含量更大; 在消亡阶段YSU方案中的霰和雪均明显小于ACM2, 故冷云降水更弱, 近地面雨水含量更小。
在弱降水中(图 14), ACM2方案在发展阶段雪含量最多, 其次是霰和雨, 然后是云水, 冰含量最少; 在消亡阶段, 各类水凝物含量均略有减小, 但按含量高低排序仍与发展阶段一致。不同阶段YSU方案的各类水凝物分布特征也与ACM2相似。因此, 不同方案下弱降水差异较小。
综合上述, 在不同降水中, 冷云降水过程均起主导作用, 但与弱降水中雪的融化过程起主导作用不同, 强降水中霰的融化过程对雨水形成的贡献更大, 造成冷云降水更强。具体到不同方案, YSU和MYJ方案的霰含量较ACM2表现出先多后少的特点, 对应于这两种方案下短时强降水的先强后弱[图 6(a)]。
5 结论针对2016年7月56日发生在鄂东的一次典型副高边缘型暖区暴雨过程, 使用WRF模式的3种边界层方案(ACM2、YSU、MYJ)完成积云可分辨模拟, 重点考察不同边界层方案下短时强降水的差异及其可能原因。得到以下主要结论:
(1) 短时强降水的模拟对边界层方案更敏感(对比弱降水和总降水)。相比ACM2方案, YSU和MYJ方案的短时强降水在降水发展(消亡)阶段偏强(偏弱);
(2) 从云微物理特征看, 短时强降水的形成与霰的融化主导冷云降水过程有关。相比ACM2方案, YSU和MYJ方案下短时强降水的先强后弱对应于冰相水凝物(尤其是霰)的先多后少;
(3) 边界层方案主要通过影响强对流触发造成短时强降水差异。在对流触发前, YSU和MYJ方案模拟的涡流扩散性系数较ACM2偏小, 边界层V风倾向偏弱, 从而低层南风减速不明显, 使得南风辐合偏强并提前触发强对流, 造成发展阶段短时强降水偏强; 而消亡阶段短时强降水的差异主要由前期强降水对低层流场的调整引起, 边界层过程的作用相对较小。
需要注意的是, 上述结论是针对发生在鄂东的一次典型副高边缘型暖区暴雨个例得到的, 至于这些结论是否适用于该地区其他类型的暖区暴雨过程(如:冷锋型、暖切变型)则有待另行研究。另外, 我们注意到, 该个例中强对流发生时CAPE不大(仅350 J·kg-1左右), 但降水强度却很大, 表明降水效率很高, 其中原因有待进一步研究。
Chen F, Dudhia J. 2001. Coupling an advanced landsurface-hydrology model with the Penn State-NCAR MM5 modeling system. Part Ⅰ:Model implementation and sensitivity[J]. Mon Wea Rev, 129(4): 569–585.
DOI:10.1175/1520-0493(2001)129<0569:CAALSH>2.0.CO;2 |
|
Dudhia J. 1989. Numerical study of convection observed during the winter monsoon experiment using a mesoscale two-dimensional model[J]. J Atmos Sci, 46(20): 3077–3107.
DOI:10.1175/1520-0469(1989)046<3077:NSOCOD>2.0.CO;2 |
|
Hong S Y, Noh Y, Dudhia J. 2006. A new vertical diffusion package with an explicit treatment of entrainment process[J]. Mon Wea Rev, 134(9): 2318–2341.
DOI:10.1175/MWR3199.1 |
|
Janjic Z I. 2002. Nonsingular implementation of the Mellor-Yamada level 2.5 scheme in the NCEP Meso model[Z]. NCEP Office Note, No. 437, 61.
|
|
Mellor G L, Yamada T. 1982. Development of a turbulence closure model for geophysical fluid problems[J]. Rev Geophys, 20(4): 851–875.
DOI:10.1029/RG020i004p00851 |
|
Mlawer E J, Taubman S J, Brown P D, et al. 1997. Radiative transfer for inhomogeneous atmosphere:RRTM, a validated correlated-k model for the longwave[J]. J Geophys Res, 102(D14): 16663–16682.
DOI:10.1029/97JD00237 |
|
Morrison H, Curry J A, Khvorostyanov V I. 2005a. A new double-moment microphysics parameterization for application in cloud and climate models. Part Ⅰ:Description[J]. J Atmos Sci, 62(6): 1665–1677.
DOI:10.1175/JAS3446.1 |
|
Morrison H, Curry J A, Shupe M D, et al. 2005b. A new double-moment microphysics parameterization for application in cloud and climate models. Part Ⅱ:Single-column modeling of Arctic clouds[J]. J Atmos Sci, 62(6): 1678–1693.
DOI:10.1175/JAS3447.1 |
|
Morrison H, Thompson G, Tatarskii V. 2009. Impact of cloud microphysics on the development of trailing stratiform precipitation in a simulated squall line:Comparison of one-and two-moment schemes[J]. Mon Wea Rev, 137(3): 991–1007.
DOI:10.1175/2008MWR2556.1 |
|
Pleim J E. 2007a. A combined local and non-local closure model for the atmospheric boundary layer. Part Ⅰ:Model description and testing[J]. J Appl Meteor Climatol, 46(9): 1383–1395.
DOI:10.1175/JAM2539.1 |
|
Pleim J E. 2007b. A combined local and non-local closure model for the atmospheric boundary layer. Part Ⅱ:Application and evaluation in a mesoscale meteorological model[J]. J Appl Meteor Climatol, 46(9): 1396–1409.
DOI:10.1175/JAM2534.1 |
|
Skamarock W C, Klemp J B, Dudhia J, et al, 2008. A description of the Advanced Research WRF version 3[Z]. NCAR Tech. Note NCAR/TN4755TR. 113.
|
|
Wisse J S P, Vila-Guerau de A J. 2004. Analysis of the role of the planetary boundary layer schemes during a severe convective storm[J]. Annales Geophysicae, 22(6): 1861–1874.
DOI:10.5194/angeo-22-1861-2004 |
|
Xu L R, Zhao M. 2000. The influence of boundary layer parameterization schemes on mesoscale heavy rain system[J]. Adv Atmos Sci, 17(3): 458–472.
DOI:10.1007/s00376-000-0036-3 |
|
蔡芗宁, 寿绍文, 钟青. 2006. 边界层参数化方案对暴雨数值模拟的影响[J]. 南京气象学院学报, 29(3): 364–370.
Cai X N, Shou S W, Zhong Q. 2006. Impact of different boundary layer parameterization schemes on the numerical simulation for a rainstorm[J]. Journal of Nanjing Institute of Meteorology, 29(3): 364–370.
DOI:10.3969/j.issn.1674-7097.2006.03.012 |
|
蔡芗宁, 周庆亮, 钟青, 等. 2007. 边界层参数化对"雅安天漏"降水数值模拟的影响[J]. 气象, 33(5): 12–19.
Cai X N, Zhou Q L, Zhong Q, et al. 2007. Impact of boundary layer parameterization on numerical simulation of "Ya-An-Tian-Lou"[J]. Meteor Mon, 33(5): 12–19.
DOI:10.3969/j.issn.1000-0526.2007.05.002 |
|
陈炯, 王建捷. 2006. 边界层参数化方案对降水预报的影响[J]. 应用气象学报, 17(suppl1): 11–17.
Chen J, Wang J J. 2006. Mesoscale precipitation simulation sensitivity to PBL parameterization[J]. Quart J Appl Meteor, 17(suppl1): 11–17.
|
|
陈杨瑞雪, 罗亚丽. 2016. 不同边界层参数化方案和陆面过程参数化方案对一次梅雨锋暴雨显式对流模拟的影响分析[J]. 热带气象学报, 32(5): 656–667.
Chenyang R X, Luo Y L. 2016. Analysis of the influence of different parameterization schemes representing the planetary boundary layer and land surface processes on convection-permitting simulations of a heavy rainfall event along Mei-yu front[J]. J Trop Meteor, 32(5): 656–667.
|
|
陈玥, 谌芸, 陈涛, 等. 2016. 长江中下游地区暖区暴雨特征分析[J]. 气象, 42(6): 724–731.
Chen Y, Chen Y, Chen T, et al. 2016. Characteristics analysis of warim-sector rainstorm over the middle-lower reaches of the Yangtze river[J]. Meteor Mon, 42(6): 724–731.
|
|
谌芸, 孙军, 徐珺, 等. 2012. 北京721特大暴雨极端性分析及思考(一)观测分析及思考[J]. 气象, 38(10): 1255–1266.
Chen Y, Sun J, Xu J, et al. 2012. Analysis and thinking on the extremes of the 21 July 2012 torrential rain in Beijing. Part Ⅰ:Observation and thinking[J]. Meteor Mon, 38(10): 1255–1266.
DOI:10.7519/j.issn.1000-0526.2012.10.012 |
|
傅朝, 杨晓军, 周晓军, 等. 2015. 2013年6月19-20日甘肃陇东南暖区暴雨多普勒雷达特征分析[J]. 气象, 41(9): 1095–1103.
Fu Z, Yang X J, Zhou X J, et al. 2015. Analysis on Doppler radar characteristics of warm area rainstorm in southeastern Gansu during 19-20 June 2013[J]. Meteor Mon, 41(9): 1095–1103.
|
|
何立富, 陈涛, 孔期. 2016. 华南暖区暴雨研究进展[J]. 应用气象学报, 27(5): 559–569.
He L F, Chen T, Kong Q. 2016. A review of studies on prefrontal torrential rain in south China[J]. J Appl Meteor Sci, 27(5): 559–569.
|
|
黄士松. 1986. 华南前汛期暴雨[M]. 广州: 广东科技出版社.
Huang S S. 1986. The early summer flood periods of southern China[M]. Guangzhou: Guangdong Science and Technology Press.
|
|
李斐, 邹捍, 周立波, 等. 2017. WRF模式中边界层参数化方案在藏东南复杂下垫面适用性研究[J]. 高原气象, 36(2): 340–357.
Li F, Zou H, Zhou L B, et al. 2017. Study of boundary layer parameterization schemes' applicability of WRF Model over complex underlying surfaces in Southeast Tibet[J]. Plateau Meteor, 36(2): 340–357.
DOI:10.7522/j.issn.1000-0534.2016.00041 |
|
卢焕珍, 张楠, 刘一玮. 2015. 天津一次局地大暴雨中尺度对流系统组织化特征与成因[J]. 暴雨灾害, 34(1): 17–26.
Lu H Z, Zhang N, Liu Y W. 2015. Organization characteristic and causal analysis of meso-scale convective system of locally torrential rain in Tianjin[J]. Torrential Rain Disasters, 34(1): 17–26.
DOI:10.3969/j.issn.1004-9045.2015.01.003 |
|
栾澜, 孟宪红, 吕世华, 等. 2017. 青藏高原一次对流降水模拟中边界层参数化和云微物理的影响研究[J]. 高原气象, 36(2): 283–293.
Luan L, Meng X H, Lü S H, et al. 2017. Impacts of microphysics and PBL physics parameterization on a convective precipitation over the Qinghai-Tibetan Plateau[J]. Plateau Meteor, 36(2): 283–293.
DOI:10.7522/j.issn.1000-0534.2016.00086 |
|
孙军, 谌芸, 杨舒楠, 等. 2012. 北京721特大暴雨极端性分析及思考(二)极端性降水成因初探及思考[J]. 气象, 38(10): 1267–1277.
Sun J, Chen Y, Yang S N, et al. 2012. Analysis and thinking on the extremes of the 21 July 2012 torrential rain in Beijing. Part Ⅱ:preliminary causation analysis and thinking[J]. Meteor Mon, 38(10): 1267–1277.
DOI:10.7519/j.issn.1000-0526.2012.10.013 |
|
王宝鉴, 孔祥伟, 傅朝, 等. 2016. 甘肃陇东南一次大暴雨的中尺度特征分析[J]. 高原气象, 35(6): 1551–1564.
Wang B J, Kong X W, Fu Z, et al. 2016. Analysis on mesoscale characteristics of a rainstorm process in southeastern Gansu[J]. Plateau Meteor, 35(6): 1551–1564.
DOI:10.7522/j.issn.1000-0534.2015.00114 |
|
王淑莉, 康红文, 谷湘潜, 等. 2015. 北京7·21暴雨暖区中尺度对流系统的数值模拟[J]. 气象, 41(5): 544–553.
Wang S L, Kang H W, Gu X Q, et al. 2015. Numerical simulation of mesoscale convective system in the warm sector of Beijing "7.21" severe rainstorm[J]. Meteor Mon, 41(5): 544–553.
DOI:10.3969/j.issn.1000-6362.2015.05.003 |
|
肖玉华, 何光碧, 顾清源, 等. 2010. 边界层参数化方案对不同性质降水模拟的影响[J]. 高原气象, 29(2): 331–339.
Xiao Y H, He G B, Gu Q Y, et al. 2010. Impact of boundary layer parameterization schemes on numerical simulation of different property precipitation[J]. Plateau Meteor, 29(2): 331–339.
|
|
徐慧燕, 朱业, 刘瑞, 等. 2013. 长江下游地区不同边界层参数化方案的试验研究[J]. 大气科学, 37(1): 149–159.
Xu H Y, Zhu Y, Liu R, et al. 2013. Simulation experiments with different planetary boundary layer schemes in the lower reaches of the Yangtze River[J]. Chinese J Atmos Sci, 37(1): 149–159.
|
|
杨玉华, 刘长海, DudhiaJ, 等. 2016. 基于大涡模拟对两类典型边界层参数化方案的评估分析[J]. 高原气象, 35(1): 172–180.
Yang Y H, Liu C H, Dudhia J, et al. 2016. Evaluation of two typical PBL parameterization schemes based on large-eddy simulation result[J]. Plateau Meteor, 35(1): 172–180.
DOI:10.7522/j.issn.1000-0534.2014.00138 |
|
张晓惠, 倪允琪. 2009. 华南前汛期锋面对流系统与暖区对流系统的个例分析与对比研究[J]. 气象学报, 67(1): 108–121.
Zhang X H, Ni Y Q. 2009. A comparative study of a frontal and a non-frontal convective system[J]. Acta Meteor Sinica, 67(1): 108–121.
|
|
赵鸣. 2008. 边界层和陆面过程对中国暴雨影响研究的进展[J]. 暴雨灾害, 27(2): 186–190.
Zhao M. 2008. A review of the research on the effects of boundary layer and land surface process on heavy rain in China[J]. Torrential Rain Disasters, 27(2): 186–190.
DOI:10.3969/j.issn.1004-9045.2008.02.016 |
 2018, Vol. 37