2. 中国科学院大学, 北京 100049;
3. 清华大学地球系统科学系, 北京 100084;
4. 水沙科学与水利水电工程国家重点实验室, 清华大学水利水电工程系, 北京 100084
降水作为影响陆面过程的最重要变量之一, 是水文、生态和陆面模型的主要输入, 其不确定性是模型误差的主要来源(Tong et al, 2014; Zhang et al, 2015)。由美国国家气候数据中心(NCDC)研发了全球历史气候数据集(Global Historical Climatology Network, GHCN)(Peterson et al, 1997), 其收录站点数量近100年来快速增长, 1970—1990年达到稳定水平, 1990年后又迅速下降(杨溯等, 2016)。中国的许多降水台站并不收录在GHCN中, 中国气象局(China Meteorological Administration, CMA)管理的国家级气象站主要建于1950年以后, 之后10年间台站数量迅速增加, 1960年达到约2 000个站, 之后保持在相对稳定的2 200~2 400个(Shen et al, 2016; 王丹等, 2017), 此外还建立了大量的区域气象站和降水站。
青藏高原作为一个特殊的地理单元, 由于海拔高, 地形复杂, 气候环境恶劣, 一直是我国气象台站分布最稀疏的地区。即使如此, 这些站点资料仍然是理解近几十年青藏高原气候变化的主要依据。由于建站时间不一, 这些站点数据的时间长度不一致。此外, 由于维护困难, 操作失误, 站点移除和站点类型变换等, 往往造成数据缺失(Xie et al, 2011)。这种时间序列的不一致性和不连续性给区域气候和水文变化研究带来许多困难(Villarini et al, 2008)。例如, 站点降水资料的空间插值通常用于获取区域降水信息, 但在站点分布稀疏的区域, 插值降水精度严重受制于台站数量多少和位置分布的合理性。一般地, 站点数量越多, 分布越合理, 代表性越强, 区域降水插值的不确定性就越小(李妮娜等, 2017; 朱会义等, 2004; Girons et al, 2015)。高原大多数台站距离超过100 km(赵煜飞等, 2014), 如果由于数据缺失问题而去除台站, 将放大降水插值的不确定性。因此, 构建青藏高原完整时间序列的站点降水数据对水文气候研究具有非常重要的意义。
以中国气象局(CMA)台站资料为基础, 将一个贝叶斯线性回归升尺度方法应用于站点插值, 建立缺失数据站点降水与其邻近台站降水之间的关系, 从而插补和延长青藏高原中、东部地区缺失数据台站的时间序列。
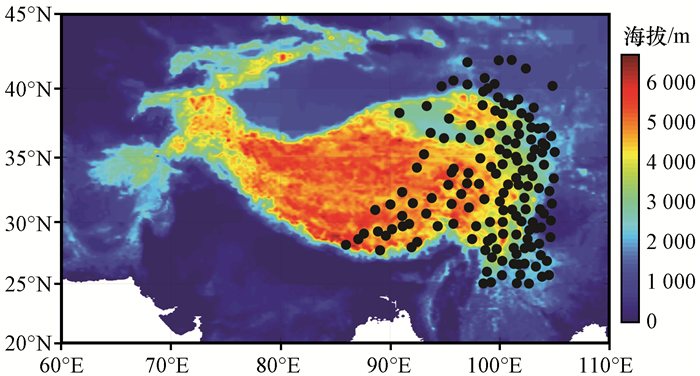
2 研究资料与方法介绍 2.1 研究资料选取青藏高原中、东部148个中国气象局台站(图 1)。即使在1979—2015年降水观测比较完整的时间段内, 不少台站的月降水时间序列也不完整。图 2显示了该地区每年有可用月降水数据的台站数量。1979—2015年间, 可用台站数量由146个减少到130个, 主要是由于某些台站的停用和台站类型变化(例如从国家台站到区域台站的类型变化使得数据不再公开)。2007—2008年则有部分台站月降水资料重新可获取。
|
图 1 青藏高原地形(彩色区, 单位: m)及其中、东部148个气象台站的分布(黑点) Fig. 1 The topography (color area, unit: m) of the Qinghai-Tibetan Plateau and the distribution of 148 CMA weather stations (black dots) in the central and eastern Qinghai-Tibetan Plateau |

|
图 2 1979-2015年青藏高原中、东部气象台站数量变化 Fig. 2 The variation of station number during 1979-2015 in the central and eastern of the Qinghai-Tibetan Plateau |
根据月降水资料缺失的情况, 将台站分为六大类。表 1列出了每一类站点的数据缺测程度。第1类表示具有完整的时间序列的台站, 共有29个。其他类则是由于气象台的停用、操作失误、建立时间不同以及数据公开情况的变化等因素, 具有不同程度的数据缺失。对第2~6类台站的时间序列进行插补和延长。对第5、6类台站, 如果未来公开观测数据, 则可替换构建数据。
| 表 1 根据青藏高原中、东部月降水量数据缺失情况定义的台站类别和数量 Table 1 Station category definition and station number according to the situation of missing data of monthly precipitation in the central and eastern Qinghai-Tibetan Plateau |
假定一个台站的降水与其邻近台站的降水分布有关。以其作为先验知识, 降水时间序列的缺失部分可以通过相邻台站的数据进行插补和延长。这种关系可以用Qin et al(2013)提出的升尺度理论在数学上的表达式:
| $ \overline p _t^{{\rm{ups}}} = f\left({\mathit{\boldsymbol{p}}_t^{{\rm{obs}}}} \right), $ | (1) |
与
| $ \mathit{\boldsymbol{p}}_t^{{\rm{obs}}} = {\left[ {1, p_{t, 1}^{{\rm{obs}}}, p_{t, 2}^{{\rm{obs}}}, \cdots, p_{t, N}^{{\rm{obs}}}} \right]^{\rm{T}}}, $ | (2) |
式中: ptups代表升尺度降水量(单位: mm); pt, iobs是该地区第i个邻近台站的观测月降水量(单位: mm); f(·)为升尺度函数; N是台站数量; t代表月份。
当升尺度方法应用于降水插值时, ptups可以被替换为代表缺失数据站点的月降水量pt。通过使用贝叶斯线性回归理论来建立贝叶斯估计模型, 建立缺失数据台站与邻近台站关系, 确定每个邻近台站的权重(Lu et al, 2015)。插值使用的相邻台站指位于以缺失数据台站为中心的5°×5°区域内的台站。具体地, 函数f(·)假定为线性形式:
| $ {p_t} = {\mathit{\boldsymbol{\beta }}^{\rm{T}}}\mathit{\boldsymbol{p}}_t^{{\rm{obs, vic}}}, $ | (3) |
式中: β指组合系数向量; ptobs, vic为相邻台站的月降水量。
通常, 系数β可以利用普通最小二乘法(the ordinary least-squares, OLS)通过最小化下列代价函数来确定:
| $ \mathit{\boldsymbol{J}} = \sum\limits_{t = 1}^M {{{\left({p_t^{{\rm{obs}}} - {\mathit{\boldsymbol{\beta }}^{\rm{T}}}\mathit{\boldsymbol{p}}_t^{{\rm{obs, vic}}}} \right)}^2}, } $ | (4) |
式中: M是有缺失数据的站点的可用数据月份, ptobs为缺失数据台站可用的观测值。
普通最小二乘法往往会存在过度拟合的问题, 使用代价函数如下:
| $ \begin{array}{l} \mathit{\boldsymbol{J}} = \sum\limits_{t = 1}^M {\left({p_t^{{\rm{obs}}} - {\mathit{\boldsymbol{\beta }}^{\rm{T}}}\mathit{\boldsymbol{p}}_t^{{\rm{obs, vic}}}} \right){\sigma ^{ - 2}}\left({p_t^{{\rm{obs}}} - {\mathit{\boldsymbol{\beta }}^{\rm{T}}}\mathit{\boldsymbol{p}}_t^{{\rm{obs, vic}}}} \right)} \\ \;\;\;\;\;\; + \alpha {\mathit{\boldsymbol{\beta }}^{\rm{T}}}\mathit{\boldsymbol{\beta }}, \end{array} $ | (5) |
式中:右边的第二项αβTβ是用来避免过度拟合的正则化项; σ表示ptobs的标准偏差; α是避免过度拟合的正则化参数。确定β的最优值的详细方法见Qin et al(2013)。β的最优值可表示为:
| $ \mathit{\boldsymbol{\hat \beta }} = {\sigma ^{ - 2}}\mathit{\boldsymbol{S}} \cdot {\left({{\mathit{\boldsymbol{P}}^{{\rm{obs, vic}}}}} \right)^{\rm{T}}}{\mathit{\boldsymbol{p}}^{{\rm{obs}}}}, $ | (6) |
式中:
| $ {\mathit{\boldsymbol{p}}^{{\rm{obs}}}} = {\left[ {p_1^{{\rm{obs}}}, p_2^{{\rm{obs}}}, \cdots, p_M^{{\rm{obs}}}} \right]^{\rm{T}}}, $ | (7) |
| $ {\mathit{\boldsymbol{P}}^{{\rm{obs, vic}}}} = {\left[ {\mathit{\boldsymbol{p}}_1^{{\rm{obs, vic}}}, \mathit{\boldsymbol{p}}_2^{{\rm{obs, vic}}}, \cdots, \mathit{\boldsymbol{p}}_M^{{\rm{obs, vic}}}} \right]^{\rm{T}}}, $ | (8) |
| $ \mathit{\boldsymbol{S}} = {\left[ {\alpha \mathit{\boldsymbol{I}} + {\sigma ^{ - 2}}{{\left({{\mathit{\boldsymbol{P}}^{{\rm{obs, vic}}}}} \right)}^{\rm{T}}}{\mathit{\boldsymbol{P}}^{{\rm{obs, vic}}}}} \right]^{ - 1}}, $ | (9) |
式中: I是单位矩阵; 参数α和σ可以通过贝叶斯线性回归方法来确定(Chen et al, 2009)。缺失数据的估计值可以表达为:
| $ {\hat p_t} = {\mathit{\boldsymbol{\hat \beta }}^{\rm{T}}}\mathit{\boldsymbol{p}}_t^{{\rm{obs, vic}}}. $ | (10) |
综上所述, 输入有缺失数据台站的可用月降水量数据和其相邻台站的相应时间段数据, 然后确定参数α和σ, 用公式(6)~(9)得到
在本节中, 选取表 1中第1类29个具有完整降水月时间序列的台站用来验证插补和延长方法。首先, 假设在1979—1998年期间, 29个台站的月降水量均缺失。其次, 利用1999—2015年的月降水量数据, 建立29个台站与其邻近台站之间月降水量的数学关系。根据这个关系估算1979—1998年的月降水量。最后, 将延长时间序列的结果与1979—1998年的观测数据进行比较。
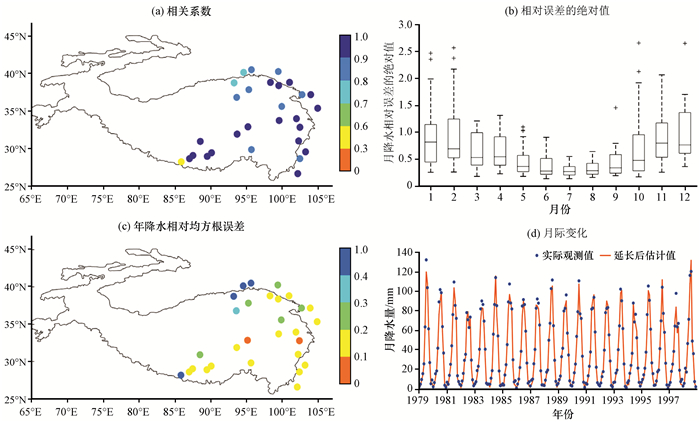
图 3(a)显示, 延长后数据与原始观测数据之间的相关系数大多在0.8以上, 说明插值结果基本上还原了月降水量的季节变化。图 3(b)统计了延长后数据平均月相对误差的绝对值, 其中长方框内黑线表示所有台站插值误差的中值, 长方框上、下边分别为上下四分位值, 每个长方框上、下边分别垂直延伸出的黑色虚线的端点表示所有台站插值误差上、下限, “+”表示异常值。从该图结果发现夏季(6—8月)的平均相对误差绝对值小于冬季(12月至次年2月), 这可能是由于冬季月降水量本身很小。图 3(c)显示大多数站点延长后数据的年降水相对均方根误差(RMSE)小于20%, 几个站点的误差相对较大, 这可能与其位于高原边缘, 降水的空间变化大, 且插值所需的邻近站点数量不足有关。图 3(d)所示为29个台站平均的1979—1998年间的月际变化, 可见插补的数据基本还原了缺失数据站的降水量月际变化以及年际变化。
|
图 3 1979—1998年第1类站点延长后月降水量与观测值之间的相关系数(a)、月相对误差绝对值(b)、年降水相对均方根误差(c)和月际变化对比(d) Fig. 3 The correlation coefficient (a), monthly absolute relative error (b), annual relative RMSE (c) and monthly variations (d) of the extended monthly precipitation data at the stations of Category 1 during 1979—1998 |
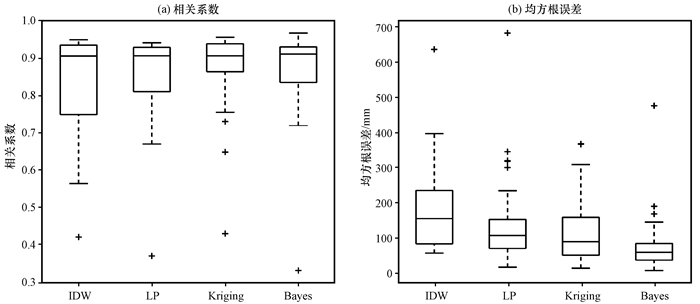
为评估贝叶斯线性回归插值方法, 本节也利用其他三种常用的空间插值方法估算第1类29个台站1979—1998年月降水量, 对比插值结果。这三种方法是反距离加权法(Inverse Distance Weighted, IDW)、局部多项式(Local Polynomial, LP)和克里金插值法(Haberlandt et al, 2007; Hwang et al, 2012; Zhang et al, 2016)。图 4显示了四种插值方法[反距离加权(IDW)、局部多项式(LP)、克里格插值和贝叶斯线性回归法]估算的降水量对比。图 4中长方框内黑线表示所有台站插值误差的中值, 长方框上、下边分别为上下四分位值, 每个长方框上、下边分别垂直延伸出的黑色虚线的端点表示所有台站插值误差上、下限, “+”表示异常值。从图 4(a)中可以看出, 四种方法获得的各站点1979—1998年间月降水估计值与观测值相关系数空间平均值分别为0.835, 0.853, 0.870和0.872。贝叶斯线性回归方法的相关系数略高于其他三种, IDW给出的相关系数最低。值得注意的是, 无论采用何种插值方法, 在邻近台站数量较少的情况下, 插值结果与观测值之间的相关性都较小。图 4(b)显示贝叶斯线性回归方法的均方根误差在四种方法中最小, 克里金插值误差次之, 而IDW的误差最大。因此, 在台站密度较低的高原中、东部地区, 贝叶斯线性回归方法比其他三种常用方法具有更好的性能。
|
图 4 四种插值方法[反距离加权(IDW)、局部多项式(LP)、克里格插值和贝叶斯线性回归法]估算的1979—1998年间29个台站月降水量与观测值之间的相关系数(a)和均方根误差(b) Fig. 4 The box—plot of the correlation coefficient (a) and root mean square error (b) of monthly precipitation series between the observed and the estimated annual precipitation during 1979—1998 at the 29 stations. The precipitation is estimated from inverse distance weighted (IDW), local polynomial (LP), Kriging interpolation, and Bayesian linear regression, respectively |
使用贝叶斯线性回归方法, 完成了高原中东部2~6类119个台站月降水量的插补和延长工作。为了说明重构数据的价值, 下面介绍该数据的两个初步应用。
4.1 改善降水格点插值精度利用站点数据空间插值、卫星反演和数值模式等均可以得到区域降水格点数据, 几种方法各有优劣(王磊等, 2017)。基于卫星的降水数据产品已成为降水信息的重要来源, 尤其是在传统雨量筒观测分布非常稀疏的地区(Mahesh et al, 2011)。区域数值模式可以在复杂山区得到可靠降水(Pan et al, 2015)。目前, 一些常用的降水格点数据集, 在青藏高原地区也存在不同程度的差异(谢欣汝等, 2018; Yang et al, 2017)。热带降水测量卫星TRMM(Tropical Rainfall Measurement Mission)的降水数据产品经常用于进行区域降水分析。然而, 卫星反演降水存在各种误差和不确定性(Bitew et al, 2011a, 2011b), 需要用观测降水资料进行校正。
利用台站资料, 通过Shen et al(2014)的方法对TRMM 3B43的月降水量进行校正。具体地, 首先对TRMM 3B43月降水数据进行EOF分解, 从而得到高原中、东部的降水EOF模态。然后根据台站资料对前30个EOF模态的时间系数进行优化, 使得EOF模态和相应的优化时间系数能最大限度合成(或恢复)对应网格内的台站观测资料。最后, 由EOF模态和优化的时间系数重新得到这个区域新的格点降水资料。整个融合过程保持了卫星观测降水的空间分布, 同时也使用了站点观测值进行校正。
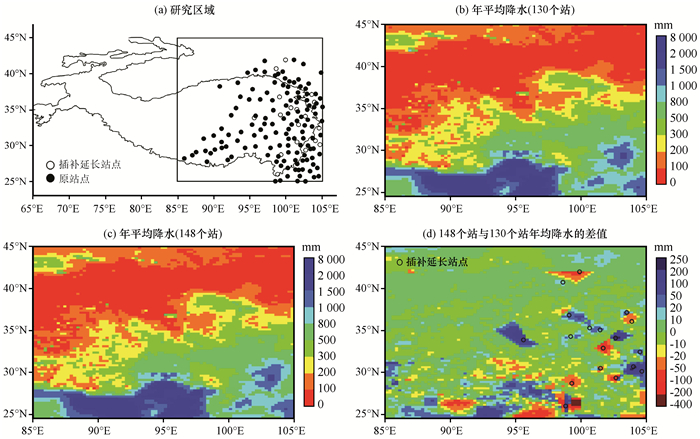
图 5显示了通过上述方法融合卫星数据与站点观测值的2015年降水总量空间分布。图 5(a)显示了插值的空间范围, 图 5(b)显示了利用数据完整的130个气象站点观测数据的融合结果, 图 5(c)显示了在这130个台站基础上, 增加插补和延长的18个台站(即共148个站)后的融合结果, 图 5(d)则是图 5(b)和5(c)中两个格点数据之间的差值。尽管两个格点数据显示出了相似的年降水量空间分布(即从东南向西北递减), 但增加台站数量对格点降水数据有着显著的影响[图 5(d)], 它们的区别通常出现在增加的站点周围。由此可见, 构建时间序列完整的降水观测数据有助于量化区域降水分布。
|
图 5 选取的25°N—45°N, 85°E—105°E区域(a)内2015年TRMM降水数据融合130个(b)和148个(c)气象站观测数据的结果及两者差值(d) Fig. 5 The location of the selected area (25°N—45°N, 85°E—105°E, a) for the data fusion of TRMM precipitation data and station data and the fusion results with data observed at 130 (b) and 148 (c) weather stations, and the difference between the two (d) in 2015 |
选取包含超过20个观测站(10°E×5°N)的三个区域, 分析青藏高原东部降水的年代际变化(图 6)。图 6中还包括了表 1中第1类站点在每个区域的平均值, 以便与插补后的结果对比。第1区位于青藏高原东南部, 站点分布相对密集。根据构建的数据, 该地区平均年降水量超过700 mm。在这个地区, 年降水在1998年之前没有明显的年代际变化, 但之后有明显的下降趋势, 说明降水减少与该地区的冰川退缩相关(Yao et al, 2012)。该区域在2002年后的变化, 也与Wang et al(2017)东南部径流减少的结论基本一致。然而, 第1区只有4个属于第1类的台站, 这4个站点在近些年平均年降水量呈现回升态势, 但在此区域全部台站平均值却没有发现这个趋势, 说明资料的插补和延长增强了站点的空间代表性。第2区位于青藏高原东部的中间地区, 其年降水量年代际变化并不明显。第3区位于青藏高原东北部, 年降水量在2002年之前基本稳定, 但此后略有上升[见图 6(d)中2002年前后两个时期的平均值], 这与青藏高原东北部滞后的湖泊扩张一致(Yang et al, 2017)。在2区和3区, 由于第1类台站(数据完整)的分布在空间上更为均匀, 因此第1类台站的平均年降水量与该区所有站的降水量大致相同, 其所反映的年代际变化也基本一致。
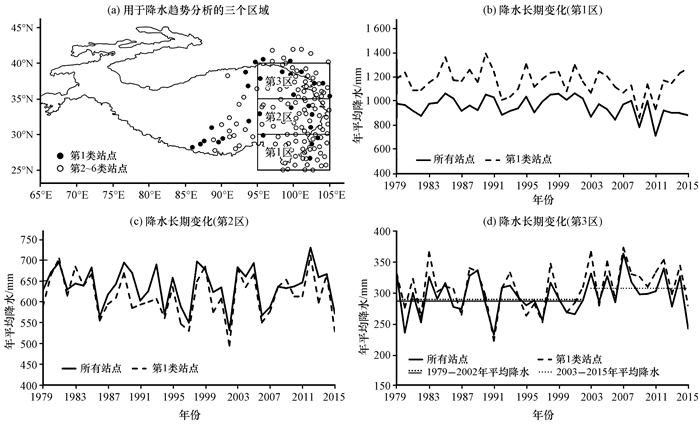
|
图 6 1979—2015年间三个区域(a)内第1类站点和进行插补和延长后所有站点的年平均降水量变化趋势(b~d)对比 Fig. 6 The trend of annual precipitation for the period of 1979—2015 averaged over the stations of Category 1 and over all stations after interpolation and extension (b~d) for the three zones (a) |
综上所述, 1998年前后青藏高原东南部年降水量明显减少, 2002年以来东北部年降水量略有增加, 而东南和东北部之间的过渡带则相对稳定。因此, 地域广大的青藏高原的降水变化在空间上并不一致。
5 结论与讨论将基于贝叶斯线性回归的升尺度方法移植到空间插值中, 建立缺失数据站点降水与其相邻站点降水之间的关系。在此基础上, 构建了青藏高原中、东部地区1979—2015年148个气象局台站完整时间序列的月降水量数据, 并对该数据进行初步应用, 得到以下主要结论:
(1) 交叉验证结果表明, 插补延长后数据基本上能还原缺失数据站点降水的季节变化, 并且贝叶斯线性回归方法在高原中、东部的降水插值精度优于其他三个常用的方法。
(2) 插补延长后数据与卫星降水数据的融合显示, 引入插补站点数据可以改变局地的降水分布特征。
(3) 使用构建的时间序列分析近期的降水变化, 发现青藏高原东南部1998年后年降水量明显减少, 而东北部的年降水量自2002年以来略有上升, 在过渡带(青藏高原东部的中间区域)未出现明显的年代际变化。这一降水空间上的差异可以大致解释区域水循环(冰川物质平衡、湖泊水量变化和河流径流变化)的空间变化格局。
目前, 已经完成了1979—2015年气象局站点降水时间序列的插补和延长。但对于建立站点较少的20世纪50、60年代, 仍需要继续进行插补和延长工作, 以期能够得到更长时间序列的站点降水数据情况。另外, 除了气象局以外, 仍有许多机构和部门, 也在青藏高原地区建立了许多降水观测站。未来将收集和整理其他来源的站点降水资料, 对其缺失数据进行插补和延长, 以期为水文、生态等地表过程研究提供更多的可靠降水数据。
Bitew M M, Gebremichael M. 2011a. Assessment of satellite rainfall products for streamflow simulation in medium watersheds of the Ethiopian highlands[J]. Hydrol Earth Syst Sci, 15(4): 1147–1155.
DOI:10.5194/hess-15-1147-2011 |
|
Bitew M M, Gebremichael M. 2011b. Evaluation of satellite rainfall products through hydrologic simulation in a fully distributed hydrologic model[J]. Water Resour Res, 47(6): W06526.
|
|
Chen T, Martin E. 2009. Bayesian linear regression and variable selection for spectroscopic calibration[J]. Anal Chim Acta, 631: 13–21.
|
|
Girons L M, Wennerström H, Nordén L A, et al. 2015. Location and density of rain gauges for the estimation of spatial varying precipitation[J]. Geogr Ann, 97(1): 167–179.
|
|
Haberlandt U. 2007. Geostatistical interpolation of hourly precipitation from rain gauges and radar for a large-scale extreme rainfall event[J]. J Hydrol, 332(1/2): 144–157.
|
|
Hwang Y, Clark M, Rajagopalan B, et al. 2012. Spatial interpolation schemes of daily precipitation for hydrologic modeling[J]. Stoch Env Res Risk Assess, 26(2): 295–320.
DOI:10.1007/s00477-011-0509-1 |
|
Li M, Shao Q X. 2010. An improved statistical approach to merge satellite rainfall estimates and raingauge data[J]. J Hydrol, 385(1): 51–64.
|
|
Lu N, Trenberth K E, Qin J, et al. 2015. Detecting long-term trends in precipitable water over the Tibetan Plateau by synthesis of station and MODIS observations[J]. J Climate, 28(4): 1707–1722.
DOI:10.1175/JCLI-D-14-00303.1 |
|
Mahesh C, Prakash S, Sathiyamoorthy V, et al. 2011. Artificial neural network based microwave precipitation estimation using scattering index and polarization corrected temperature[J]. Atmos Res, 102(3): 358–364.
DOI:10.1016/j.atmosres.2011.09.003 |
|
Pan X D, Li X, Cheng G D, et al. 2015. Development and evaluation of a river-basin-scale high spatio-temporal precipitation data set using the WRF model:a case study of the Heihe river basin[J]. Remote Sens, 7(7): 9230–9252.
|
|
Peterson T C, Vose R S. 1997. An overview of the global historical climatology network temperature database[J]. Bull Amer Meteor Soc, 78(12): 2837–2849.
DOI:10.1175/1520-0477(1997)078<2837:AOOTGH>2.0.CO;2 |
|
Qin J, Yang K, Lu N, et al. 2013. Spatial upscaling of in-situ soil moisture measurements based on MODIS-derived apparent thermal inertia[J]. P Soc Photo-opt Ins, 138(6): 1–9.
|
|
Shen S P, Tafolla N, Smith T M, et al. 2014. Multivariate regression reconstruction and its sampling error for the quasi-global annual precipitation from 1900 to 2011[J]. J Atmos Sci, 71(9): 3250–3268.
DOI:10.1175/JAS-D-13-0301.1 |
|
Shen Y, Xiong A Y. 2016. Validation and comparison of a new gauge-based precipitation analysis over mainland China[J]. Int J Climatol, 36(1): 252–265.
DOI:10.1002/joc.4341 |
|
Tong K, Su F G, Yang D Q, et al. 2014. Evaluation of satellite precipitation retrievals and their potential utilities in hydrologic modeling over the Tibetan Plateau[J]. J Hydrol, 519: 423–437.
DOI:10.1016/j.jhydrol.2014.07.044 |
|
Wang Y Y, Zhang Y Q, Chiew F H S, et al. 2017. Contrasting runoff trends between dry and wet parts of eastern Tibetan Plateau[J]. Sci Rep, 7(1): 15458.
DOI:10.1038/s41598-017-15678-x |
|
Villarini G, Krajewski W F. 2008. Empirically-based modeling of spatial sampling uncertainties associated with rainfall measurements by rain gauges[J]. Adv Wat Resour, 31(7): 1015–1023.
|
|
Xie P, Xiong A Y. 2011. A conceptual model for constructing high-resolution gaugesatellite merged precipitation analyses[J]. J Geophys Res Atmos, 116(D21): 21106.
|
|
Yang F, Lu H, Yang K, et al. 2017. Evaluation of multiple forcing data sets for precipitation and shortwave radiation over major land areas of China[J]. Hydrol Earth Syst Sc, 21(11): 5805–5821.
DOI:10.5194/hess-21-5805-2017 |
|
Yang R M, Zhu L P, Wang J B, et al. 2017. Spatiotemporal variations in volume of closed lakes on the Tibetan Plateau and their climatic responses from 1976 to 2013[J]. Climatic Change, 140(3/4): 621–633.
|
|
Yao T D, Thompson L, Yang W, et al. 2012. Different glacier status with atmospheric circulations in Tibetan Plateau and surroundings[J]. Nature Climate Change, 2(9): 663–667.
|
|
Zhang F, Zhang H B, Hagen S C, et al. 2015. Snow cover and runoff modelling in a high mountain catchment with scarce data:effects of temperature and precipitation parameters[J]. Hydrol Process, 29(1): 52–65.
DOI:10.1002/hyp.v29.1 |
|
Zhang X K, Lu X Y, Wang X D. 2016. Comparison of spatial interpolation methods based on rain gauges for annual precipitation on the Tibetan Plateau[J]. Pol J Environ Stud, 25(3): 1339–1345.
DOI:10.15244/pjoes/61814 |
|
李妮娜, 李建. 2017. 中国西南复杂地形区降水观测年际变化代表性问题初步分析[J]. 高原气象, 36(1): 119–128.
Li N N, Li J. 2017. Preliminary analysis of representativeness of precipitation observation over Southwest China[J]. Plateau Meteor, 36(1): 119–128.
DOI:10.7522/j.issn.1000-0534.2016.00008 |
|
王丹, 王爱慧. 2017. 1901-2013年GPCC和CRU降水资料在中国大陆的适用性评估[J]. 气候与环境研究, 22(4): 446–462.
Wang D, Wang A H. 2017. Applicability assessment of GPCC and CRU precipitation products in China during 1901 to 2013[J]. Climatic Environ Res, 22(4): 446–462.
|
|
王磊, 陈仁升, 宋耀选. 2017. 高寒山区面降水量获取方法及影响因素研究进展[J]. 高原气象, 36(6): 1546–1556.
Wang L, Chen R S, Song Y X. 2017. Research review on calculation methods and influential factors on areal precipitation of alpine mountains[J]. Plateau Meteor, 36(6): 1546–1556.
DOI:10.7522/j.issn.1000-0534.2017.00007 |
|
谢欣汝, 游庆龙, 保云涛, 等. 2018. 基于多源数据的青藏高原夏季降水与水汽输送的联系[J]. 高原气象, 37(1): 78–92.
Xie X R, You Q L, Bao Y T, et al. 2018. The connection between the precipitation and water vapor transport over Qinghai-Tibetan Plateau in summer based on the multiple datasets[J]. Plateau Meteor, 37(1): 78–92.
DOI:10.7522/j.issn.1000-0534.2017.00030 |
|
杨溯, 徐文慧, 许艳, 等. 2016. 全球地面降水月值历史数据集研制[J]. 气象学报, 74(2): 259–270.
Yang S, Xu W H, Xu Y, et al. 2016. Development of a global historic monthly mean precipitation dataset[J]. Acta Meteor Sinica, 74(2): 259–270.
|
|
赵煜飞, 朱江, 许艳. 2014. 近50a中国降水格点数据集的建立及质量评估[J]. 气象科学, 34(4): 414–420.
Zhao Y F, Zhu J, Xu Y. 2014. Establishment and assessment of the grid precipitation datasets in China for the past 50 years[J]. J Meteor Sci, 34(4): 414–420.
|
|
朱会义, 贾绍凤. 2004. 降雨信息空间插值的不确定性分析[J]. 地理科学进展, 23(2): 34–42.
Zhu H Y, Jia S F. 2004. Uncertainty in the spatial interpolation of rainfall data[J]. Progress in Geography, 23(2): 34–42.
DOI:10.3969/j.issn.1007-6301.2004.02.005 |
2. University of Chinese Academy of Sciences, Beijing 100049, China;
3. Department of Earth System Science, Tsinghua University, Beijing 100084, China;
4. Department of Hydraulic Engineering, State Key Laboratory of Hydroscience and Engineering, Tsinghua University, Beijing 100084, China
 2018, Vol. 37
