2. 中国民用航空飞行学院, 四川 广汉 618307
青藏高原以其独特的地质特性影响着全球气候变化, 陆气相互作用一定程度上影响着中国、亚洲甚至是北半球的环境变化(Ma et al, 2009), 全球变暖在近年来被提出存在停滞现象(Amaya et al, 2015; England et al, 2014; Kosaka et al, 2013), 而青藏高原变暖停滞并不明显(Cai et al, 2016), 特别是在高原地形大于4 000 m的区域变暖停滞几乎不存在(An et al, 2016)。因此青藏高原因其独特的大地形再一次得到了广泛的重视。在此背景下, 大气边界层作为连接自由大气与陆面过程的重要介质, 决定了地表和自由大气中热量、动力、水分和化学成分的交换(Yanai et al, 1994; Baklanov et al, 2011; Compton et al, 2013), 研究意义不言而喻。
由于缺乏观测资料, 边界层高度的研究一直侧重于单站短时研究(Sørensen et al, 1996; Zhang et al, 2008; Leventidou et al, 2013; Bachtiar et al, 2014), 国外学者一般通过5种方法估算大气边界层高度:相对湿度最小梯度、位温最大梯度、垂直温度最大梯度、比湿最小梯度(Waliser et al, 2012)、折射率最小梯度(Seidel et al, 2010), 研究表明相对湿度最小梯度法对估算边界层高度最为精确(Engeln et al, 2013)。精确计算则采用确定理查森数Ri(z)≈0.25所在高度为大气边界层高度(Zhang et al, 2014, 2013)
目前, 大气边界层高度的气候特征研究表明大气边界层高度日变化剧烈, 大值区存在于沙漠、高原、干旱区、ITCZ等区域(Engeln et al, 2013; 赵艳茹等, 2017), 陆地较厚的边界层中心分布存在08:00(世界时, 下同)效应(王学忠等, 2011)。(Whiteman et al, 2000)发现墨西哥高原傍晚大气的迅速冷却促使高原上边界层迅速变化。中国区域春夏季边界层高度大于秋冬季, 午后边界层高度为日变化中的最大值, 中国西部地区边界层高度日振幅高于中东部地区(Guo et al, 2016), 残余层与深厚对流边界层存在密切的联系(赵采玲等, 2016), 干冷空气迅速入侵使得边界层高度迅速增加(李照国等, 2016)。青藏高原大气边界层高度远大于周边平原地区(Yang et al, 2004; Zuo et al, 2005; 李茂善等, 2006; Fan et al, 2011), 青藏高原地区边界层顶在2月出现过5 000 m的极大值(Chen et al, 2013a, 2013b), 弱大气稳定性与深厚边界层高度往往与高层位涡大值区相关联, 上层位涡与高层较大风速影响青藏高原边界层的发展(Chen et al, 2016)。东亚地区, 感热、辐射是维持边界层发展的主要能量(万云霞等, 2017), 高原干季相同; 湿对流下的雨水蒸发冷却可抑制边界层的发展(Yang et al, 2004)。冬季, 积雪和地面反照率的增加可以抑制边界层的发展(Ueno et al, 2012)。高原东部边缘边界层内风速的规律变化也影响着四川盆地的强对流天气过程(Li et al, 2007)。因此, 有必要对青藏高原大范围的边界层高度和较长时间尺度的边界层高度进行近一步研究, 特别是日变化的气候变化特征分析。本文所选用的资料集在2016—2017年先后有国内外学者对其进行了资料评估, 且评估结果良好(Feng et al, 2016; Penny et al, 2017; Laloyaux et al, 2017)。
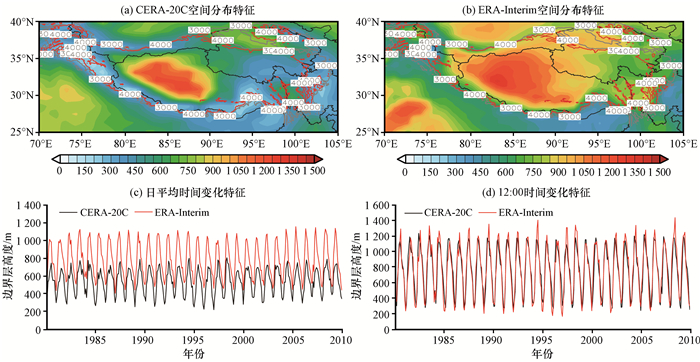
2 资料与方法为研究青藏高原边界层高度日变化的气候变化特征, 选取ECMWF (European Centre for Medium-Range Weather Forecasts) 2016年发布的CERA-20C数据集, 该数据集将海洋、大气观测资料同时融入一个海气耦合模式, 是一项创新性的20世纪全球气候再分析数据集(Laloyaux et al, 2016), 日数据精确到8个时次, 每3 h一次。日数据8个时次分别为00:00, 03:00, 06:00, 09:00, 12:00, 15:00, 18:00和21:00。由于CERA-20C数据在青藏高原地区甚至是中国的分析甚少, 所以本文以此数据集为基础数据, 为验证CERA-20C数据集边界层高度在高原上的适用性, 将其与ERA-Interim边界层高度做对比分析, 结果如图 1所示[该图及文中涉及的地图是基于国家测绘地理信息局标准地图服务网站下载的审图号为GS(2016)1550的中国地图制作, 底图无修改]。
|
图 1 CERA-20C数据集边界层高度与ERA-Interim边界层高度(彩色区, 单位: m)在青藏高原的对比分析 等值线为青藏高原地形高度(灰色为3 000 m, 红色为4 000 m) Fig. 1 Comparative analysis of the boundary layer height set on the CERA-20C data and the ERA-Interim data (color area, unit: m) on the Qinghai-Tibetan Plateau. Contours for the Qinghai-Tibetan Plateau terrain height (gray line denote 3 000 m, and red line denote 4 000 m) |
由图 1(a)、(b)空间分布特征可以看出, CERA-20C数据集与ERA-Interim数据集中, 青藏高原边界层高度分布特征基本相同, 高值与低值分布区域相同。图 1(c)时间变化特征可以看到, CERA-20C资料与ERA-Interim资料边界层高度随时间波动趋势基本一致, ERA-Interim资料边界层高度平均较CERA-20C资料高200 m左右, 结合图 1(d)同时刻两种资料边界层高度相同的时间变化特征可知, 图 1(c)的误差变化与CERA-20C资料的高时间精度密切相关。CERA-20C资料8个时次中15:00, 18:00, 21:00和00:00多为稳定边界层, 边界层高度小, 导致日平均边界层高度小于ERA-Interim。
由以上分析, CERA-20C数据与ERA-Interim数据具有良好的一致性, 所以本文确认使用CERA-20C数据集的边界层高度、地表温度、大气垂直湿度、大气垂直速度日数据对青藏高原大气边界层高度做详细气候特征分析, 并初步分析影响边界层高度变化的主要因子变化特征。
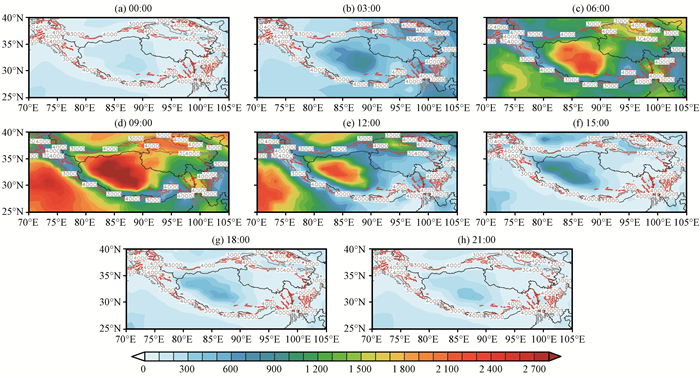
3 日变化特征 3.1 空间分布特征对8个时次边界层高度在青藏高原的分布特征进行分析(图 2)可知, 大气边界层高度在高原不同地区均存在剧烈的日变化特征, 边界层高度第一大值区在海拔5 000 m以上的藏北高原, 另外在柴达木盆地与塔里木盆地边界层高度相对于其他地区较高。而海拔低于1 000 m包含印度大沙漠的印度北部地区边界层高度同样较正常偏高。
|
图 2 青藏高原边界层高度空间分布特征(彩色区, 单位: m) 彩色实线分别为地形高度(灰色为3 000 m, 红色为4 000 m) Fig. 2 Diurnal spatial distribution of the boundary layer thickness (color area, unit: m) in the Qinghai-Tibetan Plateau. Contours for the Qinghai-Tibetan Plateau terrain height (gray line denote 3 000 m, and red line denote 4 000 m) |
高原地区边界层高度最大的藏北高原地区日变化非常规律。00:00, 边界层高度首先在拉萨以西包括尼玛、巴扎等地的区域(30°N—32°N, 87°E—90°E)形成大值区, 随着时间增加, 边界层高度大值区以此区域为中心向四周增加, 高原地区边界层高度随时间增大的同时, 大值区直至09:00增加到最大, 蔓延至藏北高原。在09:00以后, 边界层高度随时间增加而减小, 大值区随时间增加而减小, 于21:00减小至原区域, 次日00:00降低至最小形成连续的日变化特征。柴达木盆地与塔里木盆地, 边界层高度连续的日变化特征与藏北高原相同。印度大沙漠地区边界层高度日变化特征基本相似, 差别在于06:00印度大沙漠以西边界层高度率先增加。春夏秋冬四季边界层高度空间分布大值区与年平均相似, 区别在于春季以藏北高原为首, 夏季以柴达木盆地与塔里木盆地两大沙漠地区为首, 秋冬季沙漠地区则不存在大值区, 只在藏北高原(图略)。
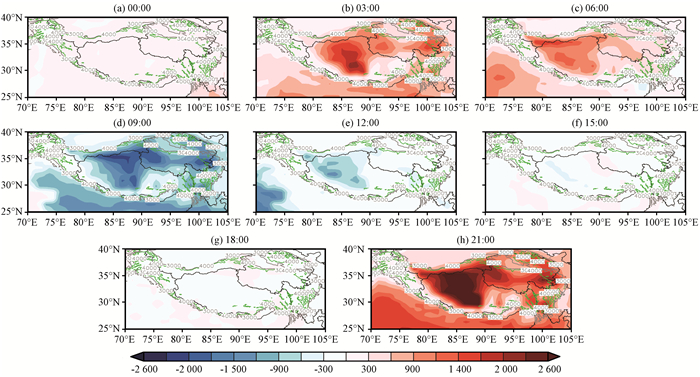
对不同时刻边界层高度进行逐时差值计算, 并且将最厚(09:00)与最薄的(00:00)BLH进行差值得到图 3。不同时刻逐时差值可以看到边界层高度在03:00—06:00增加较快, 增幅达到948.67 m·(3h)-1, 在09:00—12:00降低较快, 降幅达到868.24 m·(3h)-1。09:00与00:00的差值表明边界层高度升温区以藏北高原最为明显, 阿尼玛卿山附近次之; 降温明显区域与增温区相同, 但藏北高原边界层高度增高区由雅鲁藏布江以北向北延伸增加, 降低区以昆仑山以南为主向南延伸降低。
|
图 3 青藏高原边界层高度差值空间分布特征(彩色区, 单位: m) 等值线为地形高度(灰色为3 000 m, 红色为4 000 m) Fig. 3 Diurnal spatial distribution of the boundary layer thickness difference value (color area, unit: m) in the Qinghai-Tibetan Plateau. Contours for the Qinghai-Tibetan Plateau terrain height (gray line denote 3 000 m, and red line denote 4 000 m) |
在空间分布特征上可以看出在沙漠干旱地区、海拔地形大于5 000 m地区, 边界层高度较其他地区更大。夏季与春、秋、冬季边界层高度大值区分布不同, 夏季边界层高度在塔里木盆地与柴达木盆地的沙漠地区较藏北高原更强, 这与夏季沙漠地区强地表温度和辐射关系较大。
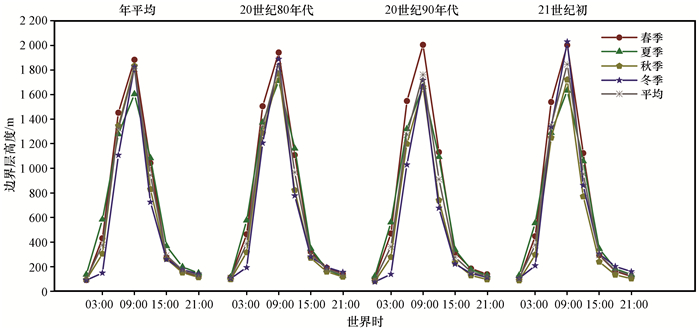
3.2 时间变化特征在此定义青藏高原地区为26°N—39°N, 73°E—104°E, 对此区域内海拔大于3 000 m的格点进行边界层高度的区域平均, 再进行季节平均, 得到不同季节, 边界层高度随时刻变化特征。与不同时刻空间分布特征相同, 不同季节的边界层高度在09:00最大, 晚于平原时间的06:00, 在00:00最小。30年平均边界层高度最高可达1 811.75 m, 春季平均最高达1 982.764 m、最低103.98 m, 夏季平均最高达1 669.235 m、最低120.915 m, 秋季平均最高1 717.06 m、最低87.961 m, 冬季平均最高1 877.936 m、最低94.446 m(表 1), 其中BLH最大值出现在09:00, 最小值在00:00。夏季边界层高度变化异常, 通常情况下夏季边界层高度均大于其他季节, 在09:00夏季边界层高度低于春、秋季, 高于冬季; 09:00夏季边界层高度低于其他季节。春季边界层高度在06:00和09:00均最高。
| 表 1 青藏高原不同年代, 不同季节边界层高度最值统计表 Table 1 Different years, different seasons of the boundary layer heights' extreme value in Qinghai-Tibetan Plateau |
对1981—2010年30年边界层高度每10年进行平均, 分析边界层高度日变化在年代上的变化特征。由图 4各年代的变化特征可以发现, 20世纪90年代平均边界层高度相较与20世纪80年代与21世纪初更小, 夏、秋、冬三季呈现同样的趋势, 春季变化异常。春季边界层高度随年代的变化而逐渐增加, 20世纪90年代春季边界层高度在其他季节均减小的情况下异常增加。
|
图 4 青藏高原边界层高度各年代、各季节日内变化曲线 Fig. 4 Diurnal variation curve of the boundary layer thickness in the Qinghai-Tibetan Plateau |
综上所述, 青藏高原边界层高度日内变化从00:00开始从100 m多开始急速增加, 增速可达948.67 m·(3h)-1, 在09:00达到最大值, 09:00—15:00开始急速降低, 降速可达760.02 m·(3h)-1, 15:00以后至次日00:00边界层高度变化以微小的趋势在降低。边界层高度的最大值在春季为最大、夏季最小; 边界层高度最小值在夏季最大、秋季最小。春季青藏高原边界层高度随年代变化而逐渐增加, 夏、秋、冬季在20世纪90年代边界层高度较20世纪80年代与21世纪初更小。
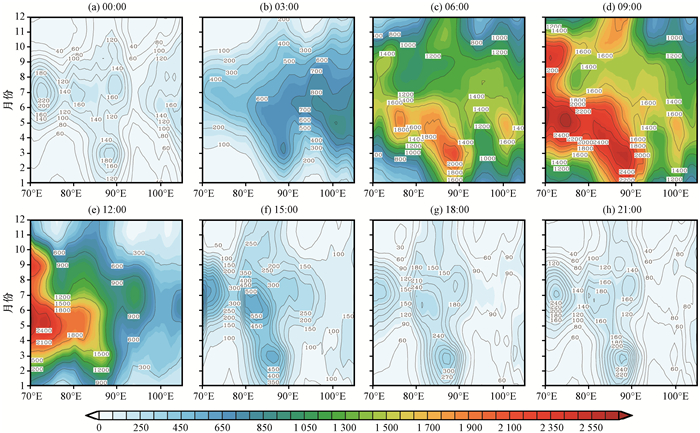
4 日变化的年内变化特征 4.1 季节循环特征在青藏高原, 对26°N—39°N进行纬向平均后得到的不同时刻边界层高度季节循环特征(图 5), 由时间-经向剖面图(图 5)可以看出, 不同时刻边界层高度随经度的变化可将高原分为3个区域, 分别为高原西坡(70°E—78°E)、高原腹地(78°E—95°E)、高原东坡(95°E—105°E), 下面对不同区分别进行特征分析。
|
图 5 青藏高原纬向平均的边界层高度季节循环特征(单位: m) Fig. 5 Seasonal circulation characteristics of the zonal mean BLH of the Qinghai-Tibetan Plateau. Unit: m |
高原西坡, 白昼变化较为复杂。7月边界层高度在06:00出现大值中心, 09:00大值区加深, 并在9月初出现第二大值区, 12:00两个大值区慢慢减弱; 5—10月BLH大值区在06:00合并, 边界层高度大值区持续到00:00, 然后随时间慢慢减小。
高原腹地, 平均海拔在5 000 m以上, 夜间变化较为复杂。3月BLH在03:00出现大值区, 日变化随时间增加至09:00, 边界层高度大值逐渐加深扩散; 5月BLH大值在12:00减弱, 15:00大值区分为两个; 夏季21:00 BLH大值区经向分裂为两个, 一个在82°E, 一个在90°E。
高原东坡昼夜变化均不大, 且规律性不强, 全年只在春季12:00与15:00存在闭合大值区。5月03:00开始生成一个大值区, 06:00逐渐发展, 到09:00后逐渐消失。
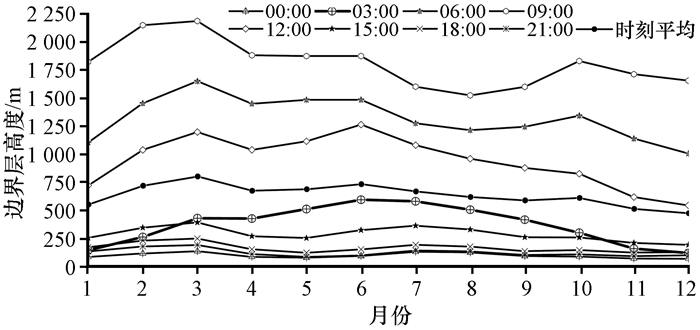
4.2 逐月变化特征从青藏高原不同时刻边界层高度月变化曲线(图 6)可以看出, 一般情况下, 各时刻BLH逐月变化趋势相同, 从1月上升到3月, 在4月下降, 5、6月趋于平缓, 7、8月持续下降, 9、10月回升, 11、12月缓慢下降, 白昼边界层高度在3月最大, 8月最小。夜间边界层高度变化趋势同样高度吻合, 随月份变化不大。03:00边界层高度随月变化与其他时刻明显不同, 边界层高度主要呈现单峰型变化, 最大值在6月出现, 从1月上升至3月, 4月趋于平缓, 5、6月持续增加, 7月平缓, 8—12月持续下降。
|
图 6 青藏高原边界层高度在不同时刻逐月变化特征 Fig. 6 Variation characteristics of the boundary layer of the Qinghai-Tibetan Plateau at different times |
综上所述, 各时刻青藏高原边界层高度年内变化特征基本一致, 除03:00以外, 其他时刻均在初春3月为边界层高度最大值, 随后全年总体为下降趋势, 且这种变化情况在白昼对流边界层较黑夜稳定边界层更为明显。03:00 BLH的最大值在6月出现。
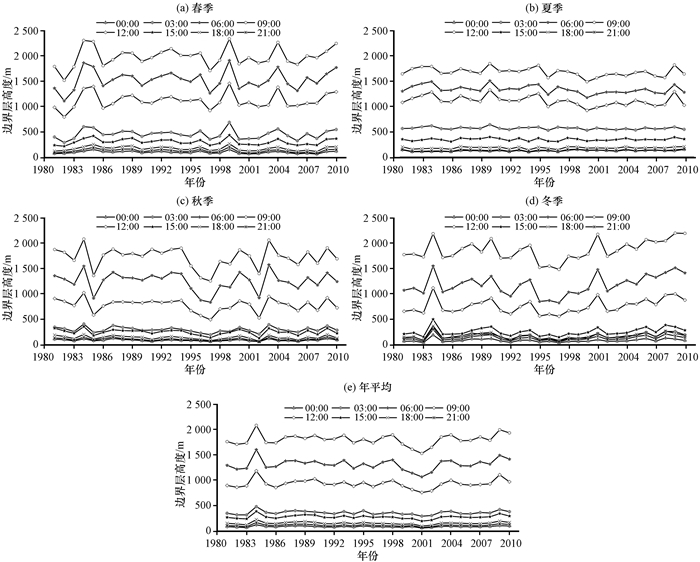
5 年际变化特征不同季节年际变化曲线如图 7所示, 同样对高原内海拔大于3 000 m的格点进行区域平均, 得到各季节边界层高度逐年变化特征各不相同, 差异巨大, 各时刻在各季节中的变化特征相应。图 7(e)年平均下各时刻的边界层高度逐年变化平稳, 在1984年各时刻同时出现最大值, 2001年出现最小值, 白昼逐年变化剧烈, 黑夜逐年变化相对平稳。
|
图 7 青藏高原边界边界层高度各季节逐年变化特征 Fig. 7 Variation characteristics ofboundary layer heights in Qinghai-Tibetan Plateau in different seasons |
各季节变化中, 夏季各时刻边界层高度逐年变化平稳, 不存在明显大强弱的区分。春季边界层高度强年为1984, 1999和2004年, 弱年为1982年。秋季边界层高度强年为1984和2003年, 弱年为1985, 1997和2002年。冬季边界层高度强年为1984和2001年, 没有明显弱年, 边界层高度逐年有明显递增过程。综上所述, 青藏高原边界层高度除开夏季平稳变化以外, 春、秋、冬三季在20世纪80年中期, 20世纪90年代末与21世纪初均存在较大波动。冬季边界层高度近30年逐渐增加, 特别是在21世纪初的大幅持续增加值得重视。除去个别异常值年份, 30年年平均的边界层高度总体没有明显上升下降趋势, 变化平缓, 与此相同的是夏季边界层高度的变化。春、秋、冬三季边界层高度30年内虽有大幅度波动情况, 但总体春、秋季总体不存在明显的上升下降趋势, 只有冬季在21世纪开始存在明显上升。
6 边界层内可能影响边界层高度的相关因子大气边界层紧密连接地表, 直接被地表粗糙度、土壤热力学特性、湿度以及强对流活动等影响(卓嘎等, 2002)。精确计算边界层高度的方法为计算理查森数、不同学者通过位温廓线、相对湿度廓线等方法估算边界层高度。本文通过确定边界层高度的几种方法, 选取地表气温、垂直速度、垂直相对湿度3个在大气边界层内可能影响边界层高度的物理量, 对影响边界层高度的因子进行分析。
6.1 地表气温对边界层变化相关分析边界层高度与地表气温的相关性极好, 30年年平均下不同时刻边界层高度与地表温度为正相关, 但在边界层高度每个时刻均持续最大的拉萨以西地区, 边界层高度在09:00与地表温度呈显著负相关(图略), 在12:00负相关较弱。由此进而对不同季节边界层高度与地表温度进行相关性分析发现, 夏季与冬季边界层高度与地表温度在高原所有区域均为显著正相关, 在秋季负相关不够显著(图略)。春季边界层高度与地表气温的相关性如图 8所示, 打点区域为过99%显著性检验的区域。

|
图 8 春季青藏高原边界层高度与地表温度的相关性分析 打点区域为通过99%信度检验区域; 等值线为地形高度(灰色为3 000 m, 红色为4 000 m) Fig. 8 Correlation analysis between the boundary layer height and the surface temperature in the Qinghai-Tibetan Plateau in spring. RBI area is 99% confidence test area, contours for the Qinghai-Tibetan Plateau terrain height (gray line denote 3 000 m, and red line denote 4 000 m) |
由图 8明显可以看出, 边界层高度与地表气温负相关显著。相对于夏季与冬季的正相关, 在青藏高原海拔大于5 000 m的腹地, 边界层高度与地表气温为负相关, 其中边界层高度持续大值区的藏北高原中心地区(拉萨以西尼玛、措麦、巴扎等地)更是通过了99%的信度检验。与前面分析的边界层高度的季节变化相结合, 春季青藏高原海拔大于5 000 m的腹地正处于积雪融化时期, 积雪融化带走地表热量, 促使春季地表温度更低, 与其负相关的边界层高度则较其他季节更高。
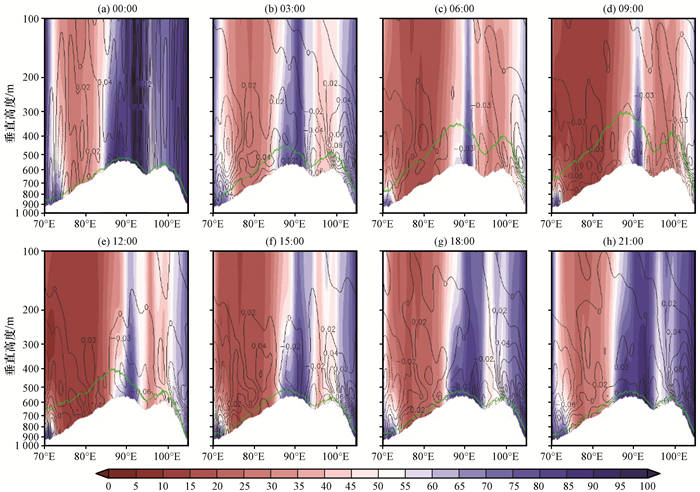
6.2 边界层高度内垂直速度、垂直相对湿度的变化特征Chen et al(2013)指出湍流动能能量与边界层高度有很好的正相关性, 本文对大气垂直速度进行分析, 等值线为垂直速度ω, 当ω>0时为下沉运动, ω<0时为上升运动。Engeln et al (2013)曾指出, 垂直相对湿度的最小梯度作为描述边界层高度的方法最优, 填色为相对湿度的垂直分布, 本文规定相对湿度大于50%为湿润, 相反则为干燥。取高原主体地形, 对27°N—39°N进行纬向平均, 得到春季青藏高原经向剖面图, 选取边界层高度异常的春季与夏季进行特征对比分析。
春季青藏高原相对湿度为带状的垂直分布(图 9), 边界层高度在00:00开始逐渐增加, 相对湿度随之降低。高原西坡, 由地面向自由大气垂直扩展, 全天空气干燥, 相对湿度低, 边界层高度随时间增加沿坡面均匀增加。高原腹地, 由地面向自由大气垂直扩散, 全天空气湿润, 边界层高度随时间变化较西坡增加更剧烈, 在95°E山谷内相对湿度较低。高原东坡为背风坡, 边界层高度随时间变化小, 下降速率快, 全天空气相对湿润。垂直速度在95°E的山谷地区, 垂直速度只在00:00为下沉运动, 其他时刻为上升运动, 高原背风坡夜间多为强烈的下沉运动, 白昼低层上升运动高层下沉运动。边界层高度发展速度最高的09:00, 边界层内垂直速度呈现上升、下沉运动交替的现象, 为边界层高度的发展提供一定的动力机制。
|
图 9 春季青藏高原边界层高度(绿色实线, 单位: m)、垂直速度(等值线, 单位: Pa·s-1)及垂直相对湿度(彩色区, 单位: m)的分布特征 Fig. 9 Distribution characteristics ofboundary layer heights (green solid line, unit: m), vertical velocity (contour, unit: Pa·s-1) and vertical relative humidity (color area, unit: m) of the Qinghai-Tibetan Plateau in spring |
夏季青藏高原相对湿度垂直分布(图 10)为上午高层干燥, 低层湿润, 午后高原东坡相对湿度像西延伸, 在夜间转变为西坡干燥, 东坡湿润; 高原腹地与东坡由地面向高空延伸相对湿度大于50%, 边界层高度发展速度最高的09:00以后, 高空大气由东向西相对湿度逐渐增加。夏季边界层高度在09:00发展到350 hPa时不再继续发展, 此时空气干燥, 垂直速度在09:00与春季相同呈现为上升运动与下沉运动交替出现的现象。夏季垂直速度较春季更为规律, 相对湿度大于50%时垂直速度多为上升运动, 反之为下沉运动或无垂直运动。
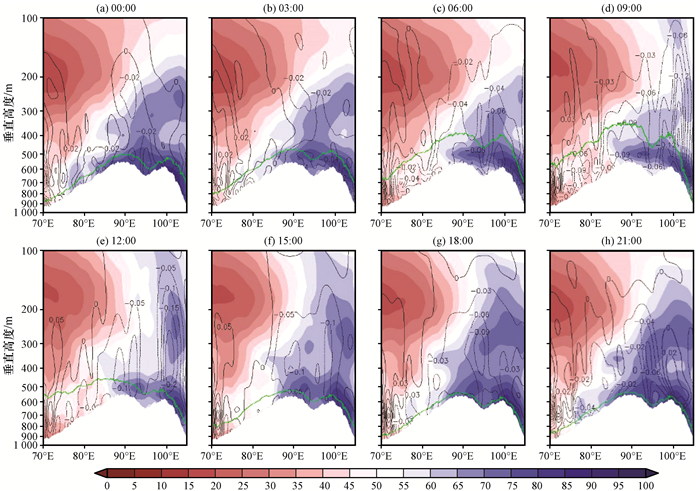
|
图 10 夏季青藏高原边界层高度(绿色实线, 单位: m)、垂直速度(等值线, 单位: Pa·s-1)及垂直相对湿度(彩色区, 单位: m)的分布特征 Fig. 10 Distribution characteristics ofboundary layer heights (green solid line, unit: m), vertical velocity (contour, unit: Pa·s-1) and vertical relative humidity (color area, unit: m) of the Qinghai-Tibetan Plateau in summer |
春夏季青藏高原相对湿度垂直分布明显不同, 与之对应, 春季相对湿度为带状分布时, 边界层高度发展高度可达300 hPa, 夏季边界层高度在同一经度上发展时, 只发展到了350 hPa。进而计算了相对湿度的垂直梯度, 得到垂直分布特征(图略), 边界层顶与相对湿度最小梯度有很好的对应关系, 这与Engeln et al (2013)所提观点一致。边界层高度发展到最高时, 垂直速度在高原上为上升运动与下沉运动交替出现。春季与夏季边界层高度在发展到最大值后, 高原腹地边界层高度迅速降低, 而高原西坡边界层高度降低缓慢, 夏季高原西坡边界层高度甚至远大于高原腹地。
7 结论与讨论(1) 青藏高原边界层高度大值区在海拔大于5 000 m地区以及沙漠干旱地区, 其中藏北高原中心的尼玛等地为边界层高度大值区的扩散源地。不同时刻逐时差值可以看到边界层高度在03:00—06:00增加最剧烈, 增幅达到948.67 m·(3h)-1; 在09:00—12:00降低最剧烈, 降幅达到868.24 m·(3h)-1。边界层高度在09:00为最大值, 晚于非高原地区的06:00, 边界层高度30年平均最大值可达1 982.764 m, 21世纪初平均最大可达2 029.471 m, 日变化最大值可达2 901.21 m。青藏高原边界层高度最大值在春季为最大、夏季最小; 边界层高度最小值在夏季最大、秋季最小。
(2) 高原西坡、腹地、东坡边界层高度逐月变化特征各不相同, 西坡边界层在春秋季最大, 腹地在冬季最大, 东坡边界层高度低, 变化幅度小。03:00青藏高原边界层高度逐月变化趋势与其他时刻不同, 为单峰变化特征。青藏高原边界层高度除夏季年际变化平稳变化以外, 春、秋、冬三季在20世纪80年代末, 20世纪90年代末与21世纪初均存在较大波动。冬季边界层高度近30年逐渐增加, 特别是在21世纪初的大幅持续增加值得重视。
(3) 春季青藏高原海拔大于5000 m的高原腹地正处于积雪融化时期, 积雪融化带走地表热量, 促使春季地表温度更低, 边界层高度春季与地表温度呈负相关, 同时夏季相对湿度最小梯度与边界层高度很好的对应, 这是边界层高度在春季比夏季更高的可能原因之一。边界层高度发展最高时, 高原边界层内通常为上升运动与下沉运动交替, 为边界层发展提供一定的动力条件。
边界层作为连接地表与自由大气的重要介质, 对其高度变化特征进行统计分析有助于学者更加清晰的研究其内物质的传输。本文旨在详细分析青藏高原边界层高度的日变化特征, 包括日变化的季节变化、年代变化与年际变化, 对其明显特征的成因及影响边界层高度发展的动力机制研究尚不足, 有待进一步研究。并且本文使用的新再分析资料可能存在一些对高原适用性问题, 已尽量做了文献调研与资料对比。本文最后一节相对湿度的垂直分布与边界层高度可能存在的对应关系, 是值得进一步研究的科学问题。
Amaya D J, Xie S P, Miller A J, et al. 2015. Seasonality of tropical Pacific decadal trends associated with the 21st century global warming hiatus[J]. J Geophys Res Ocean, 120(10): 6782–6798.
DOI:10.1002/2015JC010906 |
|
An W, Hou S, Hu Y, et al. 2017. Delayed warming hiatus over the Tibetan Plateau[J]. Earth Space Sci, 4(3): 128–137.
DOI:10.1002/2016EA000179 |
|
Ao C O, Waliser D E, Chan S K, et al. 2012. Planetary boundary layer heights from GPS radio occultation refractivity and humidity profiles[J]. J Geophysl Res Atmos, 117(D16): 16117.
DOI:10.1029/2012JD017598 |
|
Bachtiar V S, Davies F, Danson F M. 2014. A combined model for improving estimation of atmospheric boundary layer height[J]. Atmospheric Environment, 98(98): 461–473.
DOI:10.1016/j.atmosenv.2014.09.028 |
|
Baklanov A A, Grisogono B, Bornstein R, et al. 2011. The nature, theory, and modeling of atmospheric planetary boundary layers[J]. Bull Amer Meteor Soc, 92(2): 123–128.
DOI:10.1175/2010BAMS2797.1 |
|
Cai D, You Q, Fraedrich K, et al. 2017. Spatiotemporal temperature variability over the Tibetan Plateau:Altitudinal dependence associated with the global warming hiatus[J]. J Climate, 30(3): 696–684.
DOI:10.1175/JCLI-D-16-0343.1 |
|
Chen X, 2013a. The plateau scale land-air interaction and its connections to troposphere and lower stratosphere[D]. PhD Thesis, ITC Dissertation 237, Faculty of Geo-Information and Earth Observation (ITC), University of Twente, Enschede, The Netherlands.
https://research.utwente.nl/en/publications/the-plateau-scale-land-air-interaction-and-its-connections-to-tro |
|
Chen X, Škerlak, Bojan, et al. 2016. Reasons for the extremely high-ranging planetary boundary layer over the western Tibetan Plateau in winter[J]. J Atmos Sci, 73(5): 2021–2038.
DOI:10.1175/JAS-D-15-0148.1 |
|
Chen X, Añel J A, Su Z, et al. 2013b. The deep atmospheric boundary layer and its significance to the stratosphere and troposphere exchange over the Tibetan Plateau[J]. Plos One, 8(2): e56909.
DOI:10.1371/journal.pone.0056909 |
|
Compton J C, Delgado R, Berkoff T A, et al. 2013. Determination of planetary boundary layer height on short spatial and temporal scales:A demonstration of the covariance wavelet transform in ground-based wind profiler and lidar measurements[J]. J Atmos Ocean Technol, 30(7): 1566–1575.
DOI:10.1175/JTECH-D-12-00116.1 |
|
Engeln A V, Teixeira J. 2013. A planetary boundary layer height climatology derived from ECMWF reanalysis data[J]. J Climate, 26(17): 6575–6590.
DOI:10.1175/JCLI-D-12-00385.1 |
|
England M H, Mcgregor S, Spence P, et al. 2014. Recent intensification of wind-driven circulation in the Pacific and the ongoing warming hiatus[J]. Nature Climate Change, 4(3): 222–227.
DOI:10.1038/nclimate2106 |
|
Fan S J, Fan Q, Yu W, et al. 2011. Atmospheric boundary layer characteristics over the Pearl River Delta, China, during the summer of 2006:measurement and model results[J]. Atmospheric Chemistry & Physics, 11(13): 681–687.
DOI:10.5194/acp-11-6297-2011 |
|
Feng X, Haines K, 2017. Uncertainties and coupled error covariances in the CERA-20C, ECMWF's first coupled reanalysis ensemble[C]//EGU General Assembly Conference. EGU General Assembly Conference Abstracts.
http://adsabs.harvard.edu/abs/2017EGUGA..19.8222F |
|
Guo J, Miao Y, Zhang Y, et al. 2016. The climatology of planetary boundary layer height in China derived from radiosonde and reanalysis data[J]. Atmospheric Chemistry & Physics, 16(20): 13309–13319.
DOI:10.5194/acp-2016-564 |
|
Kosaka Y, Xie S P. 2013. Recent global-warming hiatus tied to equatorial Pacific surface cooling[J]. Nature, 501(7467): 403–407.
DOI:10.1038/nature12534 |
|
Laloyaux P, Balmaseda M, Dee D, et al. 2016. A coupled data assimilation system for climate reanalysis[J]. QuartJ Roy Meteor Soc, 142(694): 65–78.
DOI:10.1002/qj.2629 |
|
Laloyaux P E, de Boisséson Y P, Dahlgren, 2017. CERA-20C: An Earth system approach to climate reanalysis[M/OL]. ECMWF Newsletter No. 150, 25-30.
|
|
Leventidou E, Zanis P, Balis D, et al. 2013. Factors affecting the comparisons of planetary boundary layer height retrievals from CALIPSO, ECMWF and radiosondes over Thessaloniki, Greece[J]. Atmos Environ, 74: 360–366.
DOI:10.1016/j.atmosenv.2013.04.007 |
|
Li Y, Gao W.. 2007. Atmospheric Boundary Layer Circulation on the Eastern Edge of the Tibetan Plateau, China, in Summer[J]. Arctic Antarctic & Alpine Research, 39(4): 708–713.
DOI:10.1657/1523-0430(07-504)[LI]2.0.CO;2 |
|
Ma Y, Wang Y, Wu R, et al. 2009. Recent advances on the study of atmosphere-land interaction observations on the Tibetan Plateau[J]. Hydrol Earth Sys Sci, 13(6): 1103–1111.
DOI:10.5194/hess-13-1103-2009 |
|
Penny S G, Hamill T M. 2017. Coupled data assimilation for integrated earth system analysis and prediction[J]. Bull Amer Meteor Soc, 98(7): 169–172.
DOI:10.1175/BAMS-D-17-0036.1 |
|
Seidel D J, Ao C O, Li K. 2010. Estimating climatological planetary boundary layer heights from radiosonde observations:Comparison of methods and uncertainty analysis[J]. J Geophys Res, 115(D16): 751–763.
DOI:10.1029/2009JD013680 |
|
Sun F, Ma Y, Li M, et al. 2007. Boundary layer effects above a Himalayan valley near Mount Everest[J]. Geophys Res Lett, 34(8): L08808.
DOI:10.1029/2007gl029484 |
|
Sørensen J H, Rasmussen A, Svensmark H. 1996. Forecast of atmospheric boundary-layer height utilised for ETEX real-time dispersion modelling[J]. Phys Chem Earth, 21(5/6): 435–439.
DOI:10.1016/S0079-1946(97)81138-X |
|
Ueno K, Sugimoto S, Tsutsui H, et al. 2012. Role of patchy snow cover on the planetary boundary layer structure during late winter observed in the central Tibetan Plateau[J]. J Meteor Soc Japan, 90: 145–155.
DOI:10.2151/jmsj.2012-C10 |
|
Whiteman C D, Zhong S, Bian X, et al. 2000. Boundary layer evolution and regional-scale diurnal circulations over the and Mexican plateau[J]. J Geophys Res, 105(D8): 10081–10102.
DOI:10.1029/2000JD900039 |
|
Yanai M, Li C. 1994. Mechanism of heating and the boundary layer over the Tibetan Plateau[J]. Mon Wea Rev, 122(2): 305–323.
DOI:10.1175/1520-0493(1994)122<0305:MOHATB>2.0.CO;2 |
|
Yang K, Koike T, Fujii H, et al. 2004. The daytime evolution of the atmospheric boundary layer and convection over the Tibetan Plateau:observations and simulations (regional climate modeling for monsoon system)[J]. J Meteor Soc Japan, 82(6): 1777–1792.
DOI:10.2151/jmsj.82.1777 |
|
Zhang N, Yi C, Branson M, et al. 2008. Evaluation of modeled atmospheric boundary layer depth at the WLEF tower[J]. Agricultural & Forest Meteorology, 148(2): 206–215.
DOI:10.1016/j.agrformet.2007.08.012 |
|
Zhang Y, Gao Z, Li D, et al. 2014. On the computation of planetary boundary layer height using the bulk Richardson number method[J]. Geoscientific Model Development Discussions, 7(3): 4045–4079.
DOI:10.5194/gmd-7-2599-2014 |
|
Zhang Y, Seidel D J, Zhang S. 2013. Trends in planetary boundary layer height over Europe[J]. J Climate, 26(24): 10071–10076.
DOI:10.1175/JCLI-D-13-00108.1 |
|
Zuo H, Yinqiao H U, Li D, et al. 2005. Seasonal transition and its boundary layer characteristics in Anduo area of Tibetan Plateau[J]. Progress in Natural Science (Materials International), 15(3): 239–245.
DOI:10.1080/10020070512331342050 |
|
李茂善, 戴有学, 马耀明, 等. 2006. 珠峰地区大气边界层结构及近地层能量交换分析[J]. 高原气象, 25(5): 807–813.
Li M S, Dai Y X, Ma Y M, et al. 2006. Analysis on structure of atmospheric boundary layer and energy exchange of surface layer over Mount Qomolangma region[J]. Plateau Meteor, 25(5): 807–813.
DOI:10.3321/j.issn:1000-0534.2006.05.006 |
|
李照国, 吕世华, 文莉娟, 等. 2016. 一次干冷空气过境对鄂陵湖地区大气边界层过程的影响[J]. 高原气象, 35(5): 1200–1211.
Li Z G, Lü S H, Wen L J, et al. 2016. Influence of incursion of dry cold air on atmospheric boundary layer process in Ngoring Lake Basin[J]. Plateau Meteor, 35(5): 1200–1211.
DOI:10.7522/j.issn.1000-0534.2015.00076 |
|
王学忠, 胡邦辉, 李昀英. 2011. 基于ERA40资料的边界层厚度气候特征分析[J]. 气象科学, 31(3): 339–346.
Wang X Z, Hu B H, Li Y Y. 2011. An analysis of planetary boundary layer depth climatic features based on ERA 40 dataset[J]. J Meteor Sci, 31(3): 339–346.
DOI:10.3969/j.issn.1009-0827.2011.03.014 |
|
万云霞, 张宇, 张瑾文, 等. 2017. 感热变化对东亚地区大气边界层高度的影响[J]. 高原气象, 36(1): 173–182.
Wan Y X, Zhang Y, Zhang J W, et al. 2017. Influence of sensible heat on planetary boundary layer height in East Asia[J]. Plateau Meteor, 36(1): 173–182.
DOI:10.7522/j.issn.1000-0534.2016.00001 |
|
赵采玲, 吕世华, 韩博, 等. 2016. 夏季巴丹吉林沙漠残余层与深厚对流边界层的关系研究[J]. 高原气象, 35(4): 1004–1014.
Zhao C L, Lü S H, Han B, et al. 2016. Relationship between the convective boundary layer and residual layer over Badain Jaran Desert in summer[J]. Plateau Meteor, 35(4): 1004–1014.
DOI:10.7522/j.issn.1000-0534.2015.00080 |
|
赵艳茹, 张珂铨, 毛文茜, 等. 2017. 100年来东亚和北非干旱半干旱区边界层高度的变化特征研究[J]. 高原气象, 36(5): 1304–1314.
Zhao Y R, Zhang K Q, Mao W Q, et al. 2017. Boundary layer height's variation characteristics research of arid and semiarid areas over East Asia and North Africa in recent 100 years[J]. Plateau Meteor, 36(5): 1304–1314.
DOI:10.7522/j.issn.1000-0534.2016.00107 |
|
卓嘎, 徐祥德, 陈联寿. 2002. 青藏高原边界层高度特征对大气环流动力学效应的数值试验[J]. 应用气象学报, 13(2): 163–169.
Zhuo G, Xu X D, Chen L S. 2002. Dynamical effect of boundary layer characteristics of Tibetan Plateau on general circulation[J]. J Appl Meteor, 13(2): 163–169.
DOI:10.3969/j.issn.1001-7313.2002.02.004 |
2. Civil Aviation Flight University of China, Guanghan 618307, Sichuan, China
 2018, Vol. 37
