2. 中国科学院青藏高原研究所, 北京 100101;
3. 中国科学院兰州文献情报中心, 甘肃 兰州 730000;
4. 中国科学院大学, 北京 100049
区域和流域尺度的陆面、水文和生态模拟与同化, 都需要高分辨率的大气近地表层风、温、压、湿、辐射、降水等资料作为驱动, 通常称这一类数据为大气驱动数据(李新等, 2010)。陆面过程模型可以预测和重现在特定时间、特定区域内地表与大气之间物质和能量的交换过程, 而模型所需的近地表大气驱动数据的质量直接影响其模拟陆面状态的能力, 因此, Cosgrove et al (2003)在介绍北美陆面同化系统驱动数据时, 强调驱动数据的重要性, 指出驱动数据的重要性不亚于陆面过程模型的选择。
全球气候模式(GCM)输出来驱动陆面过程模型是大尺度陆面过程模型驱动数据的重要来源(Amel, 1999; Miller et al, 1994; Nijssen et al, 2001), 但是对于流域尺度的陆面过程模型而言, GCM输出的大气驱动数据在空间和时间上的粗分辨率无法满足区域环境影响评价。为了弥补GCM在流域尺度陆面过程模拟中的不足, 提出降尺度方法, 即把大尺度、低分辨率的全球气候模式输出信息转化为区域尺度的地面气候变化信息(Wilby et al, 1997)。降尺度方法(Wilby et al, 1997, 2000, 2002)一般分为: (1)包括与全球气候模式嵌套的区域气候模式在内的动力降尺度方法(简称DDS)(Leung et al, 2004); (2)在大尺度气候状态和从历史数据获得的区域变量之间建立统计关系的统计降尺度方法(简称SDS)。
其中, 动力降尺度法基于大尺度的气候背景信息, 通过区域气候模式, 建立更高分辨率的气象变量分布场(Giorgi et al, 1996)。区域气候模式被认为是获取高分辨率局地气候信息的有效动力降尺度方法(李艳等, 2009), 它建立在大尺度与区域尺度要素之间非线性作用的基础上, 模式的物理意义明确, 能够刻画出由于局地地形、植被覆盖和土壤水文过程等产生的局地中尺度特征(Giorgi et al, 1989; Hong et al, 1999), 提升对区域与局地要素的描述。但是动力降尺度方法对计算机性能也提出了很高的要求。随着计算机硬件和软件的高速发展, 基于动力降尺度方法为区域和流域尺度制备长序列高时空分辨率的近地表大气驱动数据成为可能。
黑河流域是我国的第二大内陆河, 面积共计约14.3×10⁴ km2(Li et al, 2013), 东邻石羊河流域, 西连疏勒河流域, 南部为祁连山区, 北部到中蒙边界, 是西风带、青藏高原季风、东南季风三个大气环流系统的耦合区。从上游到下游分布了冰川、积雪、冻土、森林、草原、绿洲和荒漠等丰富多样的自然景观。自然和人文过程交汇在一起, 使黑河流域成为开展流域综合集成研究的一个十分理想的试验流域。在观测方面, 黑河流域已成为我国内陆河研究的基地, 具有了较为完善的观测网络和各种科学研究与实验积累下来的大量资料; 同模型方面, 在基金委黑河流域生态-水文过程集成研究计划下, 发展了很多精细刻画黑河流域下垫面信息的陆面模型, 其中包括上游考虑冻融积雪水文过程的生态-水文模型和中游考虑人工灌溉过程的地下水地表水交互模型。这些在黑河流域发展的陆面模型急需精细化的近地表大气网格数据进行驱动, 同时在黑河流域积累的观测资料为近地表大气驱动数据的制备提供了很好的验证资料。本文基于区域天气模式WRF(Weather Research and Forecasting)对全球预报系统(GFS)每天四次1°×1°的再分析资料进行动力降尺度分析, 生成黑河流域2000—2016年逐时0.05度的大气近地表驱动数据, 为黑河流域的水循环和生态-水文-经济模型集成研究提供重要的基础数据支持。
2 数据生产方法WRF模式是一个中尺度天气预报模式, 由美国环境预测中心NCEP, 美国国家大气研究中心NCAR等科研机构联合开发的气象模式, 于2000年面世。WRF模式为完全可压缩以及非静力模式, 采用F90语言编写。水平方向采用Arakawa C网格点, 垂直方向则采用地形跟随质量坐标, 即地面为1, 模式顶为0。在时间积分方案上, WRF模式使用Rung-Kutta的3阶方案。
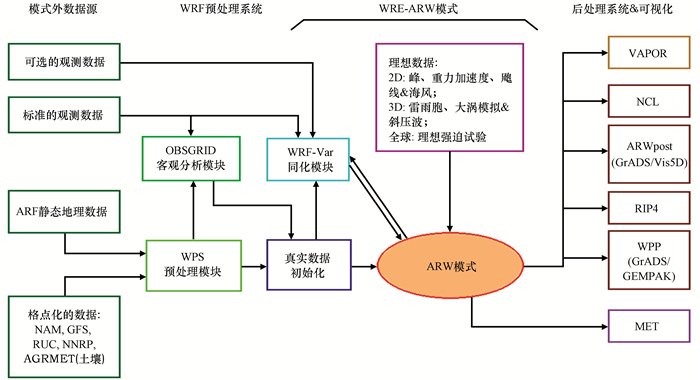
同时, 为使研究成果能够迅速地应用到现实的天气预报中, WRF模式分为ARW(the Advanced Research: ARW/WRF)研究用和NMM(the Nonhydrostatic Mesoscale Model: NMM/WRF)业务用两种形式, 分别由NCEP和NCAR管理维持。ARW模式系统在过去的数年中发展成具有可移植性、易读性、扩展性、可维护性、运行结构性和互用性等特点, 并且有效地应用于各种操作系统。ARW组成包括模式的预处理系统(WPS)、WRF-ARW主模块和WRF模式的后处理系统(ARW_post)以及WRF-Var同化模块(后两个模块可选)。WRF的研究用ARW(Advanced Research WRF)模式适用于从公里到成千上万公里尺度的各种天气系统的模拟, 它的功能包括: (1)理想化模拟(如: LES, 对流, 斜压波); (2)参数化研究; (3)数据同化研究; (4)预报研究; (5)实时数值天气预报; (6)耦合模式应用。
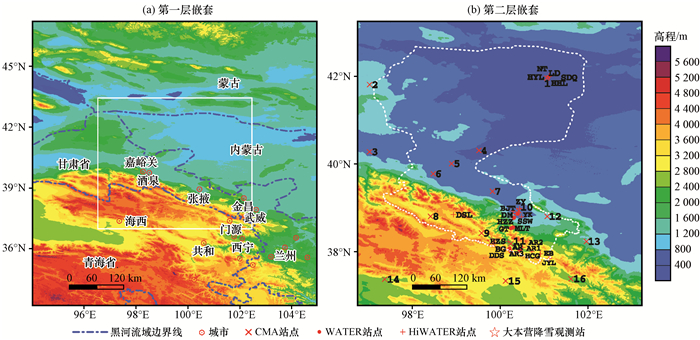
在WRF模式的预处理(WPS)部分, 本套资料采用全球预报系统(GFS)的输入数据FNL(Final Operational Global Analysis)全球分析资料为模式的初始数据。资料来源于国家气象中心数值预报室和美国大气研究中心(NCAR)的数据支持部, 每天发布4次, 每次预报时效为384 h (16天), 时间间隔为3~6 h, NCEP-FNL的数据水平格距为1°, 水平方向共360×181个格点, 垂直方向分为地表层和从1 000~10 hPa共26个等压层, 有海平面气压、表面温度、海冰等9个单层变量和位势高度、温度、东西风分量、南北风分量、相对湿度共5个全层次变量, 而静态地理数据则根据嵌套方案(双层嵌套, 分别为0.25°和0.05°, 第二层嵌套包含整个黑河流域), 将分别指向‘10分’(即1/6度)和‘30秒’不同分辨率的数据。同时, 为了提高模拟精度, 我们使用更真实的下垫面资料(潘小多等, 2012), 包括高精度的黑河流域数字高程模型、土地覆盖分类数据(Ran et al, 2012)和土壤质地分类数据(Lu et al, 2017)等下垫面静态资料。
|
图 1 WRF-ARW的工作流程图译自ARW Version 3 Modeling System User’s Guide (NCAR, 2017) Fig. 1 Framework of ARW translated from ARW Version 3 Modeling System User's Guide (NCAR, 2017) |
定义的黑河领域范围(图 2)是中心经纬度为100°E、40 °N, 东西向最里层嵌套的格点数为120, 南北向最里层嵌套的格点数为130, 采用经纬度投影方式。
|
图 2 WRF模式在黑河流域模拟的嵌套配置 Fig. 2 Nesting domain configuration for numerical experiment |
本文所采用的物理过程配置方案见表 1。
| 表 1 黑河流域近地表大气驱动数据的WRF模式配置 Table 1 WRF configuration for Heihe River Basin |
黑河流域2000—2016年逐时0.05°近驱动数据包括2 m气温、地表气压、2 m水汽混合比、辐射、10 m风场、向下短波辐射、向上长波辐射和累积降水等近地表数据。投影方式为经纬度投影。数据采用逐月存储方式, 时间格式为世界时, 数据格式为NETCDF, 命名方式: wrfout_heihe_yyyy_mm_01.nc, 其中“wrfout_heihe_”是固定格式, 代表第二层嵌套(范围为整个黑河流域)的结果, yyyy是年份, mm是月份, “01”代表每个月从01号开始。变量名称和对应的含义见表 2。
| 表 2 黑河流域驱动数据的变量名称和含义 Table 2 Variables' name and meaning of atmospheric forcing data for Heihe River Basin |
表 2中, Time为一个月的小时数(如1月份为744 h, 4月份为720 h), south_north为纬向格点数(130), west_east为经向格点数(120)。
4 数据质量控制与精度检验与15个国家气象局(China Meteorological Ad-ministration, CMA)站点逐日观测资料和两期黑河流域生态-水文过程综合遥感观测联合试验(Heihe Watershed Allied Telemetry Experimental Research, WATER & HiWATER)(Li et al, 2009, 2013)的站点观测资料及大本营站点降雪观测资料(验证的站点信息请见表 3)进行逐日和逐时的检验, 由于观测点与模拟格点之间存在代表性误差问题, 所以为了尽可能检查代表性误差, WRF模式模拟温度、气压、降水等资料都进行了由模拟格点插值到观测点之后再进行比较(Pan et al, 2011, 2012)。同时观测降水普遍存在低测现象, 所以在评估WRF模式模拟的降水资料之前, 进行了降水观测资料的质量校正工作(Pan et al, 2015)。
| 表 3 黑河流域的验证站点及验证时段 Table 3 Station names and time spans |
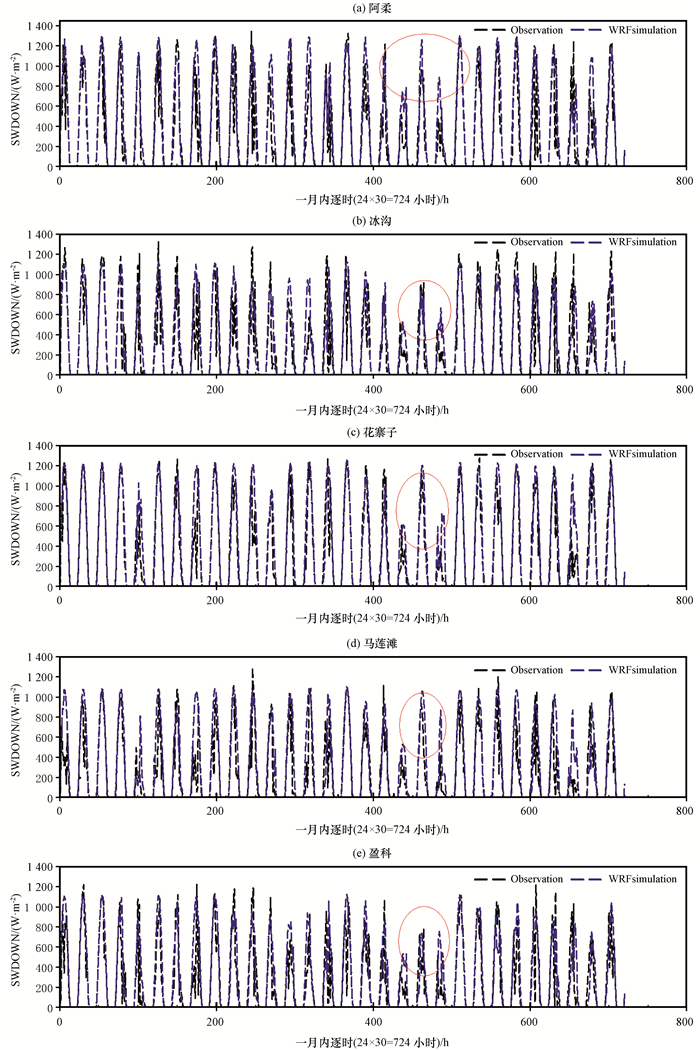
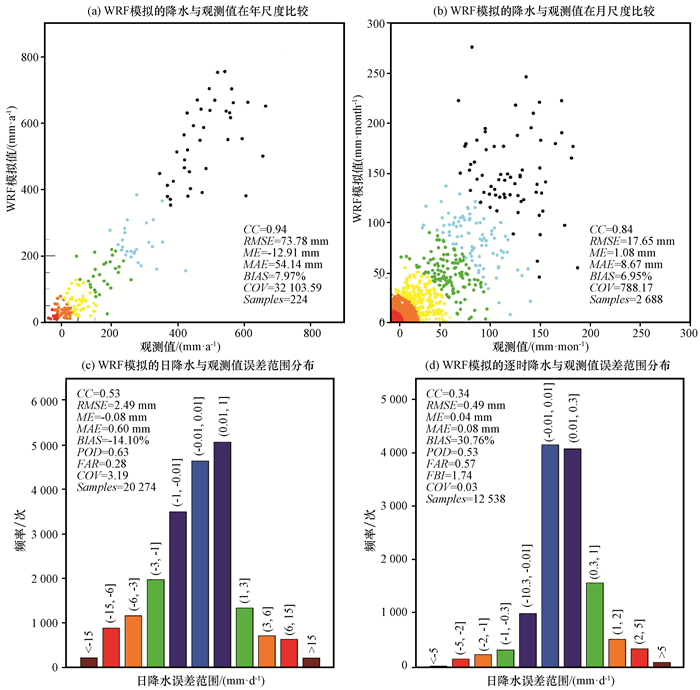
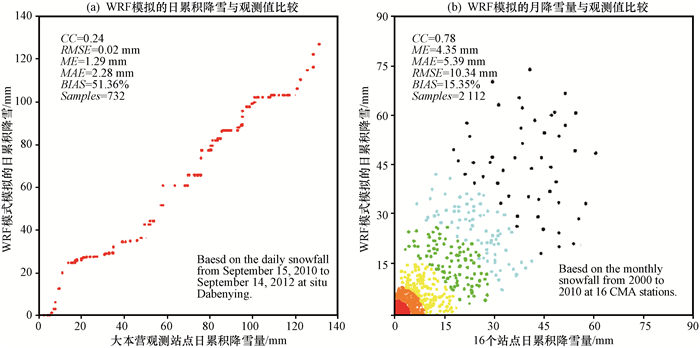
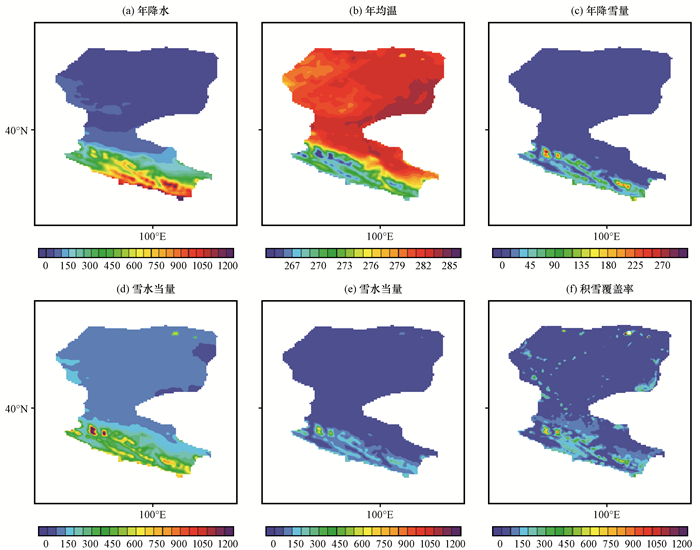
检验结果表明2 m地表气温、地表气压和相对湿度都是比较可信的, 尤其是2 m地表气温和地表气压, 平均误差都很小且相关系数都达到0.96以上(表 4); 向下短波辐射与WATER站点观测数据的相关性达到0.9以上, 其中与WATER的逐时观测资料显示WRF模式模拟的向下短波辐射不仅与观测资料日变化相吻合, 而且能够捕捉住云雨天气向下短波辐射骤减的特征(图 3红色圈), 向下长波辐射的相关性也有0.6; 10 m风速都与观测资料相差较大, 相关性也比较弱(表 5)(Pan et al, 2011, 2012)。降水资料通过降雨和降雪两种相态与观测资料在不同时间尺度和空间尺度上进行验证, 降雨与观测资料在年、月、日和时尺度上吻合得很好, 与观测资料在年和月尺度上的相关系数高达0.94和0.84, 在日尺度上相关系数达到0.53(图 4); 降雪与观测资料在月尺度上的相关性达到0.78, 逐日降雪资料与观测资料在时间序列上趋势较吻合(图 5)与积雪覆盖率MODIS遥感产品的空间分布相当吻合, 峰值分布也一致(图 6)。液态和固态降水的验证表明WRF模式能够在地形复杂而干旱的黑河流域进行降尺度分析, 所模拟的资料能够满足流域尺度水文建模和水资源平衡研究。
| 表 4 2000—2015年WRF模拟的近地表温度、气压、相对湿度和风场与黑河流域CMA站点的平均误差、均方根误差和相关系数 Table 4 The MBE, RMSE and R of variables between WRF simulation and CMAobservation over the HRB from 2000 to 2015 |
|
图 3 WRF模式模拟的2008年6月短波辐射和WATER站点观测资料的曲线 Fig. 3 Comparison of hourly downward short wave radiation between WRF simulating and WATER observed data in June 2008 |
| 表 5 2008—2015年WRF模拟的近地表温度、气压、相对湿度、风场、短波辐射和长波辐射与黑河流域WATER站点的平均误差、均方根误差和相关系数 Table 5 The MBE, RMSE and R of variables between WRF simulation and WATER situ observation over the HRB from 2008 to 2015 |
|
图 4 WRF模式模拟的黑河流域降水资料与观测资料的误差分析(Pan et al, 2015) Fig. 4 Error analysis for the precipitation between the WRF model and observations (from Pan et al, 2015) |
|
图 5 WRF模拟的黑河流域降雪资料和逐日观测数据的比较(Pan et al, 2017) Fig. 5 Comparison of daily snowfall between the WRF simulation and observational data at the Dabenying site (a) and CMA stations (b) (from Pan et al, 2017) |
|
图 6 WRF模拟的黑河流域年(2008年)雨、温度和雪相关变量与MODIS的积雪覆盖率(FSC)空间分布对比(Pan et al, 2017) Fig. 6 Comparison of spatial distribution between WRF simulation and Fractional Snow Cover extracted by MODIS remote sensing (from Pan et al, 2017) |
黑河流域2000—2016年高时空分辨率近地表大气驱动数据集可以在中国寒区旱区科学数据中心网站(http: //westdc.westgis.ac.cn)通过搜索“黑河流域驱动数据”进而下载。可以采用NCL分析工具或者ERDAS遥感处理软件进行查看和分析。其中变量名称与表 2一致。使用过程中请参考并引用本文。WRF模式所模拟的黑河流域近地表大气驱动数据, 能够应用于黑河流域水循环和生态-水文-经济集成模型研究。
版权声明:数据版权归数据作者及所在单位所有, 但不存在利益冲突。
Amel N. 1999. The effect of climate change on hydrological regimes in Europe:A continental perspective[J]. Global Environmental Change, 9: 5–23.
DOI:10.1016/S0959-3780(98)00015-6 |
|
Cosgrove B A, Lohmann D, Mitchell K E, et al. 2003. Real-time and retrospective forcing in the North American Land Data Assimilation System (NLDAS) project[J]. Journal of Geophysical Research, 108(D22): 3-1–12.
DOI:10.1029/2002JD003118 |
|
Giorgi F, Mearns I, Oshields C, et al. 1996. A regional model study of the importance of the 1998 drought and the l993 flood over the central Unite States[J]. Climate, 9: 1150–1162.
DOI:10.1175/1520-0442(1996)009<1150:ARMSOT>2.0.CO;2 |
|
Giorgi F, Bates T. 1989. The climatological skill of a regional model over complex terrain[J]. Monthly Weather Review, 117: 2325–2347.
DOI:10.1175/1520-0493(1989)117<2325:TCSOAR>2.0.CO;2 |
|
Hong S Y, Juang H H, Lee D K. 1999. Evaluation of a regional spectral model for the East Asian monsoon case studies for July 1987 and 1988[J]. Journal of the Meteorology Society of Japan, 77: 553–572.
DOI:10.2151/jmsj1965.77.2_553 |
|
Leung L R, Qian Y, Bian X, et al. 2004. Mid-Century Ensemble Regional Climate Change Scenarios for the Western United States[J]. Climate Change, 62: 75–113.
DOI:10.1023/B:CLIM.0000013692.50640.55 |
|
Li X, Cheng G D, Liu S M, et al. 2013. Heihe Watershed Allied Telemetry Experimental Research (HiWATER):Scientific objectives and experimental design[J]. Bullet of American Meteorological Society, 94: 1145–1160.
DOI:10.1175/BAMS-D-12-00154.1 |
|
Li X, Li X W, Li Z Y, et al. 2009. Watershed Allied Telemetry Experimental Research[J]. Journal of Geophysical Research, 114(D22): D22103.
DOI:10.1029/2008JD011590 |
|
Lu L, Liu C, Li X, et al. 2017. Mapping the soil texture in theHeihe River Basin based on fuzzy logic and data fusion[J]. Sustainability, 9(7): 1246.
DOI:10.3390/su9071246 |
|
Miller J, Russell G, Caliri G. 1994. Continenta1 scale river flow in climate models[J]. Journal of Climate, 7: 914–928.
DOI:10.1175/1520-0442(1994)007<0914:CSRFIC>2.0.CO;2 |
|
National Center for Atmospheric Research (NCAR), 2017. Weather Research And Forecasting Model System User's Guide[EB/OL]. https://www.mmm.ucar.edu/weather-research-and-forecasting-model.
|
|
Nijssen B, O'Donnell G M, Lettenmaier D P, et al. 2001. Predicting the discharge of global rivers[J]. Journal of Climate, 14: 3307–3323.
DOI:10.1175/1520-0442(2001)014<3307:PTDOGR>2.0.CO;2 |
|
Pan X D, Li X. 2011. Validation of WRF model on simulating forcing data for Heihe River Basin[J]. Sciences in Cold and Arid Regions, 3(4): 344–357.
|
|
Pan X D, Li X, Cheng G D, et al. 2015. Development and evaluation of a river-basin-scale high spatio-temporal precipitation data set using the WRF model:a case study of the Heihe River Basin[J]. Remote Sensing, 7(7): 9230–9252.
DOI:10.3390/rs70709230 |
|
Pan X D, Li X, Cheng G D, et al. 2017. Impact analysis of climate change on snowfall and fractional snow cover over a complex mountainous region using a numerical model and remote sensing products[J]. Remote Sensing, 9(8): 774.
DOI:10.3390/rs9080774 |
|
Pan X D, Li X, Shi X K, et al. 2012. Dynamic Downscaling of Near-Surface Air Temperature at a basin scale using the WRF-with A Case Study in the Heihe River Basin, China[J]. Frontier of Earth Science, 6(3): 314–323.
DOI:10.1007/s11707-012-0306-2 |
|
Ran Y H, Li X, Cheng G D, et al. 2012. Distribution of Permafrost in China-An Overview of Existing Permafrost Maps[J]. Permafrost andPeriglacial Processes, 23: 322–333.
DOI:10.1002/ppp.1756 |
|
Wilby R L, Wigley T M. 1997. Downscaling general circulation model output:a review of methods and limitations[J]. Progress in Physical Geography, 21: 530–548.
|
|
Wilby R L, Wigley T M. 2000. Precipitation Predictors for downscaling:Observed and General Circulation Model Relationships[J]. International Journal of Climatology, 20(5): 641–661.
|
|
Wilby R L, Dawson C W, Barrow E M. 2002. SDSM-a decision support tool for the assessment of regional climate change impact[J]. Environmental Modeling and Software, 17: 145–157.
DOI:10.1016/S1364-8152(01)00060-3 |
|
李新, 吴立宗, 马明国, 等. 2010. 数字黑河的思考与实践2:数据集成[J]. 地球科学进展, 25(3): 306–316.
|
|
李艳, 汤剑平, 王元, 等. 2009. 区域风能资源评价分析的动力降尺度研究[J]. 气候与环境变化, 14(2): 192–200.
|
|
潘小多, 李新, 冉有华, 等. 2012. 下垫面对WRF模式模拟黑河流域区域气候精度影响研究[J]. 高原气象, 31(3): 657–667.
|
2. Institute of Tibetan Plateau Research, Chinese Academy of Sciences, Beijing 100101, China;
3. Lanzhou Library of Chinese Academy of Sciences, Lanzhou 730000, Gansu, China;
4. University of Chinese Academy of Sciences, Beijing 100049, China
 2019, Vol. 38