 PDF(6770 KB)

The Possible Influence of Arctic Sea Ice on the Precipitation Distribution Pattern of July in East of Northwest China
Dai WANG, Jianling YANG, Wen ZHANG, Yang MA, Xin LI, Suyan WANG
PDF(6770 KB)
The Possible Influence of Arctic Sea Ice on the Precipitation Distribution Pattern of July in East of Northwest China
Using the observed precipitation data of 154 meteorological stations in East of Northwest China, NCEP/NCAR atmosphere reanalysis and Arctic sea ice data from 1961 to 2020, the possible impacts and mechanisms of the key area Arctic sea ice on the main distribution mode of precipitation in July during the main flood season in East of Northwest China was analyzed using SVD and other climatic statistic methods.The results show that there are two mainly sea ice modes influencing the distribution pattern of precipitation anomaly in July in East of Northwest China.One is that when the sea ice density in the Barents Sea and the Kuril Islands is relatively small (large), and that in Davis Strait is relatively large (small), wave trains propagating southeastward from the Davis Strait and southwestward from the Sea of Okhotsk are stimulated, resulting in the anomaly field of "high in the west and low in the east" ("low in the west and high in the east") at the 500 hPa geopotential height anomaly field over the East of Northwest China, which leads to the regional precipitation anomaly exhibiting a "consistent less (more)" pattern.The other is that when the sea ice density in the eastern part of the Beaufort Sea is relatively small, the wave train from the Caspian Sea to the Okhotsk Sea is stimulated and matched with the positive geopotential height anomaly over South China, making the cold air path eastward and southward, as well as the subtropical high stronger, which together lead to the precipation characterized by "less in the north and more in the south", on the contrary, the pattern of precipitation anomaly is reversed.The prediction model, which is established with sea ice in key areas as the prediction factors derived by “SVD projection method”, has certain prediction ability for grasping the precipitation anomaly trend and the spatial distribution pattern of the main flood season in July in East of Northwest China, especially for the "regional consistent less type" and "north more and south less type".
East of Northwest China / precipitation in flood season / Arctic Sea ice / prediction model {{custom_keyword}} /
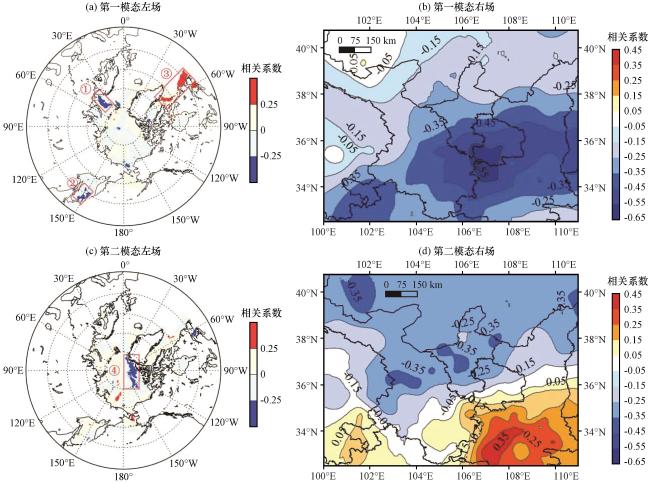
Fig.2 Hetero-correlation of SVD between spring sea ice density and precipitation in July over East of Northwest China.In Fig.2(a) and (c), the ①、 ②、 ③、 ④ indicates the first and second mode sea ice key areas, respectively图2 春季(3 -5月)北极海冰密集度场与7月西北地区东部降水场的SVD异性相关系数 图(a)(c)中①、 ②、 ③、 ④分别表示第一、 二模态海冰关键区 |
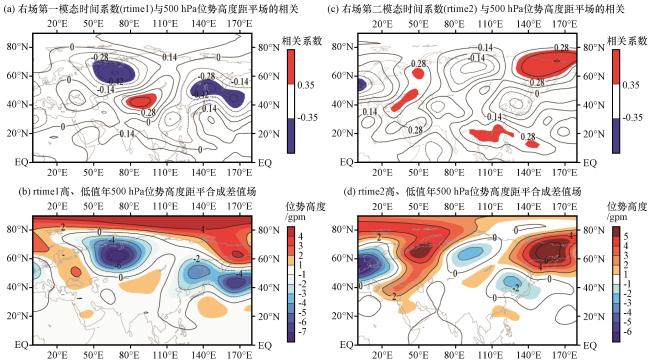
Fig.6 Distribution of correlation coefficients between rtime1 (a) and rtime2 (c) with 500 hPa geopotential height anomaly field respectively from 1991 to 2020 (contour represents correlation coefficient, the colore area represents passing 95% confidence level), and composite difference field of 500 hPa geopotential height anomaly (contour and color area, unit: gpm) in high and low value years of rtime1 (b) and rtime2 (d)图6 1991 -2020年右场第一模态时间系数(rtime1, a)、 右场第二模态时间系数(rtime2, c)分别与500 hPa位势高度距平场的相关系数分布(等值线代表相关系数, 彩色区域代表通过了95%置信度检验)及rtime1(b)、 rtime2(d)高、 低值年500 hPa位势高度距平合成差值场(等值线和彩色区域, 单位: gpm) |
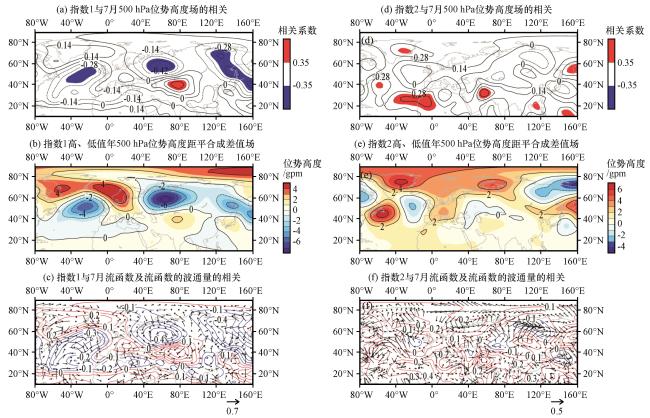
Fig.7 The correlation between index 1 (a, c) and index 2 (d, f) with the 500 hPa potential height field (contour represents correlation coefficient, the colore area represents passing 95% confidence level) and flow function [isoline, red (blue) lines represent positive (negative) values] as well as the wave flux of the flow function (vector), and composite difference field of 500hPa geopotential height anomaly (contour and color area, unit: gpm) in high and low value years of index 1 (b) and index 2 (e) of July from 1991 to 2020图7 1991 -2020年指数1(a、 c)、 指数2(d、 f)分别与7月500 hPa位势高度场(等值线代表相关系数, 彩色区域代表通过95%置信度检验)和7月流函数[等值线, 红(蓝)色表示正(负)值]及流函数的波通量(矢量)的相关, 指数1(b)、 指数2(e)高、 低值年500 hPa位势高度距平合成差值场(等值线和彩色区域, 单位: gpm) |
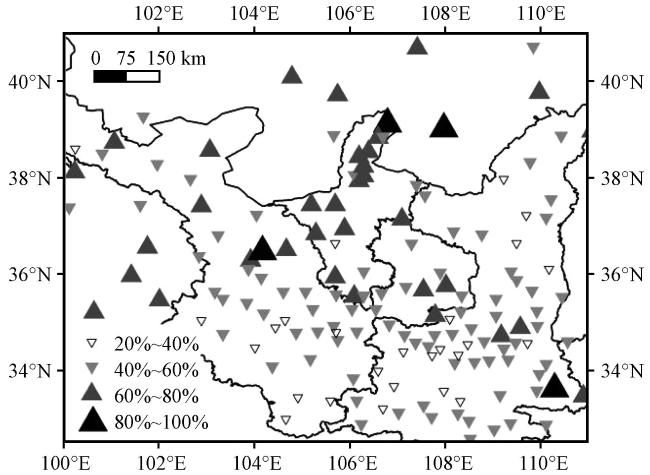
Fig.8 Spatial distribution of anomaly symbol consistency rate (PC) by precipitation prediction model from 2011 to 2020.Unit: %图8 2011 -2020年降水模型预测的距平符号一致率(PC)空间分布(单位: %) |
Table 1 Capability test of precipitation prediction model from 2011 to 2020表1 2011 -2020年逐年降水模型预测水平检验 |
| 年份 | 2011 | 2012 | 2014 | 2015 | 2016 | 2017 | 2018 | 2019 | 2020 |
|---|---|---|---|---|---|---|---|---|---|
| 降水分布型 | 北少南多 | 北多南少 | 以少为主 | 一致少 | 北多南少 | 北多南少 | 一致多 | 不典型 | 北少南多 |
| ACC | 0.17 | 0.51 | 0.56 | 0.31 | 0.22 | -0.01 | 0.04 | -0.02 | 0.07 |
| PC/% | 52 | 40 | 81 | 92 | 60 | 65 | 42 | 70 | 54 |
|
{{custom_citation.content}}
{{custom_citation.annotation}}
|
|
{{custom_citation.content}}
{{custom_citation.annotation}}
|
|
{{custom_citation.content}}
{{custom_citation.annotation}}
|
|
{{custom_citation.content}}
{{custom_citation.annotation}}
|
|
{{custom_citation.content}}
{{custom_citation.annotation}}
|
|
{{custom_citation.content}}
{{custom_citation.annotation}}
|
|
{{custom_citation.content}}
{{custom_citation.annotation}}
|
|
{{custom_citation.content}}
{{custom_citation.annotation}}
|
|
陈冬冬, 戴永久, 2009.近五十年中国西北地区夏季降水场变化特征及影响因素分析[J].大气科学, 33(6): 1247-1258.
{{custom_citation.content}}
{{custom_citation.annotation}}
|
|
丁旭, 赖欣, 范广洲, 2022.青藏高原春季土壤湿度异常与我国夏季降水的联系[J].高原气象, 41(1): 24-34.DOI: 10.7522/j.issn.1000-0534.2020.00094.Ding X ,
{{custom_citation.content}}
{{custom_citation.annotation}}
|
|
丁一汇, 孙颖, 刘芸芸, 等, 2013.亚洲夏季风的年际和年代际变化及其未来预测[J].大气科学, 37(2): 253-280.
{{custom_citation.content}}
{{custom_citation.annotation}}
|
|
符淙斌, 马柱国, 2008.全球变化与区域干旱化[J].大气科学, 32(4): 752-760.
{{custom_citation.content}}
{{custom_citation.annotation}}
|
|
韩笑笑, 孟宪红, 赵林, 等, 2023.“北极放大”现象驱动因素及其影响的研究进展综述[J].高原气象, 42(1): 1-12.DOI: 10.7522/j.issn.1000-0534.2022.00029.Han X X ,
{{custom_citation.content}}
{{custom_citation.annotation}}
|
|
李栋梁, 魏丽, 蔡英, 等, 2003.中国西北现代气候变化事实与未来趋势展望[J].冰川冻土, 25(2): 135-142.
{{custom_citation.content}}
{{custom_citation.annotation}}
|
|
李明, 孙洪泉, 苏志诚, 2021.中国西北气候干湿变化研究进展[J].地理研究, 40(4): 1180-1194.
{{custom_citation.content}}
{{custom_citation.annotation}}
|
|
李耀辉, 李栋梁, 赵庆云, 等, 2004.ENSO循环对西北地区夏季气候异常的影响[J].高原气象, 23(6): 930-935.
{{custom_citation.content}}
{{custom_citation.annotation}}
|
|
刘颖, 范可, 张颖, 2013.基于CFS模式的中国站点夏季降水统计降尺度预测[J].大气科学, 37(6): 1287-1296.
{{custom_citation.content}}
{{custom_citation.annotation}}
|
|
刘玉芝, 吴楚樵, 贾瑞, 等, 2018.大气环流对中东亚干旱半干旱区气候影响研究进展[J].中国科学(地球科学), 48(9): 1141-1152.
{{custom_citation.content}}
{{custom_citation.annotation}}
|
|
马鹏里, 杨金虎, 卢国阳, 等, 2020.西北地区东部气候的转折性变化[J].高原气象, 39(4): 840-850.DOI: 10.7522/j.issn.1000-0534.2019.00093.Ma P L ,
{{custom_citation.content}}
{{custom_citation.annotation}}
|
|
马柱国, 符淙斌, 2001.中国北方干旱区地表湿润状况的趋势分析[J].气象学报, 59(6): 737-746.
{{custom_citation.content}}
{{custom_citation.annotation}}
|
|
任宏利, 张培群, 李维京, 等, 2004.中国西北东部地区春季降水及其水汽输送特征[J].气象学报, 62(3): 365-374.
{{custom_citation.content}}
{{custom_citation.annotation}}
|
|
施雅风, 沈永平, 胡汝骥, 2002.西北气候由暖干向暖湿转型的信号、影响和前景初步探讨[J].冰川冻土, 24(3): 219-226.
{{custom_citation.content}}
{{custom_citation.annotation}}
|
|
施雅风, 沈永平, 李栋梁, 等, 2003.中国西北气候由暖干向暖湿转型的特征和趋势探讨[J].第四纪研究, 23(2): 152-164.
{{custom_citation.content}}
{{custom_citation.annotation}}
|
|
王岱, 王素艳, 王璠, 等, 2021.宁夏夏季极端高温变化特征及其与北极海冰的关系[J].干旱区研究, 38(5): 1285-1294.
{{custom_citation.content}}
{{custom_citation.annotation}}
|
|
王可丽, 江灏, 赵红岩, 2005.西风带与季风对中国西北地区的水汽输送[J].水科学进展, 16(3): 432-438.
{{custom_citation.content}}
{{custom_citation.annotation}}
|
|
王素艳, 纳丽, 王璠, 等, 2021.海冰和海温对西北地区中部6月降水异常的协同影响[J].干旱区地理, 44(1): 63-72.
{{custom_citation.content}}
{{custom_citation.annotation}}
|
|
王天竺, 赵勇, 2021.青藏高原和热带印度洋5月热力异常与新疆夏季降水的关系[J].高原气象, 40(1): 1-14.DOI: 10.7522/j.issn.1000-0534.2020.00003.Wang T Z ,
{{custom_citation.content}}
{{custom_citation.annotation}}
|
|
王芝兰, 李耀辉, 王劲松, 等, 2015.SVD分析青藏高原冬春积雪异常与西北地区春、夏季降水的相关关系[J].干旱气象, 33(3): 363-370.
{{custom_citation.content}}
{{custom_citation.annotation}}
|
|
魏凤英, 2007.现代气候统计诊断与预测技术[M].北京: 气象出版社.Wei F Y, 2007.Modern climate statistical diagnosis and prediction technology[M].Beijing: China Meteorological Press.
{{custom_citation.content}}
{{custom_citation.annotation}}
|
|
吴遥, 唐红玉, 刘颖, 等, 2020.统计降尺度方法在华西南区秋季降水预测中的应用[J].气象, 46(12): 1555-1564.
{{custom_citation.content}}
{{custom_citation.annotation}}
|
|
武炳义, 黄荣辉, 高登义, 2001.北极海冰的厚度和面积变化对大气环流影响的数值模拟[J].气象学报, 59(4): 414-428.
{{custom_citation.content}}
{{custom_citation.annotation}}
|
|
杨建玲, 2007.热带印度洋海表面温度异常对亚洲季风区大气环流的影响研究[D].青岛: 中国海洋大学.Yang J L, 2007.Study on the influence of tropical Indian Ocean surface temperature anomalies on the atmospheric circulation in the Asian monsoon region[D].Qingdao: Ocean University of China.
{{custom_citation.content}}
{{custom_citation.annotation}}
|
|
杨建玲, 李艳春, 穆建华, 等, 2015.热带印度洋海温与西北地区东部降水关系研究[J].高原气象, 34(3): 690-699.DOI: 10. 7522/j.issn.1000-0534.2014.00010.Yang J L ,
{{custom_citation.content}}
{{custom_citation.annotation}}
|
|
杨建玲, 刘秦玉, 2008.热带印度洋SST海盆模的“充电/放电”作用-对夏季南亚高压的影响[J].海洋学报, 30(2): 1-8.
{{custom_citation.content}}
{{custom_citation.annotation}}
|
|
杨金虎, 张强, 刘晓云, 等, 2019.中国典型夏季风影响过渡区夏季降水异常时空特征及成因分析[J].地球物理学报, 62(11): 4120-4128.
{{custom_citation.content}}
{{custom_citation.annotation}}
|
|
尹航, 黄菲, 陈峥, 等, 2022.1980-2019年夏季东亚大槽减弱及其与北极海冰变化的关系[J].中国海洋大学学报(自然科学版), 52(11): 24-33.
{{custom_citation.content}}
{{custom_citation.annotation}}
|
|
张强, 朱飙, 杨金虎, 等, 2021.西北地区气候湿化趋势的新特征[J].科学通报, 66(28/29): 3757-3771.
{{custom_citation.content}}
{{custom_citation.annotation}}
|
|
张雯, 马阳, 王素艳, 等, 2023.西北地区东部春夏季旱涝转换环流特征及其与大西洋海温的关系[J].干旱气象, 41(1): 14-24.
{{custom_citation.content}}
{{custom_citation.annotation}}
|
| {{custom_ref.label}} |
{{custom_citation.content}}
{{custom_citation.annotation}}
|
PDF(6770 KB)
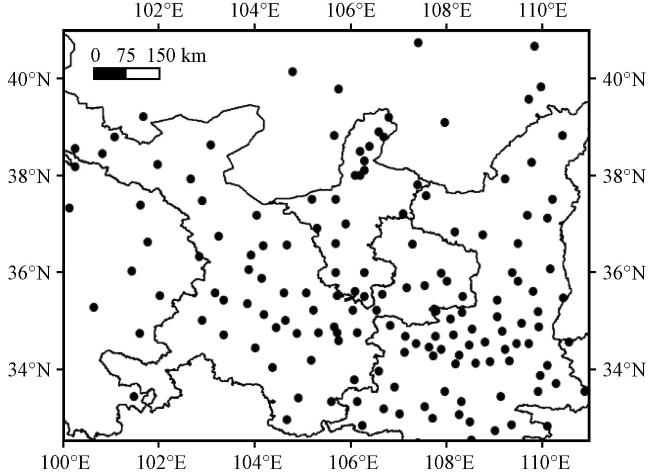
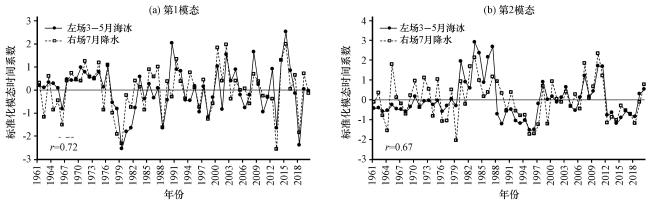
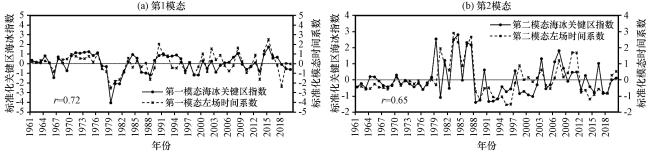
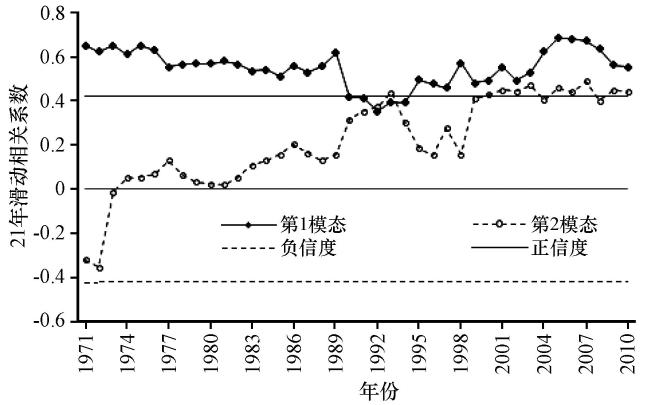
 Fig.1 Spatial distribution of the meteorological stations in East of Northwest ChinaFig.2 Hetero-correlation of SVD between spring sea ice density and precipitation in July over East of Northwest China.In Fig.2(a) and (c), the ①、 ②、 ③、 ④ indicates the first and second mode sea ice key areas, respectivelyFig.3 The first (a) and second (b) time coefficients of SVD decomposition of Arctic sea ice density (left field) in spring and precipitation (right field) in East of Northwest China in JulyFig.4 SVD decomposes the left field time coefficient of the first (a) and second (b) modes and the index change sequence of the key area of sea ice in each modeFig.5 The 21-year sliding correlation of sea ice key area index 1 and 2 with the first and second mode time coefficient of the right field, respectivelyFig.6 Distribution of correlation coefficients between rtime1 (a) and rtime2 (c) with 500 hPa geopotential height anomaly field respectively from 1991 to 2020 (contour represents correlation coefficient, the colore area represents passing 95% confidence level), and composite difference field of 500 hPa geopotential height anomaly (contour and color area, unit: gpm) in high and low value years of rtime1 (b) and rtime2 (d)Fig.7 The correlation between index 1 (a, c) and index 2 (d, f) with the 500 hPa potential height field (contour represents correlation coefficient, the colore area represents passing 95% confidence level) and flow function [isoline, red (blue) lines represent positive (negative) values] as well as the wave flux of the flow function (vector), and composite difference field of 500hPa geopotential height anomaly (contour and color area, unit: gpm) in high and low value years of index 1 (b) and index 2 (e) of July from 1991 to 2020Fig.8 Spatial distribution of anomaly symbol consistency rate (PC) by precipitation prediction model from 2011 to 2020.Unit: %
 Table 1 Capability test of precipitation prediction model from 2011 to 2020
/
| 〈 |
|
〉 |
