 PDF(8437 KB)

Research on the Impact of Mountain-Valley Wind on Topographic Precipitation in the Ili River Valley Based on GPM Observations
Zhimin WANG, Wanyue FENG, Jing YANG, Yuanyuan LI, Hui WANG, Yapeng FU
PDF(8437 KB)
Research on the Impact of Mountain-Valley Wind on Topographic Precipitation in the Ili River Valley Based on GPM Observations
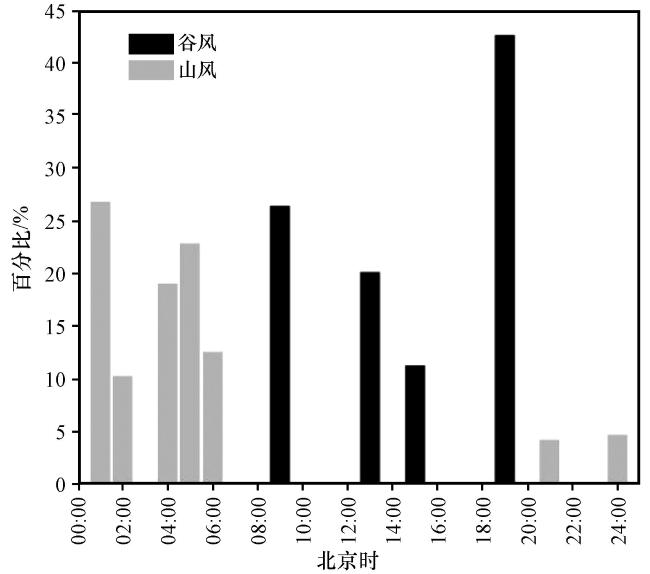
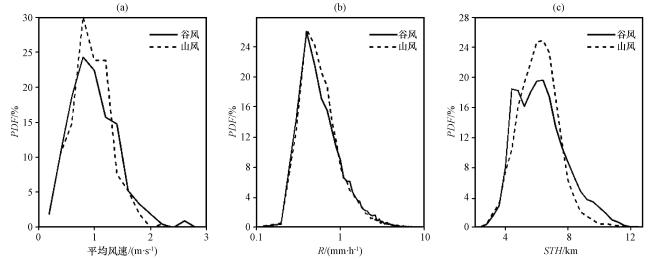
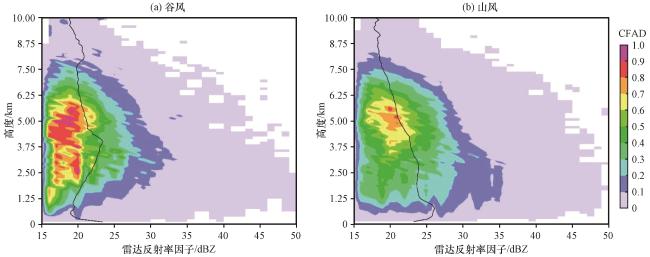
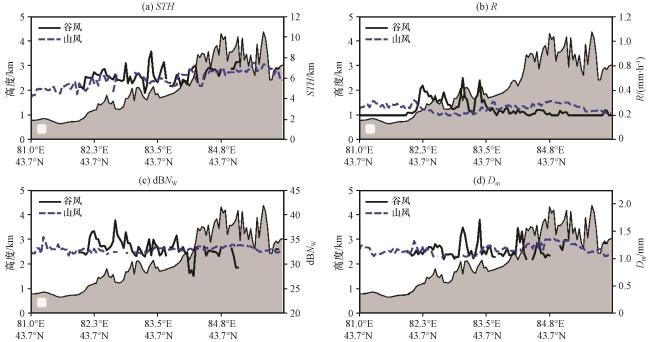
Studying the impact of valley winds on terrain precipitation is crucial for gaining a deeper understanding of the mechanism of precipitation formation under complex terrain conditions.Based on GPM/DPR data from 2014 to 2021, the connected domain method was used to identify the summer terrain precipitation system in the Ili River Valley.Combined with the 10 m surface wind data from ERA5, the precipitation process was divided into valley wind type and mountain wind type.The spatiotemporal distribution, vertical structure, and macro and micro characteristics of precipitation in these two types of "trumpet mouth" terrain were compared and analyzed.The results show that valley wind precipitation is concentrated on the windward slopes of the southern and eastern foothills of the valley, with the precipitation period mainly from noon to evening (12:00 -20:00 Beijing time, same as after).Mountain wind precipitation is more abundant in the valley plain, with more precipitation occurring from night to morning (01:00 -06:00).The average wind speed of valley wind (0.79 m·s-1) is 6.8% higher than that of mountain wind (0.74 m·s-1).The average near surface precipitation rate (R) and rain top height (STH) of valley wind and mountain wind precipitation are 1.32 mm·h-1, respectively 1.15 mm·h-1, 5.90 km, 5.72 km, statistics show a positive correlation between STH and R; Under the influence of uphill winds, the R, STH, mass weighted average diameter (D m), and particle number concentration (dBN w) of valley wind precipitation increase under the influence of terrain uplift, reaching a maximum at an altitude of 2 -3 km.The upwelling airflow formed on the windward slope promotes the condensation and coalescence of cloud droplets into raindrops; The average dBN w of valley wind precipitation (33.5) is nearly 3% smaller than that of mountain wind precipitation (34.5), while the average Dm of the former (1.63 mm) is 18.1% larger than that of the latter (1.38 mm).Due to the lower radar reflectivity factor of mountain winds compared to valley winds in the liquid phase region below 0 ℃, when raindrops descend to the dry layer near the ground, the large droplets break and evaporate, resulting in more dBN w and smaller D m.Valley winds affect the macroscopic structure and microphysical processes of terrain precipitation.In future research on identifying the potential of terrain cloud artificial precipitation enhancement and numerical simulation of fine structure of precipitation in mountainous areas, attention should be paid to the role and dynamic mechanism of valley winds.
Ili River Valley / rain cell / surface wind / GPM/DPR {{custom_keyword}} /
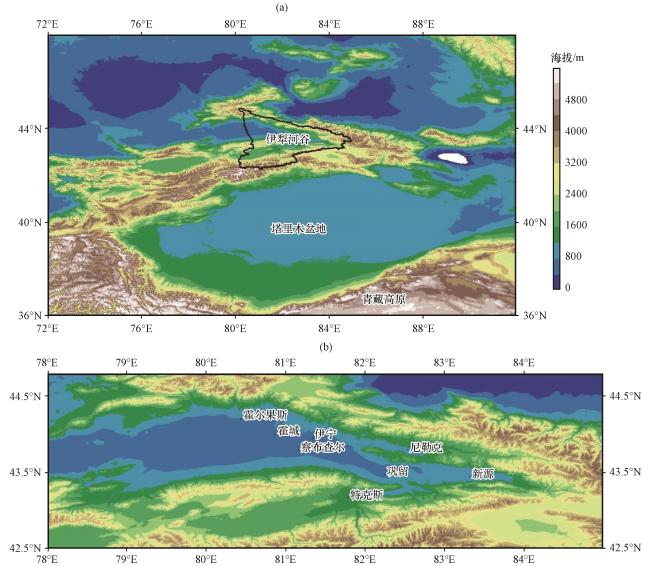
Fig.1 Ili River Valley Topography (a, unit: m) and distribution of meteorological stations (b)图1 伊犁河谷地形(a, 单位: m)及气象站点分布(b) |
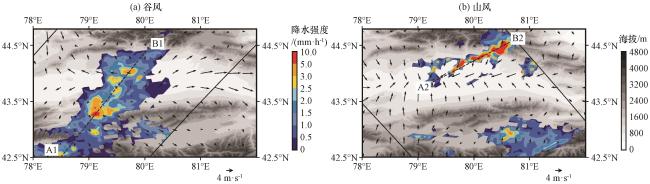
Fig.3 R distribution of mountain-valley wind RC.(a) valley wind, (b) mountain wind.The dotted line is the section position, the solid black line is the track width, and the vector arrow represents wind field vector (unit: m·s-1)图3 山谷风RC的R分布(a)谷风, (b)山风; 虚线为剖面位置, 黑色实线为轨道宽度, 矢量箭头为风场矢量(单位: m·s-1) |
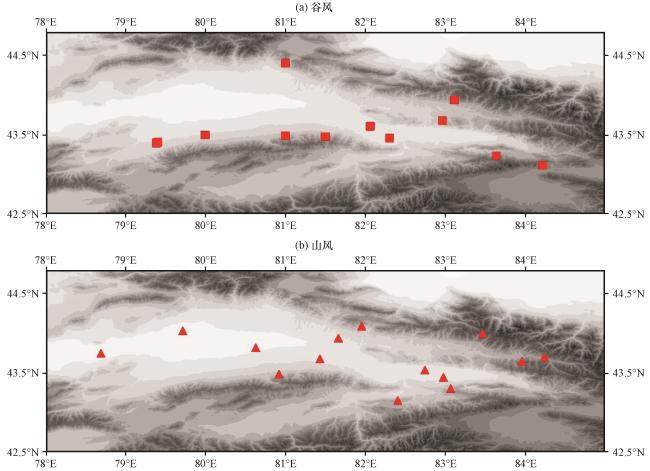
Fig.5 Spatial distribution of mountain-valley wind RC.(a) valley wind, (b) mountain wind.Blocks and triangles represent valley and mountain wind precipitation respectively图5 山谷风RC的空间分布(a)谷风, (b)山风; 方块和三角形分别为谷风和山风类降水 |
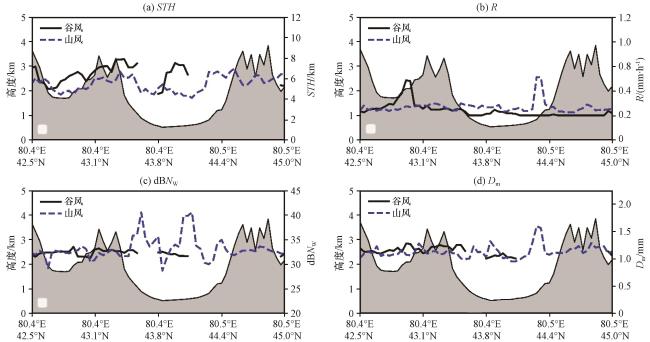
Fig.10 Radial average distribution of different parameters of mountain-valley wind RC.(a) STH, (b) R, (c) dBN w, (d) D m.The grey shaded denotes terrain height图10 山谷风降水不同参量径向平均分布(a)STH, (b)R, (c)dBN w, (d)D m; 灰色阴影表示地形高度 |
|
{{custom_citation.content}}
{{custom_citation.annotation}}
|
|
{{custom_citation.content}}
{{custom_citation.annotation}}
|
|
{{custom_citation.content}}
{{custom_citation.annotation}}
|
|
{{custom_citation.content}}
{{custom_citation.annotation}}
|
|
{{custom_citation.content}}
{{custom_citation.annotation}}
|
|
{{custom_citation.content}}
{{custom_citation.annotation}}
|
|
{{custom_citation.content}}
{{custom_citation.annotation}}
|
|
{{custom_citation.content}}
{{custom_citation.annotation}}
|
|
{{custom_citation.content}}
{{custom_citation.annotation}}
|
|
{{custom_citation.content}}
{{custom_citation.annotation}}
|
|
{{custom_citation.content}}
{{custom_citation.annotation}}
|
|
{{custom_citation.content}}
{{custom_citation.annotation}}
|
|
{{custom_citation.content}}
{{custom_citation.annotation}}
|
|
{{custom_citation.content}}
{{custom_citation.annotation}}
|
|
{{custom_citation.content}}
{{custom_citation.annotation}}
|
|
{{custom_citation.content}}
{{custom_citation.annotation}}
|
|
{{custom_citation.content}}
{{custom_citation.annotation}}
|
|
{{custom_citation.content}}
{{custom_citation.annotation}}
|
|
{{custom_citation.content}}
{{custom_citation.annotation}}
|
|
{{custom_citation.content}}
{{custom_citation.annotation}}
|
|
{{custom_citation.content}}
{{custom_citation.annotation}}
|
|
{{custom_citation.content}}
{{custom_citation.annotation}}
|
|
{{custom_citation.content}}
{{custom_citation.annotation}}
|
|
{{custom_citation.content}}
{{custom_citation.annotation}}
|
|
{{custom_citation.content}}
{{custom_citation.annotation}}
|
|
{{custom_citation.content}}
{{custom_citation.annotation}}
|
|
{{custom_citation.content}}
{{custom_citation.annotation}}
|
|
{{custom_citation.content}}
{{custom_citation.annotation}}
|
|
{{custom_citation.content}}
{{custom_citation.annotation}}
|
|
{{custom_citation.content}}
{{custom_citation.annotation}}
|
|
{{custom_citation.content}}
{{custom_citation.annotation}}
|
|
{{custom_citation.content}}
{{custom_citation.annotation}}
|
|
{{custom_citation.content}}
{{custom_citation.annotation}}
|
|
{{custom_citation.content}}
{{custom_citation.annotation}}
|
|
黄美元, 洪延超, 1984.在梅雨锋云系内层状云回波结构及其降水的不均匀性[J].气象学报(1): 80-87.DOI: 10.11676/qxxb1984.008.Huang M Y , Hong Y C, 1984.Heterogeneity of layered cloud echo structure and precipitation within the Meiyu front cloud system[J].Acta Meteorologica sinica (1): 80-87.DOI: 10.11676/qxxb1984.008 .
{{custom_citation.content}}
{{custom_citation.annotation}}
|
|
刘艳霞, 文军, 谢晓林, 2024.青藏高原中东部和四川盆地的夏季雨滴谱对比分析研究[J].高原气象, 43(1): 28-41.DOI: 10.7522/j.issn.1000-0534.2023.00033.Liu Y X ,
{{custom_citation.content}}
{{custom_citation.annotation}}
|
|
沈程锋, 李国平, 2022.基于GPM资料的四川盆地及周边地区夏季地形降水垂直结构研究[J].高原气象, 41(6): 1532-1543.DOI: 10.7522/j.issn.1000-0534.2021.0116.Shen C F ,
{{custom_citation.content}}
{{custom_citation.annotation}}
|
|
王思懿, 隆霄, 李超, 等, 2022.祁连山夏季两类地形降水过程的环流特征及成因分析[J].高原气象, 41(3): 593-603.DOI: 10.7522/j.issn.1000-0534.2021.00102.Wang S Y ,
{{custom_citation.content}}
{{custom_citation.annotation}}
|
|
王倩倩, 权建农, 程志刚, 等, 2022.2019年冬季北京海陀山局地环流特征及机理分析[J].气象学报, 80(1): 93-107.DOI: 10.11676/qxxb2022.005.Wang Q Q ,
{{custom_citation.content}}
{{custom_citation.annotation}}
|
|
魏栋, 刘丽伟, 田文寿, 等, 2021.基于卫星资料的西北地区高原涡强降水分析[J].高原气象, 40(4): 829-839.DOI: 10.7522/j.issn.1000-0534.2021.000021.Wei D ,
{{custom_citation.content}}
{{custom_citation.annotation}}
|
|
吴进, 李琛, 马志强, 等, 2022.延庆地区山谷风对PM_(2.5)浓度的影响[J].中国环境科学, 42(1): 61-67.DOI: 10.19674/j.cnki.issn1000-6923.20210824.004.Wu J ,
{{custom_citation.content}}
{{custom_citation.annotation}}
|
|
乌日柴胡, 王建捷, 孙靖, 等, 2019.北京山区与平原冬季近地面风的精细观测特征[J].气象学报, 77(6): 1107-1123.DOI: 10.11676/qxxb2019.059.Wu R C H ,
{{custom_citation.content}}
{{custom_citation.annotation}}
|
|
李嗣源, 郭学良, 唐洁, 等, 2023.青藏高原东南局地山谷风环流在一次地形云和降水形成中的作用[J].大气科学, 47(5): 1576-1592.DOI: 10.3878/j.issn.1006-9895.2202.21257.Li S Y ,
{{custom_citation.content}}
{{custom_citation.annotation}}
|
|
钟水新, 2020.地形对降水的影响机理及预报方法研究进展[J].高原气象, 39(5): 1122-1132.DOI: 10.7522/j.issn.1000-0534.2019.00083.Zhong S X , 2020.Research progress on the influence mechanism and forecasting method of topography on precipitation[J].Plateau Meteorology, 39(5): 1122-1132.DOI: 10.7522/j.issn.1000-0534.2019.00083 .
{{custom_citation.content}}
{{custom_citation.annotation}}
|
|
郑祚芳, 任国玉, 高华, 2018.北京地区局地环流观测分析[J].气象, 44(3): 425-433.DOI: 10.7519/j.issn.1000-0526.2018.03.009.Zheng Z F ,
{{custom_citation.content}}
{{custom_citation.annotation}}
|
| {{custom_ref.label}} |
{{custom_citation.content}}
{{custom_citation.annotation}}
|
PDF(8437 KB)
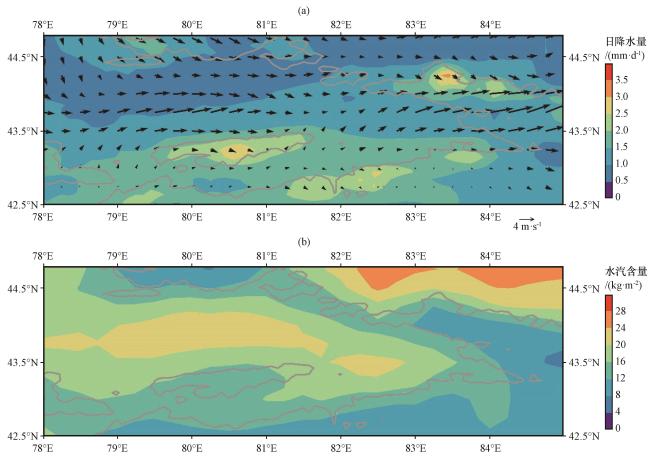
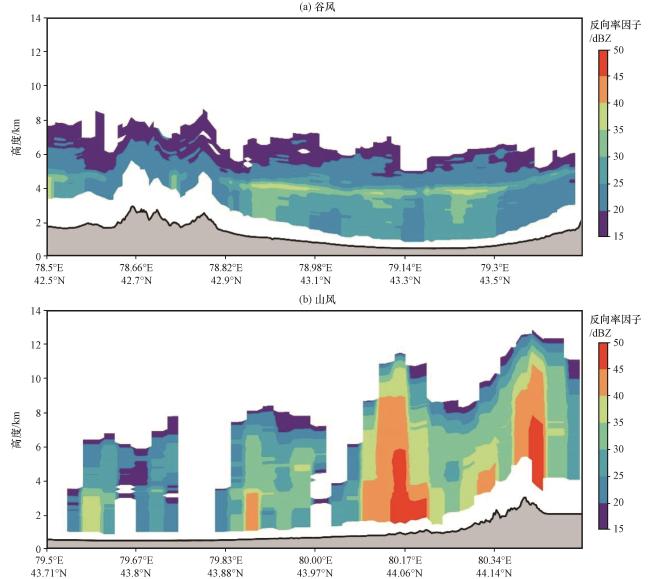
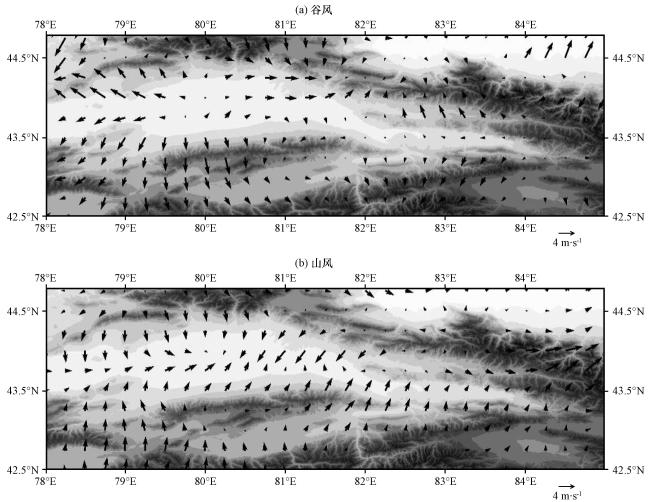
 Fig.1 Ili River Valley Topography (a, unit: m) and distribution of meteorological stations (b)Fig.2 Average daily precipitation (a, unit: mm·d-1) and column water vapor content (b, unit: kg·m-2) in Ili River ValleyFig.3 R distribution of mountain-valley wind RC.(a) valley wind, (b) mountain wind.The dotted line is the section position, the solid black line is the track width, and the vector arrow represents wind field vector (unit: m·s-1)Fig.4 Vertical profiles of Z for mountain-valley wind RC (taken from left to right along A-B lines in Fig.3).(a) valley wind, (b) mountain windFig.5 Spatial distribution of mountain-valley wind RC.(a) valley wind, (b) mountain wind.Blocks and triangles represent valley and mountain wind precipitation respectivelyFig.6 Vector distribution of surface wind in mountain-valley wind RC.Unit: m·s-1.(a) valley wind, (b) mountain windFig.7 Diurnal variations of mountain-valley wind RCFig.8 PDF distribution of mean wind speed (a), R (b) and STH (c) of mountain-valley wind RCFig.9 CFAD distribution of Z for mountain-valley wind RC.(a) valley wind, (b) mountain windFig.10 Radial average distribution of different parameters of mountain-valley wind RC.(a) STH, (b) R, (c) dBN w, (d) D m.The grey shaded denotes terrain heightFig.11 Latitudinal average distribution of different parameters of mountain-valley wind RC.(a) STH, (b) R, (c) dBN w, (d) D m.The grey shaded denotes terrain height
/
| 〈 |
|
〉 |
