Comparisons of Cloud Top Parameter of FY‑4A Satellite and its Typhoon Application Research

  • Linli CUI , 1, 2 ,
  • Wei GUO 1 ,
  • Weiqiang GE 1 ,
  • Yafei YAN 1 ,
  • Shuang LUO 1
Expand
  • 1. Shanghai Ecological Forecasting and Remote Sensing Center, Shanghai  200030, China
  • 2. Shanghai Key Laboratory of Meteorology and Health, Shanghai  200030, China

Received date: 2019-05-06

  Revised date: 2019-07-19

  Online published: 2020-02-28

Highlights

Clouds reflect the dynamic of atmosphere and the thermal processing. Parameters such as cloud top temperature and cloud top height are significant for diagnosing the intensity of weather system and convection development, and they are important roles in weather analysis, numerical forecast and aviation meteorology. Fengyun‑4 (FY‑4A) satellite is the second generation of stationary meteorological satellite independently developed by China. Compared with the Fengyun‑2(FY‑2) meteorological satellite, FY‑4A satellite's performance has been significantly improved. For example, the observation channels has been expanded from 5 to 14, the observation time of the whole disk image has been shortened from 0.5 h to 15 min, and the maximum spatial resolution has been improved from 1.25 km to 0.5 km. Therefore, FY‑4A satellite's products have been increased 160 times than FY‑2 satellite's. As the first satellite of scientific experiments, FY‑4A is mainly used to validate new technologies and develop new applications. In order to evaluated and analyzed the accuracy of FY‑4A satellite's products during the period of typhoons processes near the coastal area of Southeast China in 2018, three main products have been compared with the polar orbiting meteorology satellite of American EOS/MODIS's products and the second generation geostationary meteorological satellite of Japanese Himawari‑8's products, including cloud top height (CTH), cloud top temperature (CTT) and cloud top pressure (CTP). The results indicated that the cloud top parameters obtained from FY‑4A satellite had a high linear correlation with MODIS and Himawari‑8 products as a whole. FY‑4A was highly linearly correlated with MODIS, and the correlation coefficient was above 0.98, and the overall mean bias was the smallest. Particularly, in the typhoon center and eye wall area with deep and dense cloud, the mean bias of inter‑satellite results was obviously reduced. For example, FY‑4 A differed from himawari ‑8 by 0.78 ºC in CTT, 30 m in CTH and 0.2 hPa in CTP at the center of typhoon, and the mean bias between FY‑4A and MODIS or the mean bias between Himawari‑8 and MODIS was also small. Therefore, the quality of FY‑4A cloud top parameters is reliable; the precision of FY‑4A satellite's cloud products is comparable to those of MODIS and Himawari‑8 satellites, which is suitable for analyzing typhoon's deep cloud structure. The reason for the bias was initially analyzed as the influence of the existence of transparent thin cirrus clouds and small‑scale clouds, which were related to the spatial resolution of different instruments, cloud detection ability of different instruments and cloud detection algorithm and so on.

Cite this article

Linli CUI , Wei GUO , Weiqiang GE , Yafei YAN , Shuang LUO . Comparisons of Cloud Top Parameter of FY‑4A Satellite and its Typhoon Application Research[J]. Plateau Meteorology, 2020 , 39(1) : 196 -203 . DOI: 10.7522/j.issn.1000-0534.2019.00065

1 引言

云是大气水汽凝结的产物, 是大气动力和热力过程的表现(Goloub et al, 2000)。云顶温度和云顶高度等参数可以诊断天气系统和对流发展的强度, 在天气分析、 数值预报及航空气象等方面都具有重要的价值(Chahine, 1974; 吕达仁等, 2003; 陈渭民, 2003; 李典等, 2012; 陈英英等, 2013), 同时这些云产品还是生成其他下游产品(如云类型、 云光学、 微物理、 辐射)的先决条件(王胜杰等, 2010; 张志清等, 2017)。卫星能够提供多时次、 大范围、 连续性的云微物理探测信息(范思睿等, 2018; 徐小红等, 2018), 自1960年第一颗气象卫星发射之后, 气象学家就一直没有停止过利用气象卫星进行云的观测和研究(Hasler et al, 1983; Schreiner et al, 2001; Platnick et al, 2003; Hamada et al, 2008; Yu et al, 2009; Marchand et al, 2010; 刘健等, 2011; Yang et al, 2012), 国内外很多卫星都具备各种云产品反演能力并对产品的可靠性进行了验证(Frey et al, 1999; Hawkinson et al, 2005; Naud et al, 2006; Bedka et al, 2007; Dong et al, 2008; Smith et al, 2008; Kim et al, 2011; Lavanant et al, 2011; Wang et al, 2018; 周毓荃等, 2008; 曹芸等, 2012; 樊宏杰等, 2017)。因EOS/MODIS资料易于获取、 精度高, 在天气应用和产品的对比分析研究中得到广泛应用(Platnick et al, 2003; 刘忠等, 2005; Dong et al, 2008; Marchand et al, 2010; 曹芸等, 2012)。
风云四号(FY‑4A)卫星, 是中国自主研发的第二代静止气象卫星, 于2016年12月11日成功发射。该卫星通过采用多项先进技术(Yang et al, 2016; 董瑶海, 2016; 陆风等, 2017), 比第一代静止气象卫星(风云二号, FY‑2)在性能上得到了显著提升, 如观测通道从FY‑2卫星的5个扩展到14个(张鹏等, 2016), 全圆盘图像观测时间从0.5 h缩短到15 min, 最高空间分辨率从1.25 km提高到0.5 km。因此, FY‑4A卫星生成的产品是目前运行的FY‑2卫星的160倍(张志清等, 2017)。作为科学实验首发星, FY‑4A主要用途是验证新技术, 发展新应用。为了更好地将FY‑4A产品应用于天气分析和数值预报, 非常有必要对其产品精度开展对比分析和评价。
鉴于此, 选取2018年7 -8月影响我国东南沿海地区的3个台风个例, 即: 1810安比(Ampil)、 1812云雀(Jongdari)和1818温比亚(Rumbia), 对台风影响期间的FY‑4A卫星云顶高度(CTH)、 云顶温度(CTT)和云顶气压(CTP)产品, 与美国EOS/MODIS和日本Himawari‑8的同类产品进行了交叉检验分析, 以科学评估FY‑4A云顶参数的精度及其在台风监测中的适应性及可靠性。研究结果可以为我国风云卫星研制设计以及气象卫星相关技术参数改进提供用户反馈和科学参考, 从而提高风云卫星在灾害性天气监测与预警中应用水平, 减少人民生命财产损失。

2 数据获取及处理

FY‑4A云顶高度(CTH)、 云顶温度(CTT)和云顶气压(CTP)产品均来自于国家卫星气象中心, 其云顶参数反演原理既集成了FY‑2可见光红外扫描仪, 同时也参考了GOES‑R的算法(Schmit et al, 2005; Min et al, 2017)。具体反演流程是先利用FY‑4A多通道扫描成像辐射计(AGRI)的两个红外窗区(11.2 µm, 12.4 µm)和1个CO2吸收通道(13.3 µm), 通过对CO2及红外通道的辐射传输计算及经过1D‑VAR迭代处理, 反演生成有云像元处的CTT产品; 然后通过中国气象局数值预报中心开发的T639提供的温度廓线资料, 再求得对应的CTH和CTP产品。该产品空间分辨率为4 km, 更新频次为10 min, 数据格式为NC, 命名规范为FY4A‑_AGRI‑‑_N_DISK_1047E_ L2‑_CTH‑_MULT_NOM_扫描时间_4000M_V0001.NC。数据采用CGMS LRIT/HRIT全球规范定义的静止轨道标称投影, 地理坐标可基于WGS84 参考椭球计算或通过FY4标称网格文件查找表获取。
Himawari‑8卫星是日本第二代气象卫星的首发星, 其光谱通道数和时空分辨率都较上一代静止卫星都有很大提升(王宏斌等, 2018), 可通过自建的Himawari‑8卫星广播系统对其数据进行接收并生成一系列产品, 其中云顶参数产品由国家卫星气象中心和北京华云星地通科技有限公司联合开发, 算法开发团队同时也是FY‑4A产品攻关小组, 因此, 反演流程与FY‑4A一致, 通道选用与FY‑4A/AGRI相近的两个红外窗区(10.8 µm, 12.0 µm)和1个CO2吸收通道(13.5 µm), 但温度廓线来自美国的GFS(Global Forecasting System, GFS)数值预报系统。该产品空间分辨率为4 km, 更新频次10 min, 生成格式为HDF, 命名规范为Himawari08_AHI_L2_ Cloud_扫描时间.hdf, 地理坐标获取方法同FY‑4A。
MODIS云产品首先通过我国风云三号地面应用系统进行接收和预处理生成1B数据, 然后利用美国威斯康星-麦迪逊大学(University of Wisconsin‑Madison, USA)的气象卫星研究联合会(Cooperative Institute for Meteorological Satellite Studies, CIMSS)开发的处理软件包IMAPP(International MODIS/ARIS Processing Package)系统生成。该系统主要利用CO2切片法反演得出, 并对半透明云辐射进行了校正, 其温度廓线同样来自美国的GFS数值预报系统。空间分辨率1 km, 更新频次24 h, 数据格式为HDF, 通过商用遥感软件ENVI的地图投影功能获取其准确的地理位置, 并对各产品进行物理量转化和质量控制。
为了保证统计分析结果之间具有可比性, 除了在数据的选取时间上高度接近(最大时间差为5 min)外, 还对FY‑4A和Himawari‑8的云产品进行空间格网重采样, 生成与MODIS云产品一致的1 km×1 km, 并再利用中央气象台发布的相近时刻的台风中心位置裁剪成一致的空间范围。

3 评价方法

根据中国人民共和国气象行业标准(QX/T 127-2011), 气象卫星定量产品质量评价指标主要包括: 偏差(BIAS)、 绝对误差(AE)、 相对误差(RE)、 均方根误差(RMSE)、 相关系数(Corr)等(中国气象局, 2011)。为了从空间和量级两方面对不同卫星的反演结果进行对比(刘江涛等, 2019), 选取了纬向的BIAS平均偏差场分析、 相关系数和散点图等直观的分析方法, 各参数计算如下:
平均偏差场(BIAS)的计算公式为:
B I A S = 1 N i = 1 N ( X i - Y i ),
相关系数(Corr)的计算公式为:
C o r r = i = 1 N ( X i - X ¯ ) ( Y i - Y ¯ ) i = 1 N ( X i - X ¯ ) 2 i = 1 N ( Y i - Y ¯ ) 2
式中: N表示匹配样本数量; X表示被检验数据; Y表示检验源数据; X ¯ Y ¯分别表示被检验数据和检验源样本均值。

4 结果分析

4.1 经纬向偏差折线图分析
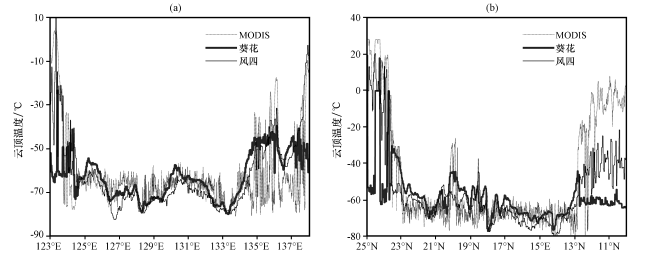
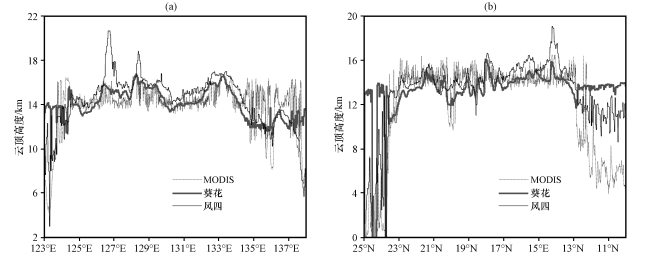
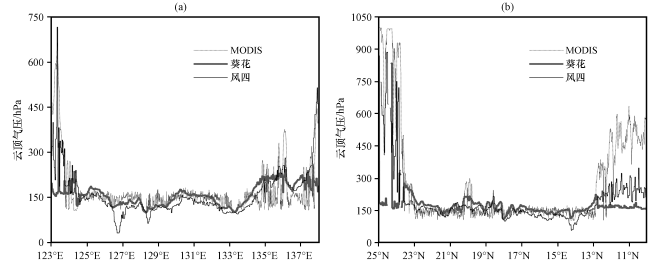
折线图可以很直观地反映不同数据随时间或空间的变化以及不同数据之间的差别。图1图3是2018年7月19日台风“安比”(Ampil)分别沿132°E和16°N基准线获取的云顶参数折线图。在曲线的中间, 三颗卫星的云顶参数分布区域一致, 云顶温度(CTT)大约在-40 ℃以下(图1), 云顶高度(CTH)平均值分布在12~16 km(图2), 云顶气压(CTP)达100~200 hPa(图3), 这与目前对台风云顶特征的共识及CloudSat的类似观测结果都非常接近(史兰红等, 2015; 赵震, 2019), 因此三颗卫星反演结果对实际业务应用具有重要的参考价值。
图1 2018年7月19日不同卫星云顶温度沿经向(a)和纬向(b)的变化

Fig. 1 CTT line chart of different satellites along longitude (a) and latitude (b) on 19 July 2018

图2 2018年7月19日不同卫星云顶高度沿经向(a)和纬向(b)的变化

Fig. 2 CTH line chart of different satellites along longitude (a) and latitude (b) on 19 July 2018

图3 2018年7月19日不同卫星云顶气压沿经向(a)和纬向(b)的变化

Fig. 3 CTP line chart of different satellites along longitude (a) and latitude (b) on 19 July 2018

在曲线的两端, 各卫星反演结果存在较大差异(图1,2,3)。如在经向的125oE以西和135oE以东[图1(a)], FY‑4A和Himawari‑8的云顶温度反演结果普遍高于MODIS, 而在13oN以南和23oN以北地区FY‑4A、 Himawari‑8和MODIS的反演结果各有差异。结合Himawari‑8卫星三通道合成云图[图4(a)]和MODIS的卷云检测产品[图4(b)]可以看出, 差异性较大的像元对应图像上两侧的边缘区, 在MODIS卷云检测图上显示该区域为透明薄卷云、 中低云或晴空小尺度云区, Himawari‑8三通道合成图上大多表现为透明的薄卷云, 在这种情况下, CTH等参数反演将存在无法订正的误差(林琳等, 2006)。受其影响MODIS反演的CTT为-20~20 ℃, CTH为4~6 km, CTP为400~600 hPa; 而Himawari‑8反演的CTT整体偏低, 与中心深厚的密蔽云区近似, 约为-60 ℃, CTH也在12 km以上, CTP在200 hPa; FY‑4A反演结果在经向与MODIS较接近, 在纬向则分布在MODIS和Himawari‑8之间。
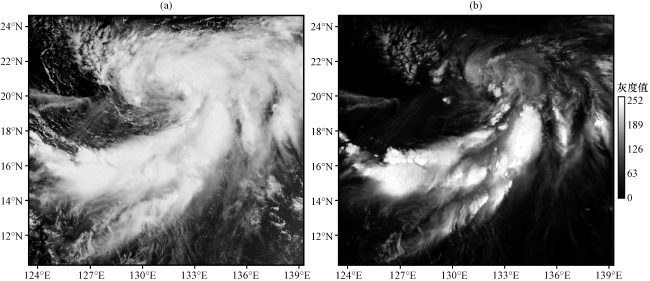
图4 2018年7月19日Himawari‑8云图(a)和MODIS卷云图像(b)对比

Fig. 4 Cloud imagery contrast from Himawari‑8 (a) and MODIS (b) on 19 July 2018

4.2 散点图和整体偏差分析

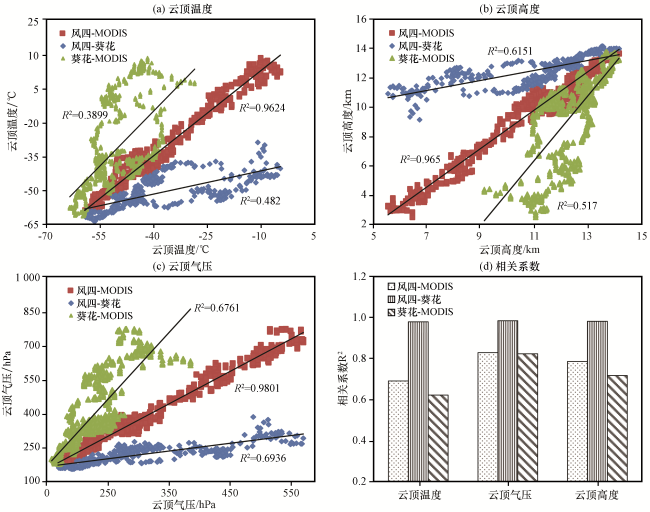
散点图可以清晰地显示两个变量之间的关系和分布趋势, 本文分别针对三个参数进行两两卫星间的散点分布和相关性统计(图5), 可以看出FY‑4A卫星反演的三个云顶参数值与MODIS反演结果高度线性相关[图5(a)], 相关系数均在0.98以上; FY‑4A和Himawari‑8次之, 相关系数在0.69~0.83, Himawari‑8与MODIS最低, 相关系数在0.62~0.82。三个云顶参数CTT差异最大, 相关性最低, CTP一致性最好, 相关性最高。离散分布的点主要在-40~10 ℃的中低云区。
图5 不同卫星云参数相关性分析

Fig. 5 Correlation analysis of cloud top parameters of different satellites

具体分析两两卫星之间各参数的平均偏差(图6)可知, FY‑4A与MODIS反演结果的偏差最小, 其中CTT偏低6 ℃, CTH偏高1.3 km, CTP偏低159 hPa。理论上按照温度梯度大约是每升高100 m温度下降0.65 ℃, 若CTH升高130 m, 则CTT偏低6.0 ℃也接近合理, 但整体偏差绝对值距离实际应用还具有很大的不确定性。因此, 提高中低云区CTT的反演精度是整体反演精度提高的必要前提。
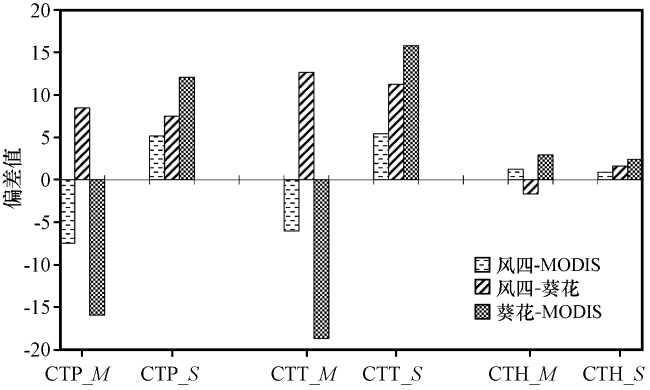
图6 不同卫星云顶参数偏差统计分布

横坐标中M代表均值, S代表标准差

Fig. 6 Distribution of cloud top parameters of differentsatellites. In the x‑coordinate, M represents meanvalue, S represents standard deviation

4.3 台风分区统计分析

台风云系是由深厚的云层结构组成, 且具有明显的水平分布特征。因此, 开展台风云系分区精度对比分析可以更精细地指导台风监测及预警业务。文中首先根据中央气象台发布的台风报文确定台风中心位置, 依次按照0~80 km、 80~200 km和200~400 km将台风分为中心区、 内雨带区和外围螺旋雨带区, 然后对各个范围进行缓冲区分析, 分别统计各分区的CTH、 CTT以及CTP偏差的均值信息。
从FY‑4A、 Himawari‑8、 MODIS卫星台风分区偏差统计结果(表1)可知, 三个参数的均值偏差明显低于整体均值偏差(图6), 且在台风水平分布上有规律可循, 即从台风外围到中心, 三个参数的均值偏差逐渐减小。如在台风近中心区, FY‑4A与Himawari‑8的CTT和CTH分别相差0.78 ℃和30 m, CTP仅差0.2 hPa; 在内雨带区, CTT相差1.22 ℃, CTH为130 m, CTP为8.3 hPa; 在台风外围螺旋雨带区, 偏差逐步增大, 是中心和内雨带区的3~4倍。
表1 FY‑4A Himawari‑8 MODIS卫星台风分区偏差统计结果

Table 1 Regional deviations of FY‑4A, Himawari‑8 and MODIS satellites

云顶参数 卫星比较 台风中心位置
0~80 km 80~200 km 200~400 km 0~400 km
云顶温度/℃ F4‑H8 0.78 1.22 1.61 4.03
F4‑MODIS 1.65 2.83 7.38 -0.29
H8‑MODIS 2.28 1.61 5.77 -4.31
云顶高度/km F4‑H8 0.03 -0.13 -0.56 -0.45
F4‑MODIS -0.24 -0.28 0.57 0.36
H8‑MODIS -0.27 -0.15 1.13 0.80
云顶气压/hPa F4‑H8 0.2 8.3 25.3 20.7
F4‑MODIS 5.2 6.6 -30.3 -22.5
H8‑MODIS 5.1 -1.7 -55.6 -43.1

表中阴影加粗数字为每组偏差值最小组合

同时, 与整体表现不同的是, 在台风各分区内FY‑4A与Himawari‑8的反演结果最接近, 两者之间的偏差也最小, 这与整体表现出的FY‑4A与MODIS相关性最好, 偏差最小有所不同。具体原因可能与数据分辨率、 算法本身以及数值模式等因素有关, 还有待进一步深入研究。

5 结论

遥感产品精度分析与检验是沟通数据到信息转换的关键技术环节, 只有对各种遥感产品精度给出客观、 定量的评估, 才能进一步提高遥感产品定量化生产水平, 使其真正成为地球系统科学以及全球变化等重要科学研究的可靠信息源。本文结合台风应用实例, 从实际监测应用需求出发对我国自主研制的第二代静止气象FY‑4A的云顶参数产品和美国EOS/MODIS、 日本Himawari‑8卫星同类产品进行了对比分析, 得出如下主要结论:
(1) 在深厚的密闭云区, 三颗卫星反演的云顶高度(CTH)平均值均分布在12~16 km, 云顶温度(CTT)均在-40 ℃以下, 云顶气压(CTP)达100~200 hPa, 这与实际观测结果具有很好的一致性, 能够为气象云观测业务提供重要的参考。
(2) 整体上, FY‑4A反演结果与MODIS反演结果之间存在高度线性相关关系, 平均值偏差量值也最小, 但整体偏差绝对值较大, 这说明, FY‑4A静止卫星云顶参数反演能力逐渐能够接近同步轨道卫星, 但在有透明薄卷云和低云存在的情况下反演误差明显增大, 因此对云检测精度提出了很高的要求, 同时也可能与不同仪器对云的探测能力相关。
(3) 具体在台风应用方面, FY‑4A和Himawari‑8之间的偏差相对较小, 而且两者与MODIS之间的偏差也比整体误差小很多, 这表明目前云顶参数主要适合于台风中心及内雨带区这种深厚有组织的云系系统, 且无论是极轨卫星还是静止卫星, 其云顶参数产品的反演能力相近, 可根据实际业务条件选择使用。
(4) 不同分区内, FY‑4A与Himawari‑8、 MODIS之间的偏差与整体表现不同, 可能与不同仪器的空间分辨率、 不同仪器对云的探测能力、 云检测以及不同大气温度廓线数据等多种原因相关, 还需要在可能的条件下结合具体的反演算法和处理过程进行更深层次地分析。

感谢FY‑4A科研试验卫星地面应用系统工程天气示范分系统-东南沿海台风监测及预警服务示范应用子系统建设项目对本文工作的支持; 同时感谢国家卫星气象中心闵敏博士对相关问题的耐心解答。

Bedka S T, Feltz W F, Schreiner A J, al et2007. Satellite derived cloud top pressure product validation using aircraft-based cloud physics lidar data from the ATReC field campaign[J]. International Journal of Remote Sensing, 28: 2221-2239.

Chahine M T, 1974. Remote sounding of cloudy atmospheres. I. The single cloud layer[J]. Journal of the Atmospheric Sciences, 31(1): 233-243.

Dong X Q, Minnis P, Xi B K, al et2008. Comparison of CERES‑MODIS stratus cloud properties with ground‑based measurements at the DOE ARM Southern Great Plains site[J]. Journal of Geophysical Research: Atmospheres, 113: D03204. DOI: 10. 1029/2007JD008438.

Frey R A, Baum B A, Menzel W P, al et1999. A comparison of cloud top heights computed from airborne lidar and MAS radiance data using CO2 slicing[J]. Journal of Geophysical Research: Atmospheres, 104(D20):24547-24555.

Goloub P, Herman M, Chepfer H, al et2000. Cloud thermo‑dynamical phase classification from the POLDER spaceborne instrument[J]. Journal of Geophysical Research: Atmospheres, 105(D11):14747-14759.

Hamada A, Nishi N, Iwasaki S, al et2008. Cloud type and top height estimation for tropical upper‑tropospheric clouds using GMS‑5 split‑window measurements combined with cloud radar measurements[J]. Scientific Online Letters on the Atmosphere, 4(1): 57-60.

Hasler A F, Mack R, Negri A, 1983. Stereoscopic observations from meteorological satellites[J]. Advances in Space Research, 2(6): 105-113.

Hawkinson J A, Feltz W, Ackerman S A, 2005. A comparison of GOES Sounder‑and cloud lidar‑and radar‑retrieved cloud‑top heights[J]. Journal of Applied Meteorology, 44(8): 1234-1242.

Kim S W, Chung E S, Yoon S C, al et2011. Intercomparisons of cloud‑top and cloud‑base heights from ground‑based Lidar, CloudSat and CALIPSO measurements[J]. International Journal of Remote Sensing, 32(4): 1179-1197.

Lavanant L, Fourrié N, Gambacorta A, al et2011. Comparison of cloud products within IASI footprints for the assimilation of cloudy radiances[J].Quarterly Journal of the Royal Meteorological Society, 137(661): 1988-2003.

Marchand R, Ackerman T, Smyth M, al et2010. A review of cloud top height and optical depth histograms from MISR, ISCCP, and MODIS[J]. Journal of Geophysical Research: Atmospheres, 115(D16):D16206. DOI: 10.1029/2009JD013422.

Min M, Wu C Q, Li C, al et2017. Developing the science product algorithm testbed for Chinese next generation geostationary meteorological satellites: Fengyun‑4 series[J]. Journal of Meteorological Research, 31(4): 708-719.

Naud C, Muller J P, Clothiaux E E, 2006. Assessment of multispectral ATSR2 stereo cloud‑top height retrievals[J]. Remote Sensing of Environment, 104(3): 337-345.

Platnick S, King M D, Ackerman S A, al et2003. The MODIS cloud products: Algorithms and examples from Terra[J]. IEEE Transactions on Geoscience and Remote Sensing, 41(2): 459-473.

Schmit T J, Gunshor M M, Menzel W P, al et2005. Introducing the next‑generation advanced baseline imager on GOES‑R[J]. Bulletin of the American Meteorological Society, 86: 1079-1096.

Schreiner A J, Schmit T J, Menzel W P, 2001. Observations and trends of clouds based on GOES sounder data[J]. Journal of Geophysical Research: Atmospheres,106(D17): 20349-20364.

Smith Jr W L, Minnis P, Finney H, al et2008.An evaluation of operational GOES‑derived single‑layer cloud top heights with ARSCL data over the ARM Southern Great Plains Site[J]. Geophysical Research Letters, 35(13): L13820. DOI: 10.1029/ 2008GL034275.

Wang Z, Wang Z H, Cao X Z, al et2018. Comparison of cloud top heights derived from FY‑2 meteorological satellites with heights derived from ground‑based millimeter wavelength cloud radar[J]. Atmospheric Research, 199: 113-127.

Yang J, Zhang P, Lu N M, al et2012. Improvements on global meteorological observations from the current Fengyun 3 satellites and beyond[J]. International Journal of Digital Earth, 5(3): 251-265.

Yang J, Zhang Z Q, Wei C Y, al et2016. Introducing the new generation of Chinese geostationary weather satellites, FengYun‑4 (FY‑4)[J]. Bulletin of the American Meteorological Society, 98(8): 1637-1658. DOI: 10.1175/BAMS-D-16-0065.1.

Yu Y, Tarpley D, Privette J L, al et2009. Developing algorithm for operational GOES‑R land surface temperature product[J]. IEEE Transactions on Geoscience and Remote Sensing, 47(3): 936-951.

曹芸, 何永健, 邱新法, 等, 2012. 基于地面观测资料的MODIS云量产品订正[J]. 遥感学报, 16(2): 325-342.

陈渭民, 2003. 卫星气象学[M]. 北京: 气象出版社, 112-133, 419.

陈英英, 唐仁茂, 李德俊, 等, 2013.利用雷达和卫星资料对一次强对流天气过程的云结构特征分析[J]. 高原气象, 32(4): 1148-1156. DOI: 10.7522/j.issn.1000-0534.2012.00108.

董瑶海, 2016.风云四号气象卫星及其应用展望[J]. 上海航天, 33(2): 1-8.

樊宏杰, 黄亦鹏, 李万彪, 2017. 基于卫星红外遥感的云顶高度反演算法综述[J]. 北京大学学报(自然科学版), 53(4): 783-792.

范思睿, 王维佳, 2018.利用FY‑4A卫星反演产品对飞机增雨作业的分析[J]. 高原山地气象研究, 38(4): 60-66. DOI: 10.3969/j.issn.1674-2184.2018.04.010.

李典, 白爱娟, 黄盛军, 2012. 利用TRMM卫星资料对青藏高原地区强对流天气特征分析[J]. 高原气象, 31(2): 304-311.

林琳, 黄思训, 杜华栋, 2006. MODIS数据的云顶高度反演[J]. 地球信息科学, 8(2): 106-109.

刘健, 李云, 2011. 风云二号静止气象卫星的云相态识别算法[J]. 红外与毫米波学报, 30(4): 322-327.

刘江涛, 徐宗学, 赵焕, 等, 2019. 不同降水卫星数据反演降水量精度评价——以雅鲁藏布江流域为例[J]. 高原气象, 38(2): 386-396. DOI: 10.7522/j.issn.1000-0534.2018.00092.

刘忠, 凌峰, 张秋文, 2005. MODIS遥感数据产品处理流程与大气数据获取[J]. 遥感信息( 2: 52-57.

陆风, 张晓虎, 陈博洋, 等, 2017. 风云四号气象卫星成像观测模式及其应用前景[J]. 海洋气象学报, 37(2): 1-12.

吕达仁, 王普才, 邱金桓, 等, 2003. 大气遥感与卫星气象学研究的进展与回顾[J]. 大气科学, 27(4): 552-566.

史兰红, 崔林丽, 赵兵科, 等, 2015. 台风眼壁及周围螺旋云带云属性垂直分布研究[J]. 热带气象学报, 31(1): 51-62.

王胜杰, 何文英, 陈洪滨, 等, 2010. 利用CloudSat资料分析青藏高原、 高原南坡及南亚季风区云高度的统计特征量[J]. 高原气象, 29(1): 1-9.

王宏斌, 张志薇, 刘端阳, 等, 2018. 基于葵花8号新一代静止气象卫星的夜间雾识别[J]. 高原气象, 37(6): 1749-1764. DOI: 10.7522 /j.issn.1000-0537.2018.00037.

吴小丹, 闻建光, 肖青, 等, 2015. 关键陆表参数遥感产品真实性检验方法研究进展[J]. 遥感学报, 19(1): 75-92.

徐小红, 余兴, 朱延年, 等, 2018. 6·23龙卷FY‑2G卫星云微物理特征分析[J]. 高原气象, 37(6): 1737-1748. DOI: 10.7522/j.issn.1000-0534.2018.00041.

张鹏, 郭强, 陈博洋, 等, 2016. 我国风云四号气象卫星与日本Himawari‑8/9卫星比较分析[J]. 气象科技进展, 6(1): 72-75.

张志清, 陆风, 方翔, 等, 2017. FY‑4卫星应用和展望[J]. 上海航天, 34(4): 8-19.

中国气象局, 2011. 气象卫星定量产品质量评价指标和评估报告要求(QX/T 127-2011)[S]. 北京: 气象出版社, 1-6.

周毓荃, 陈英英, 李娟, 等, 2008. 用FY‑2C/D卫星等综合观测资料反演云物理特性产品及检验[J]. 气象, 34(12): 27-35.

赵震, 2019. 2016年台风“莫兰蒂”结构特征的多源卫星探测分析[J]. 高原气象, 38(1): 156-164. DOI: 10.7522 /j.issn.1000-0534.2018.00065.

Outlines

/