
1 引言
2 数据来源与方法介绍
2.1 数据来源
2.2 方法介绍
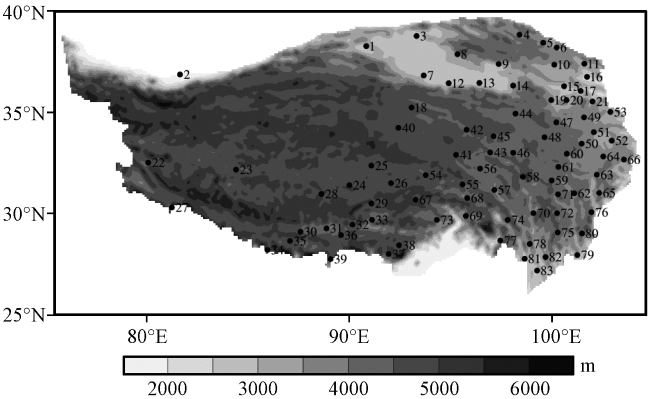
表1 青藏高原上11个气候区及其包含的气象站点Table 1 Eleven climatic regions and meteorological stations in each region over the QTP |
| 序号 | 气候区 | 观测站点序号及名称 |
|---|---|---|
| R1 | 东喜马拉雅南翼高原亚热带山地湿润区 | 69波密、 77察隅、 81贡山、 83维西 |
| R2 | 横断山脉东、 南部高原温带湿润区 | 63马尔康、 65小金、 66松潘、 67嘉黎、 72理塘、 73林芝、 76康定、 78德钦、 79木里、 80九龙、 82中甸 |
| R3 | 横断山脉中、 北部高原温带半湿润区 | 41杂多、 43玉树、 54索县、 55丁青、 56囊谦、 57昌都、 58德格、 59甘孜、 62道孚、 68洛隆、 70巴塘、 71新龙、 74左贡、 75稻城 |
| R4 | 藏南高山谷地高原温带半干旱区 | 29当雄、 30拉孜、 31日喀则、 32尼木、 33拉萨、 34聂拉木、 35定日、 36江孜、 37错那、 38隆子、 39帕里 |
| R5 | 祁连山青东高原温带半干旱区 | 4托勒、 5野牛沟、 6祁连、 9德令哈、 10刚察、 11门源、 14都兰、 15恰不恰、 16西宁、 17贵德、 19兴海、 20贵南、 21同仁、 53合作 |
| R6 | 柴达木盆地与昆仑山北翼高原温带干旱区 | 1茫崖、 2于田、 3冷湖、 7小灶火、 8大柴旦、 12格尔木、 13诺木洪 |
| R7 | 阿里山地高原温带干旱区 | 22狮泉河、 27普兰 |
| R8 | 若尔盖高原亚寒带湿润区 | 50久治、 51玛曲、 52若尔盖、 60班玛、 61色达、 64红原 |
| R9 | 果洛那曲高山谷地高原亚寒带半湿润区 | 25安多、 26那曲、 42曲麻莱、 45清水河、 46石渠、 47果洛、 48达日、 49河南 |
| R10 | 青南高原亚寒带半干旱区 | 18伍道梁、 40托托河、 44玛多 |
| R11 | 羌塘高原亚寒带半干旱区 | 23改则、 24班戈、 28申扎 |
3 结果分析
3.1 青藏高原降水的年际变化
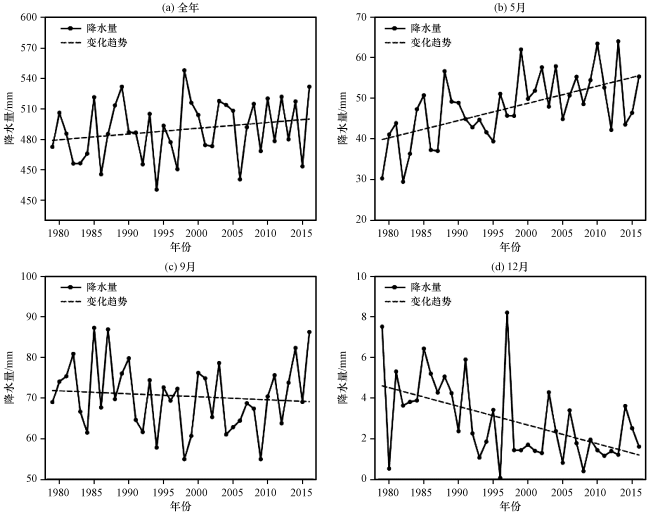
图2 1979 -2016年青藏高原全年、 5月、 9月和12月降水量的年际变化Fig.2 Interannual variation of precipitation during 1979 -2016 for annual, May, September and December over the QTP |
表2 青藏高原1979 -2016年各月降水的变化趋势和1998 -2016年相对于1979 -1997年的变化量与变化率Table 2 Precipitation trend during 1979 -2016, precipitation change and its change rate between 1998 -2016 and 1979 -1997 in each month over the QTP |
| 月份 | 变化趋势 /[mm·(10a)-1] | 变化量 /mm | 变化率 /% |
|---|---|---|---|
| 1 | 0.33 | 0.29 | 6.2 |
| 2 | 0.17 | -0.50 | -6.0 |
| 3 | -0.63 | -2.28 | -12.3 |
| 4 | 1.28 | 2.33 | 9.0 |
| 5 | 4.25 | 9.26 | 21.5 |
| 6 | 0.88 | 2.98 | 3.6 |
| 7 | 0.21 | 2.18 | 2.1 |
| 8 | 0.63 | 6.81 | 7.8 |
| 9 | -0.74 | -3.20 | -4.5 |
| 10 | -0.11 | 1.75 | 6.3 |
| 11 | 0.31 | 0.58 | 11.8 |
| 12 | -0.92 | -2.10 | -53.2 |
粗体表示通过了95%的显著性检验 |
3.2 降水变化趋势的空间分布
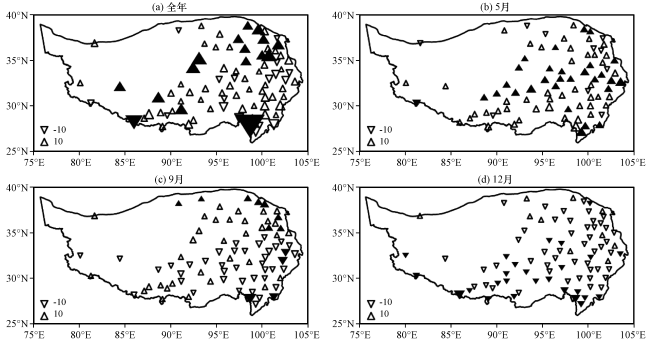
图4 1979 -2016年青藏高原83个站点全年、 5月、 9月和12月降水量变化趋势的空间分布[单位: mm·(10a)-1]上三角表示降水增加, 倒三角表示降水减少, 实心三角表示通过了95%的显著性检验 Fig.4 Distribution of precipitation trends in 1979 -2016 from 83 stations over the QTP for annual, May, September and December.Unit: mm·(10a)-1.Upper triangles mean precipitation increases, while inverted triangles mean precipitation decreases.Solid triangles mean trends that passed the 95% significance test |
3.3 降水频次、 强度和累积降水量的变化
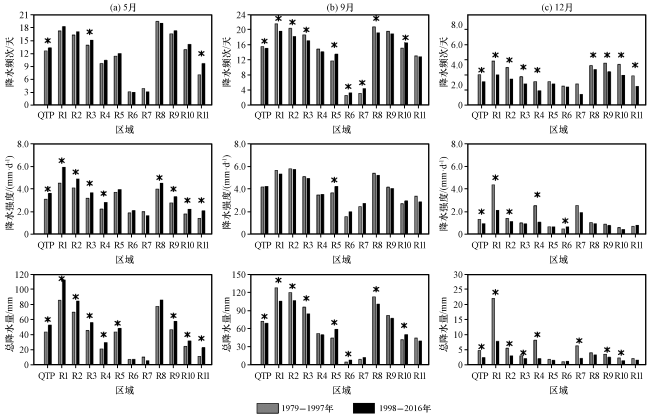
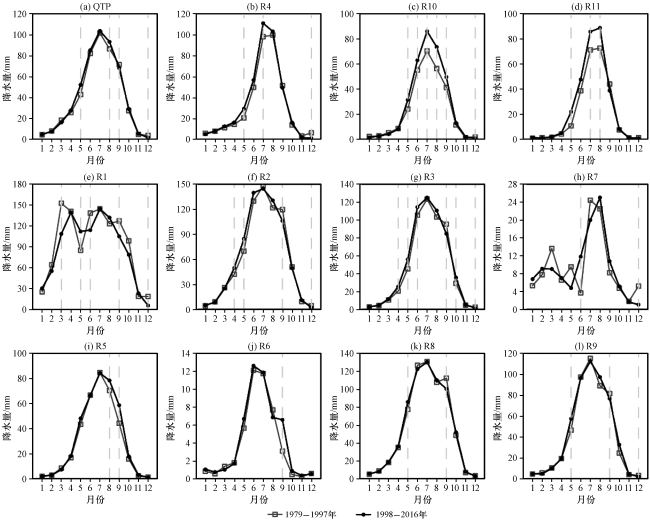
图5 青藏高原和11个气候区1979 -1997年和1998 -2016年5月(a)、 9月(b)和12月(c)降水频次(上)、 降水强度(中)和总降水量(下)的对比星号表示通过了95%的显著性检验 Fig.5 Comparison of precipitation frequency (up), intensity (middle) and total precipitation (down) in May (a), September (b) and December (c) during 1979 -1997 and 1998 -2016 over the QTP and eleven climatic regions.Asterisk means changes that passed the 95% significance test |
3.4 水汽输送通量及大气环流的变化
表3 1979 -2016年青藏高原5月、 9月和12月降水量与4个大气环流指数的相关系数Table 3 Correlation coefficients between precipitation and four atmospheric circulation indices in May, September and December over the QTP during 1979 -2016 |
| 月份 | 高原季风指数 | 南亚季风指数 | 东亚季风指数 | 西风指数 |
|---|---|---|---|---|
| 5 | 0.12 | 0.60 | -0.07 | 0.04 |
| 9 | 0.20 | 0.03 | -0.03 | -0.25 |
| 12 | -0.05 | -0.43 | 0.23 | 0 |
粗体表示通过了95%的显著性检验 |
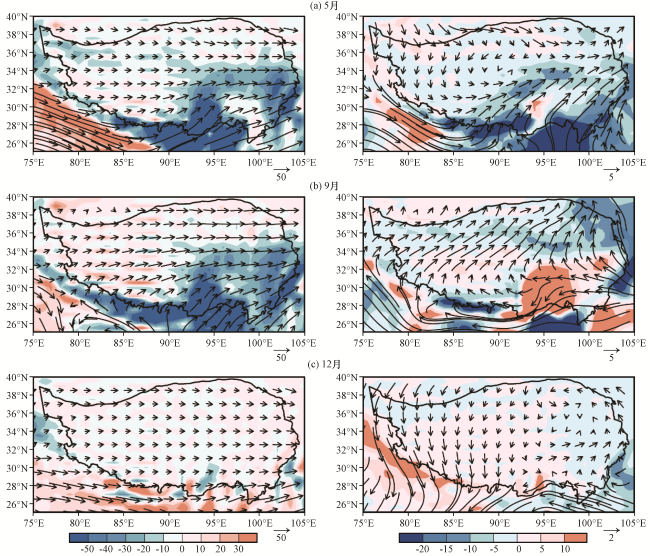
图6 1979 -2016年青藏高原5月、 9月和12月整层水汽输送通量(矢量, 单位: kg·m-1·s-1)及其散度(彩色区, 单位: ×10-6 kg·m-2·s-1)的气候平均态(左)和1998 -2016年与1979 -1997年的差值(右)Fig.6 Climatic means of vertical integrated water vapor flux (vector, unit: kg·m-1·s-1) and divergence (color area, unit: ×10-6 kg·m-2·s-1) in May, September and December averaged in 1979 -2016 (left) and their differences between 1998 -2016 and 1979 -1997 over the QTP (right) |
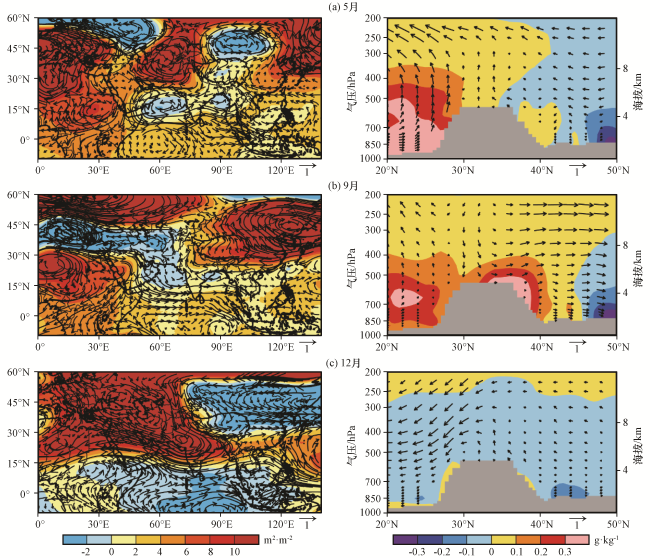
图7 青藏高原1998 -2016年与1979 -1997年平均的500 hPa位势高度差值(彩色区, 单位: m2·s-2)和U-V风场差值(矢量, 单位: m·s-1)(左), 以及80°E -105°E平均的V-W风场差值(矢量, 单位: m·s-1)和比湿差值(彩色区, 单位: g·kg-1)(右)灰色阴影表示海拔 Fig.7 Differences of geopotential height (color area, unit: m2·s-2), the U-V wind (vector, unit: m·s-1) at 500 hPa (left), the V-W wind (vector, unit: m·s-1) and the specific humidity (color area, unit: g·kg-1) averaged over 80°E -105°E (right) between 1998 -2016 and 1979 -1997 over the QTP.The gray shadow indicates altitude |