
1 引言
2 资料选取和方法介绍
表1 松花江流域台站Table 1 Stations of the Songhua River Basin |
| 省份 | 站点名称 |
|---|---|
| 内蒙古 | 额尔古纳、 图里河、 满洲里、 海拉尔、 小二沟、 新巴尔虎右旗、 新巴尔虎左旗、 博克图、 扎兰屯、 阿尔山、 索伦、 乌兰浩特 |
| 黑龙江 | 漠河、 呼玛、 爱辉、 嫩江、 孙吴、 北安、 克山、 富裕、 齐齐哈尔、 海伦、 明水、 伊春、 富锦、 泰来、 北林、 安达、 铁力、 佳木斯、 依兰、 宝清、 哈尔滨、 通河、 尚志、 鸡西、 虎林、 牡丹江、 绥芬河 |
| 吉林 | 白城、 乾安、 前郭、 通榆、 长岭、 扶余、 长春、 蛟河、 敦化、 梅河口、 桦甸、 靖宇、 东岗、 二道、 延吉 |
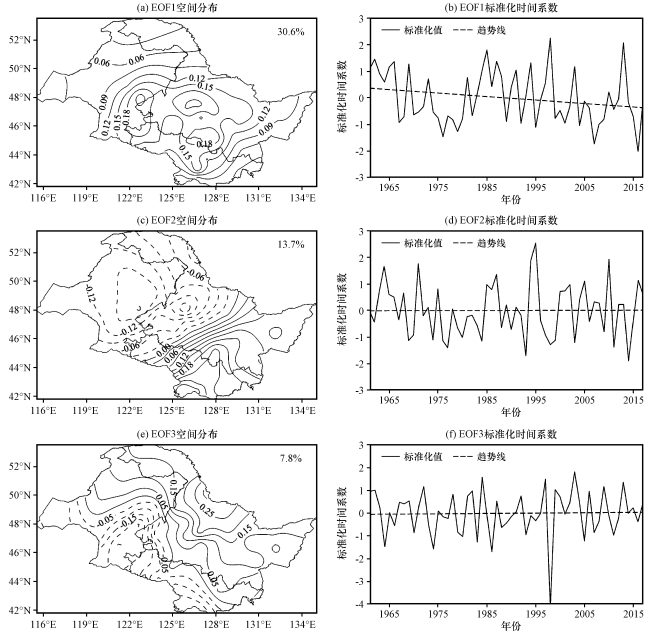
3 盛夏降水的主要时空分布特征
4 盛夏降水三个主要模态的典型年环流特征和差异
表2 盛夏降水前三个模态的异常年份Table 2 The anomaly years as identified in terms of the three leading EOF modes |
| 模态 | 正异常年 | 负异常年 |
|---|---|---|
| 第一模态 | 1961, 1962, 1965, 1966, 1969, 1984, 1985, 1987, 1991, 1994, 1998, 2003, 2013 | 1976, 1979, 1995, 2004, 2007, 2016 |
| 第二模态 | 1964, 1971, 1987, 1994, 1995, 2005, 2010, 2016 | 1969, 1974, 1976, 1977, 1980, 1984, 1993, 1998, 1999, 2003, 2011, 2014 |
| 第三模态 | 1962, 1972, 1984, 1997, 1999, 2003, 2009, 2013 | 1964, 1974, 1980, 1983, 1986, 1998, 2005 |
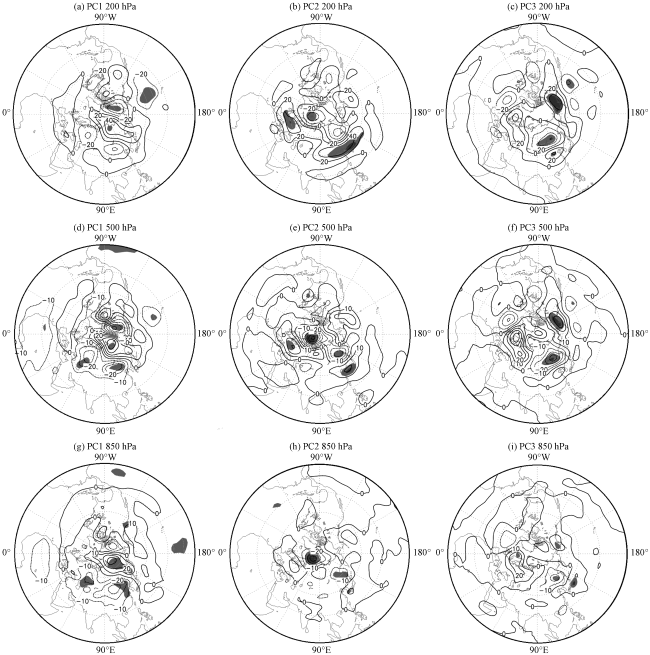
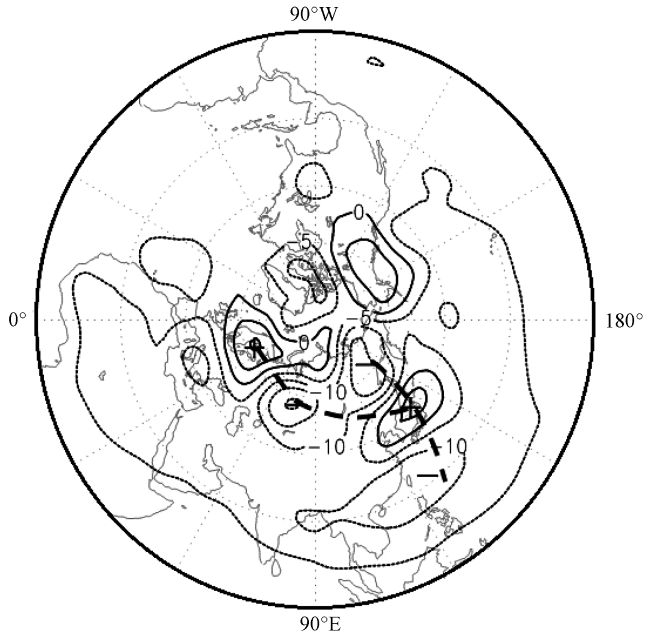
图3 PC1、 PC2、 PC3正负异常年合成的200 hPa、 500 hPa、 850 hPa高度差值场(单位: gpm)深、 浅阴影为通过99%、 95%信度检验的区域 Fig.3 Difference of 200 hPa, 500 hPa and 850 hPa height in anomalous positive and negative years. Unit: gpm. Dark andlight shading indicates height anomalies above the significance at the 99% and 95% confidence level, respectively |
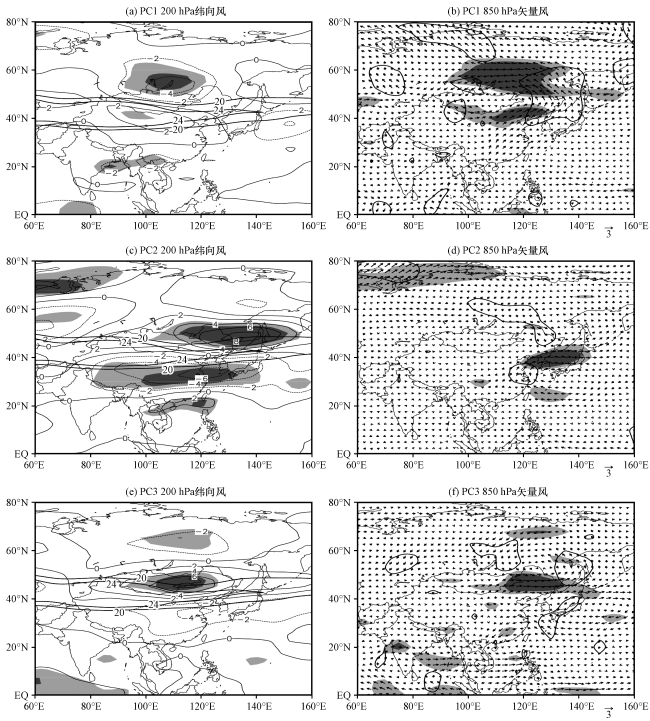
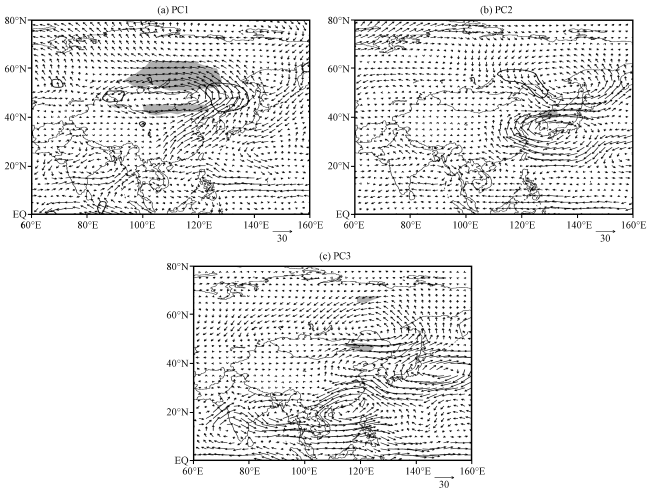
图4 PC1、 PC2、 PC3正负异常年合成的200 hPa纬向风(单位: m·s-1)和850 hPa矢量风差值场(单位: m·s-1)深、 浅阴影为纬向风通过99%、 95%信度检验区域; 图4(a)、 (c)、 (e)中粗黑实线代表气候态风速20 m·s-1、24 m·s-1等值线; 图4(b)、 (d)、 (f)中等值线代表经向风场通过95%信度检验区域 Fig.4 Difference of 200 hPa zonal wind and 850 hPa vector wind in anomalous positive and negative years of PC1, PC2,PC3. Unit: m·s-1.Dark and light shading indicates zonal wind anomalies above the significance at the 99% and 95%confidence level, respectively. Black contours in Fig.4(a), (c), (e) denote the climatic mean of the 200 hPazonal wind with value of 20 m·s-1 and 24 m·s-1. Contours in Fig.4(b), (d), (f) denote meridionalwind anomalies above the significance at the 95% confidence level |
5 与盛夏降水三个主要模态相联系的遥相关型
表3 盛夏降水前三个模态时间系数与各指数的相关系数Table 3 Correlations between the time coefficients of thethree leading EOF modes and the indice in midsummer |
| 时间系数 | EA | WA | WP | EU | PEA | EAP | EASM |
|---|---|---|---|---|---|---|---|
| PC1 | -0.05 | -0.03 | -0.04 | 0.08 | -0.41** | -0.11 | -0.11 |
| PC2 | -0.01 | -0.04 | 0.07 | -0.23* | 0.34** | 0.33** | 0.05 |
| PC3 | -0.07 | -0.02 | -0.00 | -0.34** | 0.08 | 0.33** | 0.42** |
*和**分别代表相关系数通过90%和99%显著性t检验 |
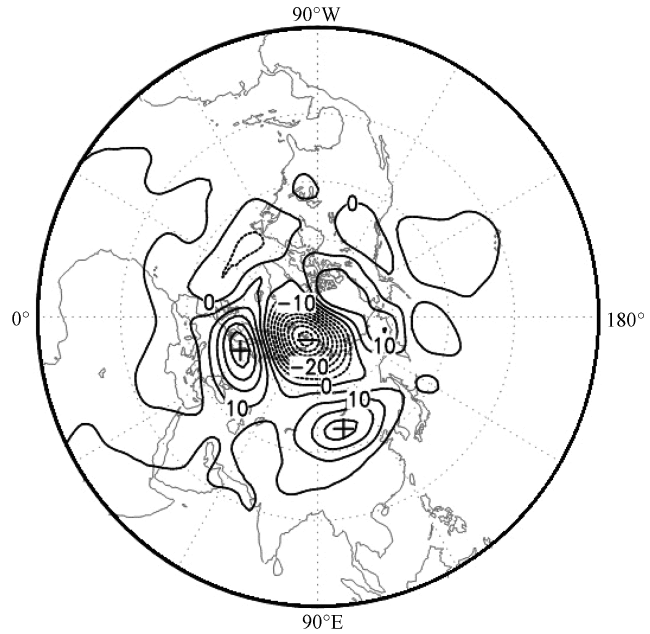
表4 PC3与各遥相关型指数间的相关系数Table 4 Correlations between PC3 and the remote correlation indices |
| 遥相关型 | 相关系数 | 偏相关系数 | |
|---|---|---|---|
| EU | -0.34*** | -0.24*(排除EAP) | -0.14(排除EASM) |
| EAP | 0.33*** | 0.22*(排除EU) | 0.13(排除EASM) |
| EASM | 0.42*** | 0.31**(排除EU) | 0.30**(排除EAP) |
*、 **和***分别代表相关系数通过90%、 95%、 99%显著性t检验 |