
1 引言
2 过程概况
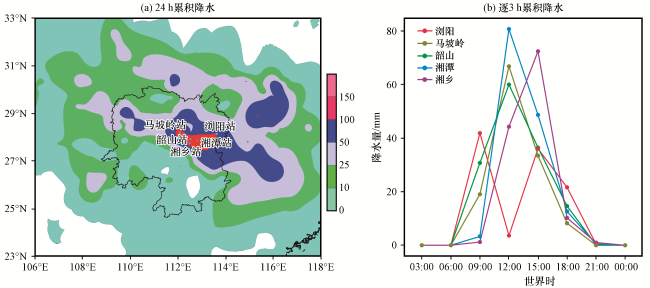
图1 2013年5月14日00:00至15日00:00累积降水量(a,单位: mm)和湖南地区5个大暴雨站点(湘潭、 韶山、 湘乡、 浏阳、 马坡岭)的逐3 h降水变化(b)图(a)中实心圆符号标记5个大暴雨站点位置 Fig.1 Accumulated precipitation (a, unit: mm) and 3 hour precipitation (b) of Hunan Province at Xiangtan, Shaoshan, Xiangxiang, Liuyang and Mapoling Station from 00:00 on 14 to 00:00 on 15 May 2013.In Fig.1(a), cycle symbol marks the location of the precipitation stations |
3 大尺度环流形势
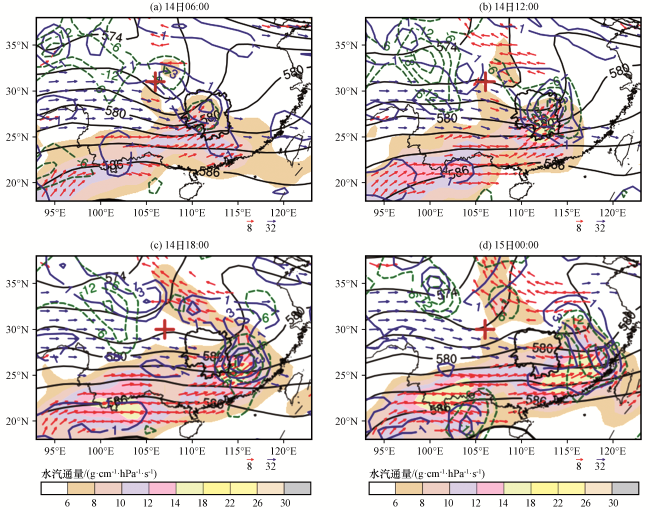
图2 2013年5月14日06:00至15日00:00 逐6 h 500 hPa位势高度场(黑色等值线, 等值线间隔为2, 单位: dagpm), 700 hPa风场(>10 m·s-1, 红色矢量, 单位: m·s-1)、 散度(<0, 绿色等值线, 等值线间隔为6, 单位: ×10-6 s-1)和水汽通量(彩色区, 单位: g·cm-1·hPa-1·s-1)以及250 hPa风场(>30 m·s-1, 蓝色矢量, 单位: m·s-1)和散度(>0, 蓝色等值线, 等值线间隔为2, 单位: ×10-5 s-1)分布红色“+”表示西南涡位置 Fig.2 The geopotential height (black contour, contour interval is 2, unit: dagpm) at 500 hPa, wind field (>10 m·s-1, red vector, unit: m·s-1) and divergence (<0, green contour, contour interval is 6, unit: ×10-6 s-1) at 700 hPa, moisture flux (color area, unit: g·cm-1·hPa-1·s-1) at 700 hPa, wind field (>30 m·s-1, blue vector, unit: m·s-1) and divergence (>0, blue contour, contour interval is 2, unit: ×10-5 s-1) at 250 hPa every 6 hours from 06:00 on 14 to 00:00 on 15 May 2013.Red symbol “+” marks the Southwest Vortex location |
4 西南涡诱生气旋的发生发展过程
4.1 风场与切变线演变特征
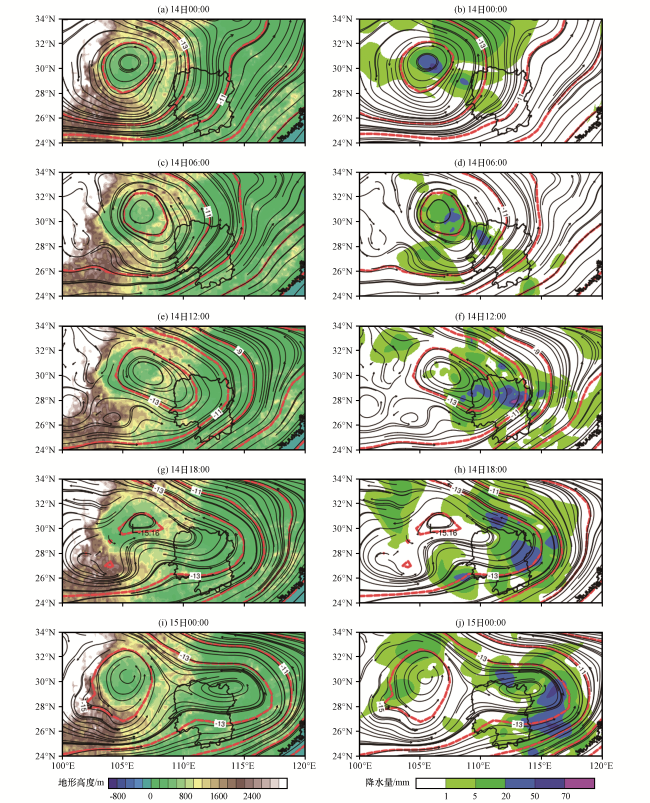
图3 2013年5月14日00:00至15日00:00西南涡诱生气旋的逐6 h演变左列为地形(彩色区, 单位: m), 右列为过去6 h实况降水分布(彩色区, 单位: mm), 分别叠加700 hPa流函数(红色等值线, 单位: ×10-6 m2·s-1)和旋转风场(流线, 单位: m·s-1) Fig.3 Evolution of Southwest Vortex induced cyclone every 6 hours from 00:00 on 14 to 00:00 on 15 May 2013.The left column denotes terrain height (color area, unit: m), the right column denotes distribution of 6 hours precipitation (color area, unit: mm), and overlaid at 700 hPa stream function (red contour, unit: ×10-6 m2·s-1) and rotational wind field (streamline, unit: m·s-1), respectively |
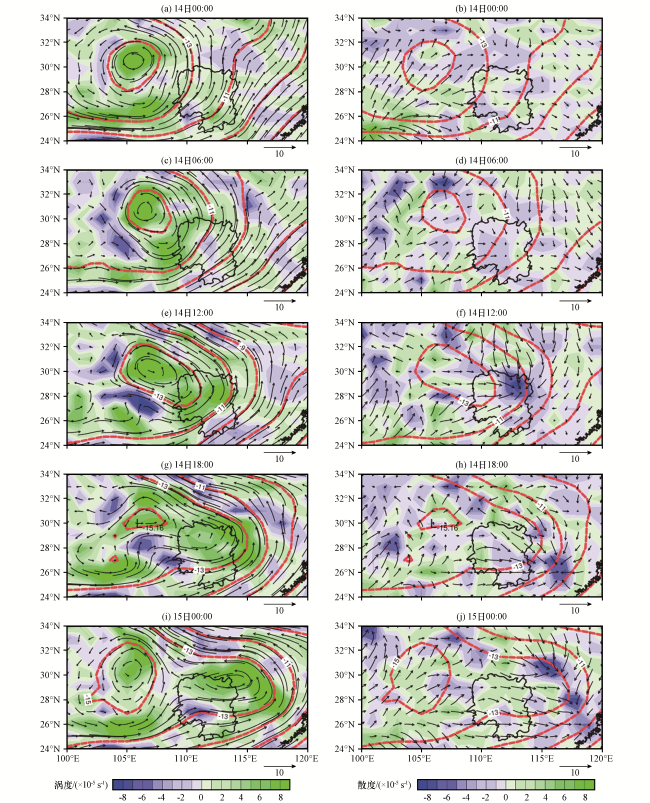
图4 2013年5月14日00:00至15日00:00西南涡诱生气旋的逐6 h涡度(彩色区, 单位: ×10-5 s-1)和旋转风场(矢量, 单位: m·s-1)(左)、 散度(彩色区, 单位: ×10-5 s-1)和辐散风场(矢量, 单位: m·s-1)(右)演变红色等值线为叠加的700 hPa流函数(单位: ×10-6 m2·s-1) Fig.4 Evolution of Southwest Vortex induced cyclone of vorticity (color area, unit: ×10-5 s-1) and rotational wind field (vector, unit: m·s-1) (left) and divergence (color area, unit: ×10-5 s-1) and divergent wind field (vector, unit: m·s-1) every 6 hours from 00:00 on 14 to 00:00 on 15 May 2013.The red contour denotes overlaid at 700 hPa stream function (unit: ×10-6 m2·s-1) |
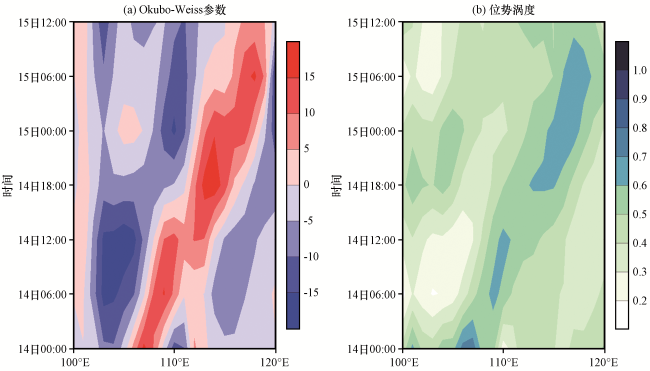
4.2 Okubo-Weiss参数演变特征
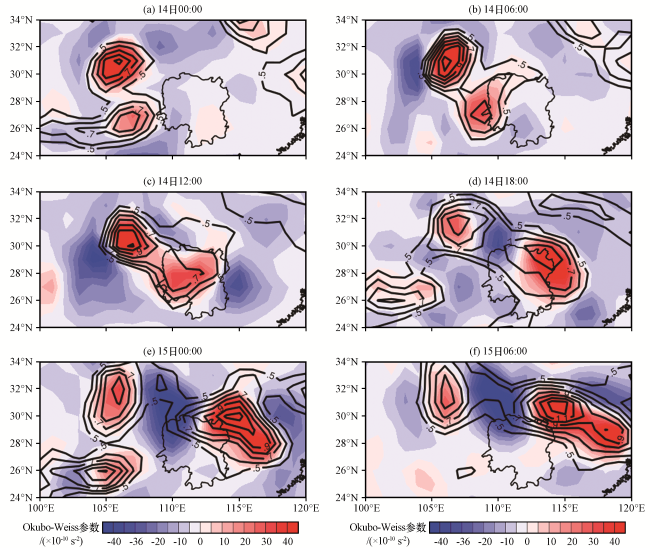
图5 2013年5月14日00:00至15日06:00西南涡诱生气旋的逐6 h Okubo-Weiss参数(彩色区, 单位: ×10-10 s-2)和位势涡度演变图(等值线, 单位: PVU)Fig.5 Evolution of Okubo-Weiss parameter (color area, unit: ×10-10 s-2) and potential vorticity (contour, unit: PVU) every 6 hours from 00:00 on 14 to 06:00 on 15 May 2013 |