

1 引言
2 资料来源与方法介绍
2.1 资料来源
2.2 方法介绍
3 南亚高压南北位移对亚洲季风区UTLS区域大气成分分布的影响
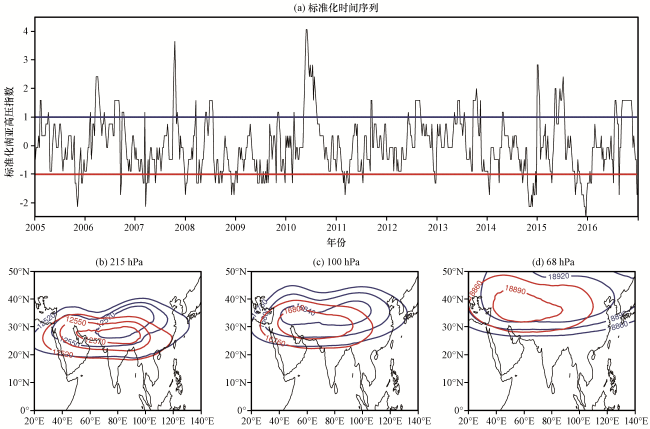
图1 利用ERA-Interim资料计算的2005 -2016年夏季逐日南亚高压南北位移指数的标准化时间序列(a), 以及夏季南亚高压偏南(红线)和偏北(蓝线)时不同高度的位势高度场合成(b~d, 等值线, 单位: gpm)Fig.1 The standardized time series of the day-to-day SAH South-North Displacement Index calculated from ERA-Interim data during 2005 -2016 (a), and the composite geopotential height field at different heights in summer (b ~ d, contour, unit: gpm).In Fig.1(b)~(d), red and blue lines represent SSAH and NSAH, respectively |
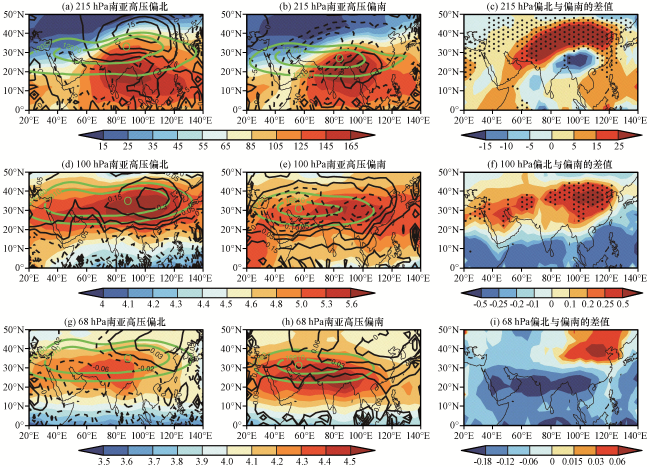
图2 南亚高压偏北(左)和偏南(中)时不同高度的水汽浓度(彩色区, 单位: ppmv)和水汽浓度异常值(黑色等值线, 实线为正值, 虚线为负值, 单位: ppmv)以及偏北与偏南水汽浓度的差值(右, 彩色区, 单位: ppmv)分布215 hPa和100 hPa高度填充绿色等值线为该高度位势高度场, 68 hPa高度上填充绿色等值线为100 hPa位势高度场(单位: gpm); 加点区域为通过了90%的置信度检验的显著区域 Fig.2 The composites of water vapor concentration (color area, unit: ppmv) and its anomalies (black contour, unit: ppmv) for NSAH (left) and SSAH (medium), and the water vapor differences (right, color area, unit: ppmv) between NSAH and SSAH.Green contours represent geopotential height field (unit: gpm) at 215 hPa in Fig.2(a)~(b), and geopotential height field (unit: gpm) at 100 hPa in Fig.2(d)~(e) and (g)~(h).The dotted area is passing the significant test of 90% |
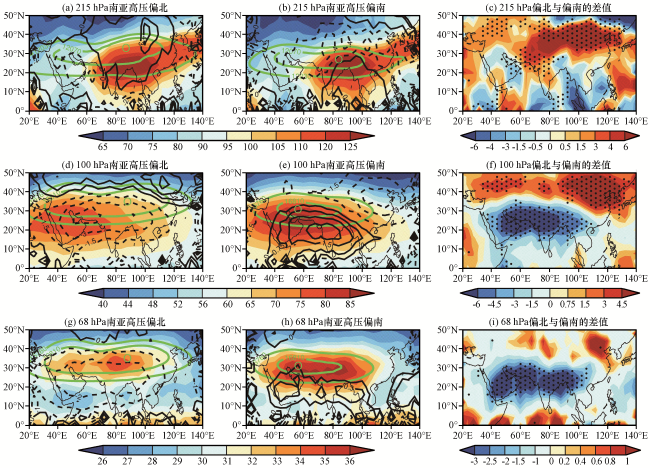
图3 南亚高压偏北(左)和偏南(中)时不同高度的CO浓度(彩色区, 单位: ppbv)和CO浓度异常值(黑色等值线, 实线为正值, 虚线为负值, 单位: ppbv)以及偏北与偏南CO浓度的差值(右, 彩色区, 单位: ppbv)分布215 hPa和100 hPa高度填充绿色等值线为该高度位势高度场, 68 hPa高度上填充绿色等值线为100 hPa位势高度场(单位: gpm); 加点区域为通过了90%的置信度检验的显著区域 Fig.3 The composites of CO concentration (color area, unit: ppbv) and its anomalies (black contour, unit: ppbv) for NSAH (left) and SSAH (medium), and the CO differences (right, color area, unit: ppbv) between NSAH and SSAH.Green contours represent geopotential height field (unit: gpm) at 215 hPa in Fig.3(a)~(b), and geopotential height field (unit: gpm) at 100 hPa in Fig.3(d)~(e) and (g)~(h).The dotted area is passing the significant test of 90% |
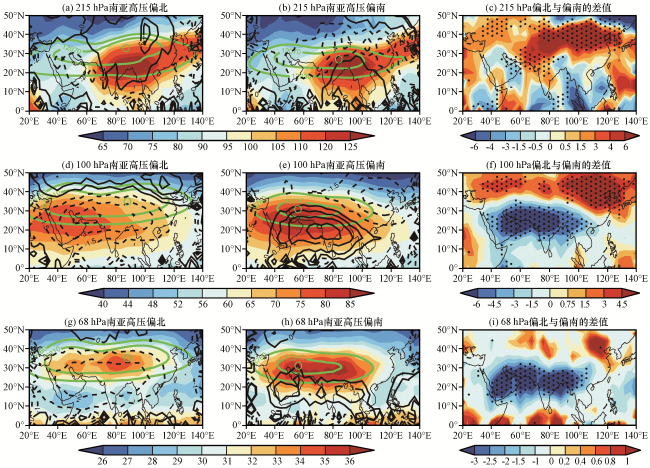
图4 南亚高压偏北(左)和偏南(中)时不同高度的O3浓度(彩色区, 单位: ppbv)和O3浓度异常值(黑色等值线, 实线为正值, 虚线为负值, 单位: ppbv)以及偏北与偏南O3浓度的差值(右, 彩色区, 单位: ppbv)分布215 hPa和100 hPa高度填充绿色等值线为该高度位势高度场, 68 hPa高度上填充绿色等值线为100 hPa位势高度场(单位: gpm); 加点区域为通过了90%的置信度检验的显著区域 Fig.4 The composites of O3 concentration (color area, unit: ppbv) and its anomalies (black contour, unit: ppbv) for NSAH (left) and SSAH (medium), and the O3 differences (right, color area, unit: ppbv) between NSAH and SSAH (215 hPa in the first line, 100 hPa in the second line, 68 hPa in the third line).Green contours represent geopotential height field (unit: gpm) at 215 hPa in Fig.4(a)~(b), and geopotential height field (unit: gpm) at 100 hPa in Fig.4(d)~(e) and (g)~(h).The dotted area is passing the significant test of 90% |
4 南亚高压南北位移影响亚洲季风区UTLS区域大气成分分布的原因
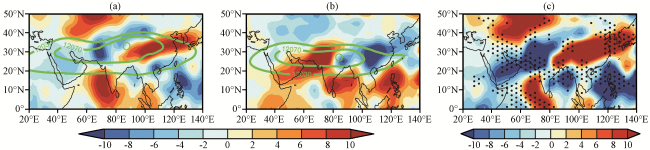
图5 南亚高压偏北(a)和偏南时(b) OLR异常场以及偏北与偏南的差值场(c)分布(彩色区, 单位: W·m-2)绿色等值线为215 hPa高度位势高度场(单位: gpm), 加点区域为通过了90%的置信度检验的显著区域 Fig.5 The OLR (color area, unit: W·m-2) anomaly field for NSAH (a) and SSAH (b), and their difference (c).Green contours represent geopotential height (unit: gpm) field at 215 hPa in Fig.5(a) and 5(b).The dotted area is passing the significant test of 90% |
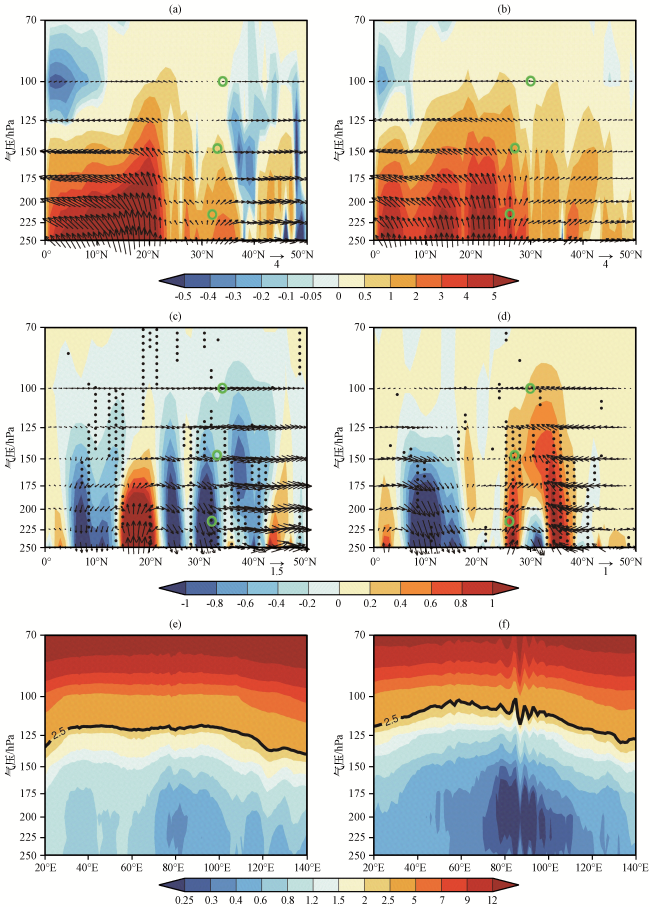
图6 南亚高压偏北时(a, c, 沿89°E)和偏南时(b, d, 沿83°E)UTLS 区域垂直速度(彩色区, 单位: -1×10⁻² Pa·s-1)和风场[矢量, 由纬向风(单位: m ·s-1)与垂直速度(单位: -1×10⁻² Pa·s-1)合成]的经向垂直剖面(a, b)、 垂直速度和风场异常的经向垂直剖面(c, d), 以及南亚高压偏北天(e, 沿33°N)和偏南天(f, 沿27°N)的位涡纬向垂直剖面分布绿色圆圈为反气旋中心, 加点区域为通过了90%的置信度检验的显著区域 Fig.6 The latitude-pressure cross sections of vertical velocity (colors area, unit: -1×10⁻² Pa·s-1) and wind field [vector, combined by zonal wind (unit: m ·s-1) and vertical velocity (unit: -1×10⁻² Pa·s-1)] during NSAH (a, c, along 89°E) and SSAH (b, d, along 83°E) and the longitude-pressure cross sections of potential vorticity during NSAH (e, along 33°N) and SSAH (f, along 27°N).In Fig.6(a)~(d), green circles represent the anticyclonic centers. The dotted area is passing the significant test of 90% |
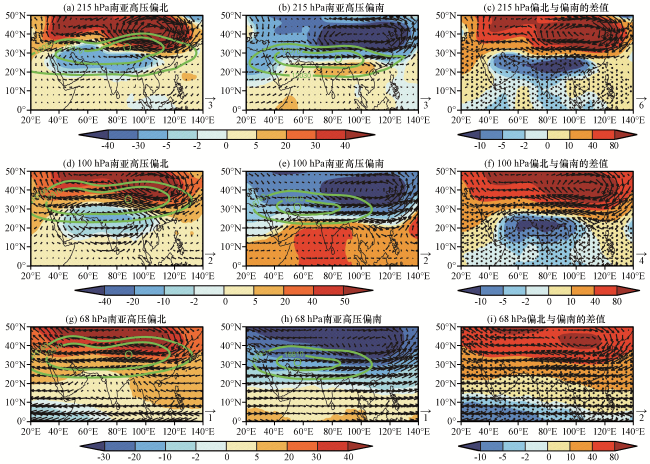
图7 南亚高压偏北天(左)和偏南天(中)不同高度位势高度异常(彩色区, 单位: gpm)和风场异常(矢量, 单位: m ·s-1)以及偏北和偏南的位势高度异常(彩色区, 单位: gpm)和风场异常(矢量, 单位: m ·s-1)差值(右)分布215 hPa和100 hPa高度填充绿色等值线为该高度位势高度场, 68 hPa高度上为100 hPa位势高度场(单位: gpm), 加点区域为通过了90%的置信度检验的显著区域 Fig.7 The geopotential height (color area, unit: gpm) and horizontal wind (vector, unit: m ·s-1) anomalies during NSAH (left) and SSAH (medium) and their differences (right) at 215 hPa, 100 hPa and 68 hPa.In Fig.7(a)~(b), green contours represent 215 hPa height field (unit: gpm), in Fig.7(d)~(e) and (g)~(h) green contours represent 100 hPa height field.The dotted area is passing the significant test of 90% |
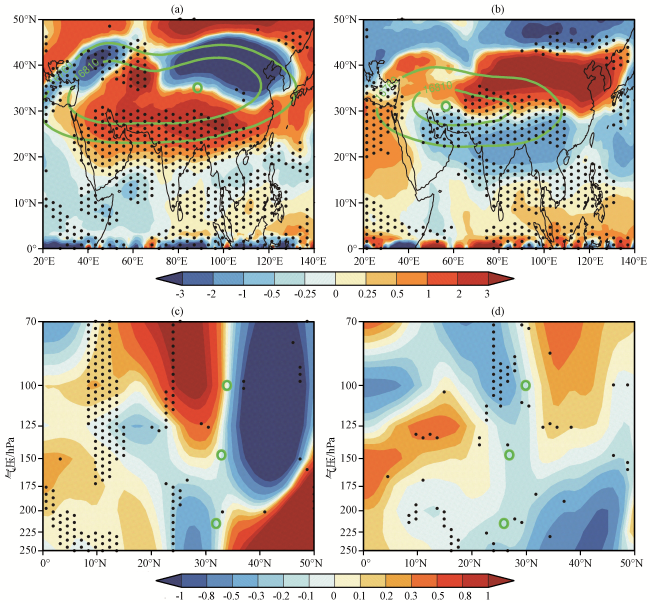


图8 ERA-Interim 资料计算的南亚高压偏北天(a)和偏南天(b)对流层顶温度异常场(彩色区, 单位: K)以及南亚高压偏北天沿91°E(c)和南亚高压偏南天沿59°E(d)温度异常(彩色区, 单位: K)的经向垂直剖面分布绿色等值线为100 hPa位势高度场(单位: gpm), 绿以圆圈为反气旋中心, 加点区域为通过了90%的置信度检验的显著区域 Fig.8 The tropopause temperature anomaly field (color area, unit: K) during NSAH (a) and SSAH (b) and the latitude-pressure cross sections of temperature anomalies (color area, unit: K) during NSAH along 91°E (c) and SSAH along 59°E (d).In Fig.8(a)~(b), green contours represent the 100 hPa geopotential height field (unit: gpm).Green circle is the center of the anticyclone.The dotted area is pass the significant test of 90% |
表1 南亚高压偏北天和偏南天的面积指数和强度指数Table 1 Area Index and Strength Index of the NSAH and SSAH |
| 高度 | 指数 | 南亚高压偏北天 | 南亚高压偏南天 |
|---|---|---|---|
| 100 hPa | 面积指数 | 1923 | 1087 |
| 强度指数 | 49.84 | 33.02 | |
| 70 hPa | 面积指数 | 3117 | 2913 |
| 强度指数 | 91.28 | 42.01 |