
1 引言
提高气象预报精细化水平是加快推进气象现代化的发展趋势之一(李红金等, 2013; 李艳等, 2015)。数值模式预报被认为是目前天气预报中最有效的预报手段, 随着理论研究的不断深入, 业务实践的不断发展, 以及大型计算机计算能力的突破和气象观测资料的多样化及其同化技术的进步, 目前数值模式取得了很大的发展, 模式种类较多, 为业务服务提供了丰富的预报产品。但是, 数值预报一方面受制于当前超高分辨率数值天气技术理论储备的不足; 另一方面受制于目前的计算机水平, 要完成超高时空分辨率的直接气象预报尚难实现。当前业务使用的区域数值模式水平分辨率一般不超过3 km(穆启占, 2016; 王在文等, 2016; 杨阳等, 2017; 唐文苑等, 2018)。所以, 如何通过动力学、 统计学等方法, 将数值模式的预报产品针对性地应用到不同的精细化业务需求中, 是数值模式预报发展中亟需解决的问题之一。赵凯等(2008)使用动力相似预报方法, 将国内T213数值模式的预报产品进行本地化释用, 应用于江苏省未来12~72 h降水预报系统中。佟铃等(2017)在对GRAPES模式全球中期温度预报产品的偏差订正实验中, 尝试使用基于过去资料的模式距平积分ANO(Anomaly Numerical-correction with Observations)方法, 效果明显。为了给2008年在青岛举办的奥帆赛提供可靠的高分辨率模式预报产品, 苗世光等(2009)利用Weather Research & Forecast(WRF)模式建立了水平分辨率达到500 m的青岛奥帆赛高分辨率数值模式系统。程丛兰等(2019)以北京地区先进的临近天气预报客观方法为基础, 引进奥地利气象局和香港天文台先进的融合技术, 利用数值预报结果和实况观测资料, 对北京地区降水进行融合实验。
在高分辨率的模式预报中, 往往需要将低分辨率的产品进行网格插值作为初值放入到模式中计算或者用于模式产品的后处理阶段, 通过网格插值提高分辨率的预报产品可以直接应用于业务预报或者融合实验中。彭思岭(2017)在对站点数据的插值方法进行研究时, 对比了反距离加权插值法(IDW)和梯度反距离插值法(GIDW)两种方法, 实验结果表明, 考虑了经纬度和海拔的GIDW方法明显优于IDW方法, 同时将k-means聚类算法应用到了空间插值方法中。石汉青等(2008)发现对探空报文资料采用普通Kriging算法进行插值是合理的。熊敏诠(2012)将Delaunay三角剖析法应用在降水插值中, 结果表明这种方法能有效克服反距离权重法在降水插值中固有的缺陷, 同时有较好的视觉效果。此外, 目前应用到气象上的空间内插方法有泰森多边形方法、 反距离加权方法、 统计方法和多元回归方法等。对这些方法的对比检验表明, 目前没有一种适合所有情况的插值方案, 实际应用中应针对不同的气象要素, 不同的区域和时间, 采用不同的空间插值方法(李新等, 2000; 刘登伟等, 2006; 王智等, 2012; Yao et al, 2013; 宋亚男等, 2014; 贾洋等, 2018; 刘琼等, 2018)。通常二维插值的方法仅考虑站点与网格或网格与网格之间在二维空间上的一致性, 而忽略了垂直高度上的差异性, 尤其在复杂地形高分辨率下, 垂直高度的变化可能引起气象要素的剧烈变化(王思维等, 2011; Frei, 2014)。例如, 温度随着地形高度的增加而减小, 垂直递减率为每100 m变化约为0.6 ℃, 甚至更大(赵滨等, 2016)。因此针对气象要素数据的插值, 应使用更为合理的三维插值方法(吴链, 2017)。在业务中, 可以通过降尺度来提升分辨率, 提高模式预报产品释用质量, 发现更小尺度的天气现象, 在此过程中也需要使用三维插值方法(吕世华等, 1985; 漆梁波, 2015; 王在文等, 2016)。
第24届冬季奥林匹克运动会将于2022年2月4 -20日在北京延庆和河北张家口举办(简称“2022北京冬奥会”)。冬奥赛事对于气象预报的精细化服务要求非常高, 要求达到百米级分辨率的分析与未来预报。但是, 冬奥赛区的选址一般都地处山地, 滑雪赛道等多建在地形陡峭复杂的山区。普通的三维插值大部分是二维插值在两个高度上的线性组合, 但随着降尺度分辨率的提高, 不可避免地带来了一些计算误差。尤其在复杂地形下, 当模式的分辨率比较低时, 模式地形与真实地形之间的差异将对分析和预报质量造成较大的影响。假设需要在复杂地形下, 将3 km分辨率的预报产品降尺度到1 km, 甚至100 m, 此时有两个需要解决的问题: (1)模式地形分辨率较低, 模式地形跟实际地形之间存在较大的固有差异; (2)实际地形本身十分复杂, 格点之间的地形高度变化较大, 当格点分辨率越高, 这种趋势越明显。此时, 普通的空间插值方法不能很好地适应模式地形与实际地形由于分辨率的不同而导致的高度差异, 导致插值得到的最后释用产品准确性亟待提升。因此, 为了解决在复杂地形下进行降尺度插值存在的问题, 满足业务应用对分析和预报产品达到精确且美观的要求(张红杰等, 2009), 更好地为2022年北京冬奥会的赛事活动提供气象服务, 本文提出了一种基于高斯模糊算法的复杂地形精细化三维插值方法, 并将其应用于数值模式的后处理系统中。
2 资料来源与方法介绍
2.1 研究区域和数据介绍
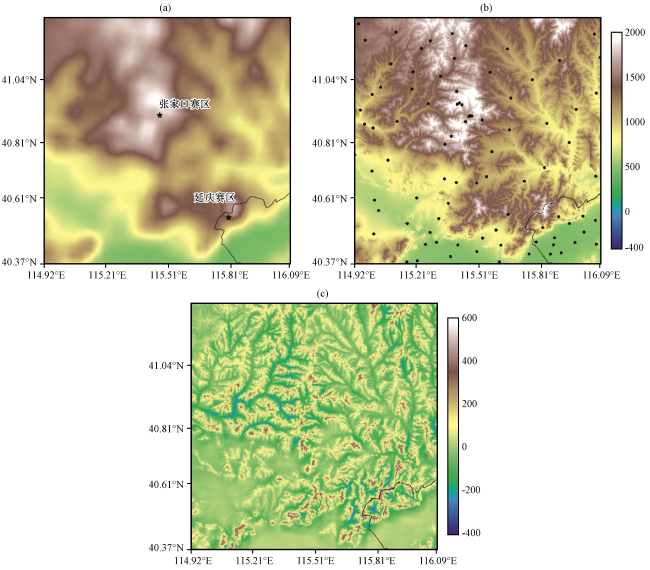
图1 在冬奥重点区域范围RMAPS-ST数值模式模拟的3 km分辨率地形分布(a), 实际100 m分辨率地形分布(b)以及两者地形高度差分布(c)(单位: m)黑点表示自动站的站点位置 Fig.1 3 km resolution terrain distribution of RMAPS-ST (a), 100 m resolution terrain distribution of RISE (b), and the difference of topographic height distribution between RMAPS-ST and RISE (c) at the key area of Winter Olympics.Unit: m.The black dots represent the locations of automatic weather stations |
以温度为研究对象。除了地面自动站数据外, 还使用北京城市气象研究院/北京市气象局研发和实时业务运行的RMAPS-ST(Rapid-refresh Multi-scale Analysis & Prediction System-Short Term)系统的数值预报数据。RMAPS-ST系统为中尺度区域模式, 其旧版本为北京快速更新循环数值预报系统(BJ-RUC)(范水勇等, 2013; 闵晶晶等, 2014; 王在文等, 2016; Yu et al, 2018)。RMAPS-ST系统华北区域的水平分辨率为3 km, 垂直51层。该数值预报系统逐3 h循环更新, 即:每天有00:00(世界时, 下同), 03:00, 06:00, 09:00, 12:00, 15:00, 18:00和21:00共计8次预报。在本文的实验中, 由于非实时运行, 因此在试验中统一采用00:00和12:00两个起报时次的数据。
本文提出的插值方法将应用于如下试验: 将RMAPS-ST 3 km分辨率的温度预报产品经过本文提出的方法插值成更高分辨率, 并应用于RISE(Rapid-refresh Integrated Seamless Ensemble system)系统中。RISE系统是北京城市气象研究院/北京市气象局研发的短临融合预报系统, 也是RMAPS-ST数值模式的后处理释用融合集成系统。RISE系统基于自动站、 雷达和数值预报产品等多源资料, 通过融合集成技术, 形成100 m水平分辨率、 逐10 min快速循环更新的三维温湿风格网化分析产品和地面要素的短时临近预报产品。高分辨率地形资料来自航天飞机雷达地形测量任务获取的30 m高分辨率静态数据文件(SRTM1, Shuttle Radar Topography Mission 1s, 详见http: //www2.jpl.nasa.gov/srtm; 刘郁珏等, 2018)。图1给出了冬奥重点区域数值模式3 km分辨率地形分布、 实际100 m分辨率地形分布以及两者之间的差异情况。从图1中可以看到, 模式地形分辨率较低, 与实际地形之间存在很大的差异。图1(a)与图1(b)相比, 尽管RMAPS-ST的地形大体上与实际100 m分辨率地形分布基本一致, 但实际100 m分辨率的地形结构更加复杂化和精细化, 显示出明显的山脉地形纹络。两者的地形高度差值较大, 在山顶和沟壑地区地形高度差异在-300~600 m之间, 最大地形高度差异值可达602 m[图1(c)], 若以每100 m变化0.6 ℃计算, 这意味着最大地形高度差异引起的温度变化可能可达3~4 ℃。因此, 从3 km到100 m的插值过程中, 必须考虑两种地形之间差异的影响, 以尽可能减小插值带来的误差, 提升最终的高分辨率模式后处理释用产品的精细化、 美观性和准确性。
2.2 空间三维插值方法
首先简单介绍一下气象数据在计算机中存储特点。模式预报产品的数据压缩格式有Grib, NetCDF等格式, 气象要素的数值存储在计算机里可以看做是多个二维平面堆叠而成, 但从气象意义上来说, 这种二维平面并不“平坦”。一般气象数据可以按照气压分层, 但由于各地实际的重力加速度都不同, 各地地面情况复杂因素存在, 使得等压面上格点的位势高度并不一致。因此, 对指定高度层进行温度插值的时候, 需要考虑每个插值目标点在计算机储存中的“高度”层问题。
在模式预报中, 地形怎样处理和用不用地形对数值模式预报的结果影响较大(熊秋芬等, 2007; 王光辉等, 2008)。同时, 模式地形与实际地形存在着差异, 模式地形的真实性也会影响预报质量(吕世华等, 1985)。这里将详细介绍本文提出的三维空间插值处理方案和应用试验: 将3 km分辨率的模式产品插值到100 m水平分辨率, 插值成21层, 垂直分辨率200 m。在处理时, 为了区别在不同插值高度(距离模式地形或者实际地形的高度, 即离地高度)下, 对插值结果的影响主要是模式地形还是实际地形, 需要设定一个临界高度h 临界。临界高度定义为判断地形影响的临界高度值。当插值高度在临界高度以下, 影响插值结果的地形是模式地形; 当插值高度在临界高度以上, 插值高度与实际地形高度的总高小于模式地形高度与临界高度的总高, 则认为还是以模式地形为主要影响, 实际地形影响较小; 当插值高度与实际地形高度的总高大于模式地形高度与临界高度的总高, 则认为此时影响插值结果的主要是实际地形。假设对(i, j, z)点进行插值, z表示的是目标插值点所在的层数, 这里具体分为三步:
第一步: 利用反面积插值法得到(i, j)点的模式高度。
如图2(a)所示, 反面积插值算法跟反距离插值算法类似, 在网格中由于使用距离不方便计算, 所以使用了面积来表示权重。这里的(i, j)点, 表示目标插值点(i, j, z)点在地面的投影点。
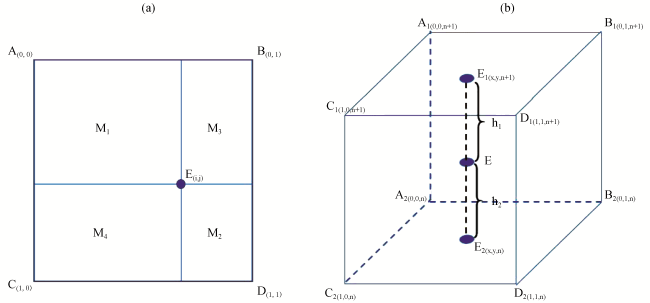
使用M1、 M2、 M3和M4表示4个区域的面积[式(1)~(4)], A、 B、 C、 D是距离目标插值点E最近的4个网格点, 使用hA、 hB、 hC、 hD分别表示4个格点的高度值。E点的模式高度hm的具体计算公式如式(5)所示。
,
,
,
,
.
第二步: 计算在模式地形中垂直高度的温度变化率Tv 。
由于模式地形与实际地形之间有差异, 需要在临界高度h 临界以下, 利用模式温度数据在垂直高度上的变化率Tv[式(6)], 来弥补由于模式地形与实际地形高度差造成的温度差, 公式为:
,
式中: Tdis表示固定高度间距hgap下的温度差, hgap并不一定等于h 临界。本文求解温度高度变化率的方法是在临界高度以下, 以固定高度间距hgap为滑动长度, 以一定的滑动步长去寻找最大的温度变化率Tv。这种做法可以细分温度变化率, 使温度变化率更符合实际情况。在本实验中, h 临界设置为1000 m, hgap设置为500 m, 滑动步长设置为100 m。
第三步: 根据临界高度h 临界来确定最终的插值点高度。
根据临界高度的设定以及模式的地形高度, 分三种情况讨论:
第一种: 插值高度hz在临界高度以下, 此时计算公式如下:
式中: hs表示的是插值目标点的实际地形高度; hm表示插值目标点的模式高度; T表示插值之后的温度值; Interp3D在这里表示三维插值函数, 将在后面具体阐述。当插值高度hz小于h 临界时, 模式地形对插值结果的影响较大, 因此插值点的高度hz是距离模式地形的高度。同时, 在式(7)中, 补上模式地形高度hm与实际地形高度hs之间的高度差(hm-hs)所造成的温度差。
第二种: 插值高度hz与实际地形高度hs的总高小于模式地形高度hm与临界高度h 临界的总高, 这是一种在临界高度上, 从模式地形的影响转向实际地形影响的过渡情况, 这种情况下对插值结果的影响是以模式地形影响为主, 实际地形的影响为辅, 并补上相应高度差[(hm+h临界)-(hs+hz)]造成的温度差, 即:
第三种: 插值高度hz与实际地形高度hs的总高大于模式地形高度hm与临界高度h 临界的总高, 这种情况下, 不需要考虑模式地形的高度以及高度误差带来的温度差。此时计算公式如下:
本方案中临界高度h 临界, 以及在求解温度变化率中使用的固定高度间距hgap和滑动步长的数值选取应根据具体情况设置, 不能一概而论。
接下来具体阐述三维空间插值函数, 即公式中的Interp3D[图2(b)]。根据目标插值点E的高度, 找到距离E点最近的上下气压面A 1 、 B 1 、 C 1 、 D 1和A 2 、 B 2 、 C 2 、 D 2, 根据反面积权重法计算出E点在两个平面的投影点E 1和E 2的温度值TE1, TE2, 最后利用线性插值将E 1和E 2的温度值插值到E点, 得到E点的温度值TE。Interp3D具体公式如下:
,
,
式中: h 1 表示目标插值点距离气压面A 1 、 B 1 、 C 1和D 1的距离; h 2表示目标插值点距离气压面A 2 、 B 2 、 C 2和D 2的距离; TA 1表示气压面A 1 、 B 1 、 C 1和D 1 中A1点的温度值; x, y表示目标插值点E的坐标。其他符号以此类推, 公式的图示已经在图2(b)中详细画出。
在上述的插值方案中, 使用A 1和A 2的高度来计算出两个平面距离E点高度h 1和h 2。以上空间插值方案的假设前提是上下两个气压面的格点高度分布均匀, 但在复杂地形下, 当目标分辨率达到很高时, 这个假设并不成立。如图1(b)所示, 高分辨率的实际地形精细化程度高, 在山区跟谷区之间的过渡不是很平缓, 计算参照的数据是来自3 km分辨率的数据, 可能E的高度在A 1和A 2之间, 但并不在B 1和B 2之间, B 1和B 2的温度数据并不是最接近E点的数据。在3 km的范围内, 要插值大概900个点才能到达100 m, 但100 m分辨率地形更精细, 有可能有些目标点的高度可能跟相邻的目标点的高度相差较大, 则这两个目标点所参照的温度数据在3 km的数据空间里并不一致, 再加上之前由于仅仅以A 1和A 2的高度作为选层依据造成了一定的误差, 导致产品图中数据点之间的数值连续性差。该问题在业务应用中直接的表现是插值后的温度产品存在明显的边缘和马赛克现象(图3)。
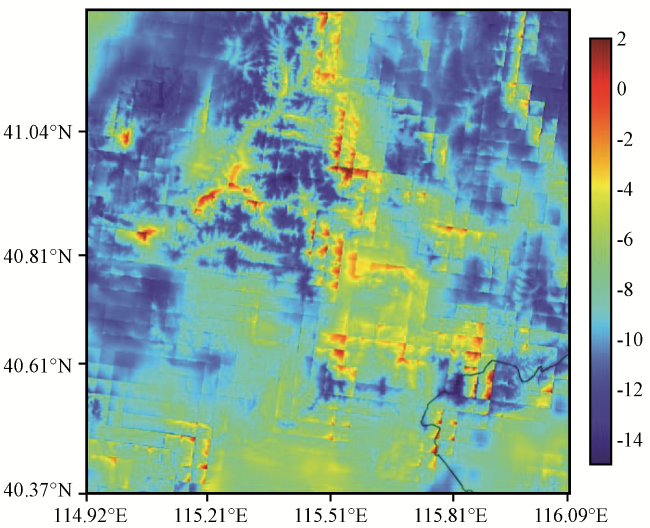
把插值后的高分辨率温度数据看作是灰白图像, 图像中的信息可以分为低频、 中频、 高频三种, 某一区域内相邻像素点之间的灰度值相差很大, 代表图像中高频信息丰富。在图像中, 噪声被认为是图像的一种高频信息(陈伟超等, 2015)。在上述分析中, 由于常规的三维插值算法的选层依据造成某些相邻网格点之间的数值相差较大的现象, 可以认为是温度图像中存在部分噪声。为解决产品图中马赛克问题, 在三维空间插值算法中进一步加入高斯模糊算法进行处理。假设有一个数据矩阵h, 高斯模板矩阵f, 卷积公式如下:
,
式中: (m, n)表示在一个大小为(2M+1)·(2N+1)的高斯模板矩阵f中的横纵坐标; (i, j)表示在数据矩阵h中的横纵坐标。上述公式可以表述为: 对于在坐标(i, j)的数据g(i, j), 它等于以(i, j)为中心的(2M+1)·(2N+1)邻域内的数据与对应高斯模板矩阵的权重因子的乘积加和的结果。高斯模板矩阵的权重计算公式如下所示:
,
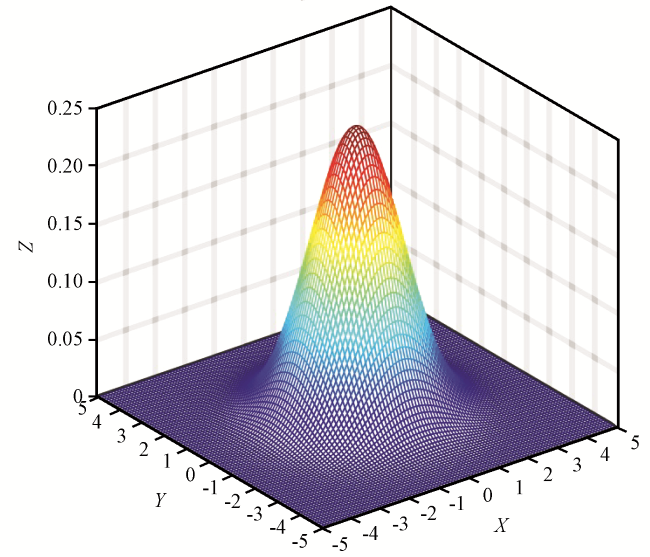
这个公式描述了二维高斯曲面的形成, 式中: x、 y是高斯模板矩阵中的坐标, 模板矩阵的中心位置是原点; σ是高斯核函数的一个参数, 这个参数控制的是高斯曲面的变化程度。如果确定了高斯半径N的大小, 则可以确定参数σ的大小, 并可以构成一个(2N+1)·(2N+1)大小的高斯模板矩阵。高斯曲面是一种钟型结构(图4), 距离中心点越远, 赋予的权重越低, 参数σ越小, 则权重分布更集中, 此时高斯模糊算法仅将距离原点位置最近的几个点赋予了很大的权重。本文试验应用中使用的高斯模板矩阵的半径为N=10, 则参数σ的值为σ=(N-1)/2.0=4.5。需要注意, 试验参数的选取是根据计算速度和插值结果综合考虑的经验值。
在试验的过程中, 发现使用这种二维卷积方式的计算复杂度比较高, 如果格点比较多, 使用的高斯模板矩阵的半径较大, 会使计算速度变慢。在本文研究的冬奥会重点区域内, 试验设置了100 m的目标分辨率, 共计有10, 002, 001个格点, 庞大的格点数量使得计算时间大幅增加。本文试验进一步根据高斯核函数的可分离特性, 将二维的高斯模板矩阵分离为横向的一维高斯矩阵和纵向的一维高斯矩阵, 用两个一维高斯矩阵先后对数据进行一次卷积, 并对边界数据进行复制, 从而可以在保证计算结果不变的情况下显著减少计算所需时间。
2.3 检验评估方法
本文的评估方法以自动站站点观测数据作为实况对比资料, 对得到的温度产品数据进行客观检验, 衡量误差情况及实际应用效果。客观检验使用的评价指标包括偏差(BIAS)、 平均绝对误差(MAE)和均方根误差(RMSE), 计算公式如下:
,
,
,
式中: F表示网格化温度产品数据; O表示自动站实况观测数据; i表示站点编号; m表示自动站总数。
3 个例分析
这里选取2019年2月4日02:00冬奥重点地区的温度作为个例分析, 以自动站实况观测资料、 3 km分辨率模式RMAPS-ST系统原始产品(下称RMAPS-ST 系统)和100 m分辨率RISE系统后处理释用产品(下称RISE系统)进行对比分析。定性来看, 地面2 m温度的分析场整体空间分布特征为从西北方向到东南方向逐渐变高, RMAPS-ST系统和RISE系统的温度场均与自动站实况观测的整体趋势保持一致(图5)。然而, 一方面, RISE 系统温度分析场比RMAPS-ST 系统精细化程度更高、 美观性更佳, 另一方面, RISE 100 m温度分析场产品与自动站观测实况更为接近。例如, 图5(a)~(c)三幅图的红圈位置中, RISE系统分析场的温度值与站点实况更为接近, 而RMAPS-ST系统预报的温度值在该区域比站点实况观测要明显偏低。
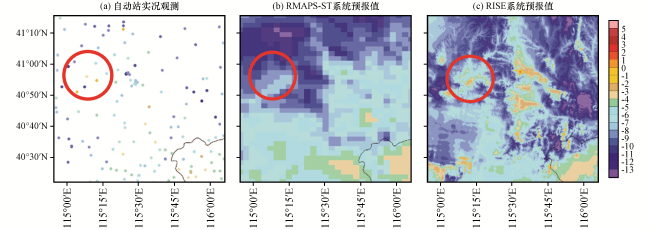
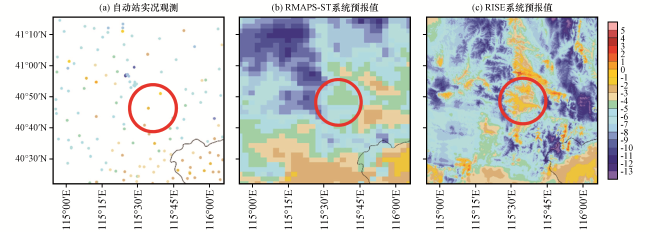
图6给出了地面2 m温度的1 h预报场结果。整体来看, 低分辨率的RMAPS-ST系统预报温度的分布呈现是梯度结构, 符合山区地势变化的整体趋势[图6(b)]。利用本文提出的插值方法, 高分辨率的RISE系统充分考虑了地形高度的影响, 具有很细腻的山脉枝丫形状[图6(c)]。这种温度场分布结构更符合复杂地形山区中地势急速变化的情况, 可以在很大程度上弥补山区自动站观测网稀疏以及原始模式预报产品分辨率不足的缺陷, 可以为温度的趋势分析等气候变化提供更精确的数据(王磊等, 2017; 刘田等, 2018), 为冬奥赛事服务提供更加精细化的产品。在图6(a)~(c)的红圈位置内, 局部小区域的RISE系统预报出了高温, 更符合与自动站站点实况观测。这一结果表明, 除了能够提高精细化水平, 还可以提高预报的准确性。
在本文研究的冬奥重点山区区域范围内, 共有7个国家级自动站, 这7个国家站的站点号分别为53498, 54401, 54304, 54406, 54405, 54408, 54404, 地形高度均接近或大于500 m, 其具体经纬度和高度信息如表1所示。针对上述2019年2月4日02:00个例, 对这7个国家站的数据进行定量分析, 把格点数据先插值到站点上, 与站点观测进行对比分析。结果表明: RISE系统产品在该站的温度分析值以及1 h预报结果比RMAPS-ST系统原始数值预报结果更加接近自动站实况观测值(表1)。进一步对该个例在冬奥重点区域范围内所有站点的平均误差情况进行统计计算, 包括BIAS、 RMSE和MAE误差, 结果表明: RISE系统的BIAS误差更接近于0, RMSE和MAE误差更小(表2), 因此均优于RMAPS-ST系统低分辨率原始数值预报结果。
表1 2019年2月4日02:00 7个国家站点分析场和1 h预报场的观测值和预报值对比Table 1 Comparison of observation and prediction values of 7 national stations analysis field and 1 h prediction field at 02:00 on 4 February 2019 |
| 站点 号 | 经度 | 纬度 | 高度/m | 分析场/oC | 1 h预报场/oC | ||||
|---|---|---|---|---|---|---|---|---|---|
| 自动站 观测 | RMAPS-ST系统 | RISE系统 | 自动站 观测 | RMAPS-ST系统 | RISE系统 | ||||
| 53498 | 115°02′00″E | 40°34′00″N | 629 | -9.5 | -6.36 | -9.40* | -6.6 | -4.29 | -7.18* |
| 54401 | 114°55′10″E | 40°46′10″N | 772 | -8.0 | -7.13 | -7.89* | -6.3 | -4.99 | -6.19* |
| 54304 | 115°16′11″E | 40°57′15″N | 1239 | -5.1 | -7.40 | -5.08* | -3.6 | -6.63 | -4.54* |
| 54406 | 115°58′00″E | 40°27′00″N | 487 | -3.7 | -3.46 | -3.72* | -1.9 | -1.67 | -1.92* |
| 54405 | 115°30′00″E | 40°25′00″N | 570 | -6.6 | -3.90 | -6.53* | -4.3 | -2.63 | -5.58* |
| 54408 | 115°13′00″E | 40°23′00″N | 529 | -6.3 | -4.84 | -6.30* | -4.1 | -2.17 | -3.63* |
| 54404 | 115°50′00″E | 40°53′00″N | 867 | -9.9 | -5.65 | -10.3* | -6.6 | -2.60 | -7.01* |
*表示预报值与自动站(AWS)实况观测值更接近 |
表2 2019年2月4日02:00个例冬奥重点区域内所有站点的客观检验结果Table 2 The results of BIAS, RMSE and MAE averaged for all stations in the study area for case at 02:00 on 4 February 2019 |
| 统计参数 | 模式系统 | 分析场 | 1 h预报场 |
|---|---|---|---|
| 偏差 | RMAPS-ST系统 | -0.09 | -0.54 |
| RISE系统 | 0.04 | -0.34 | |
| 均方根误差 | RMAPS-ST系统 | 2.38 | 2.21 |
| RISE系统 | 0.33 | 1.29 | |
| 平均绝对误差 | RMAPS-ST系统 | 1.96 | 1.82 |
| RISE系统 | 0.17 | 0.95 |
4 冬季综合评估
利用2019年2月4日00:00到19日23:00期间的地面自动站观测资料, 对RMAPS-ST系统原始模式数据和RISE系统进行逐小时的客观检验评估, 主要对比RMAPS-ST系统与RISE系统在温度分析和1 h临近预报时段的性能差异。
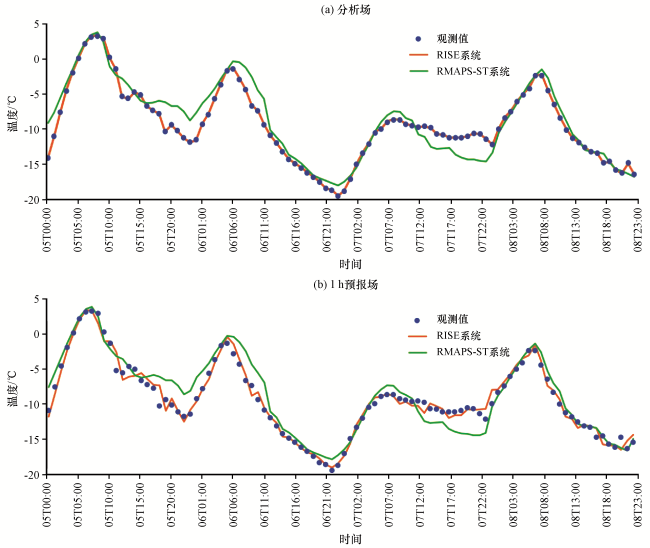
图7给出了国家站53498站在2019年2月5日00:00至8日23:00期间的观测实况、 RMAPS-ST系统数值预报产品和RISE系统后处理产品的时间序列图。如图7(a)所示, 对53498站单个站点的数据进行对比分析, 发现相比于RMAPS-ST系统数值预报结果, RISE系统后处理得到的高分辨率温度分析场时间序列与自动站实况更加吻合, 且与观测之间的差异很小, 这表明100 m分辨率温度分析产品具有较高的准确性。从图7(b)中可以看到, RISE系统的1 h临近预报数据很好地拟合了站点数据, 只是在某些时刻的预报存在一定的偏差。相对而言, RMAPS-ST系统数值预报背景场在该站的时间序列演变与站点数据的偏差较大, 说明RISE系统高分辨率后处理预报产品相对于原始数值预报结果也有较大的改善。
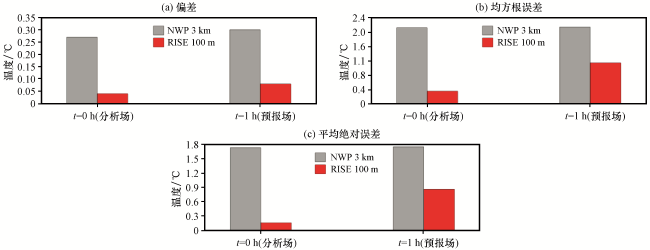
除了单站结果, 下面进一步给出2019年2月4日00:00至19日23:00冬季所有站的综合检验评分结果。从图8中可以看出, RISE的分析场和1 h临近预报场的误差要小于RMAPS-ST系统数值预报结果, 尤其RISE系统分析场的效果相比于RMAPS-ST系统数值预报结果有绝对的优势, BIAS、 RMSE和MAE减小的幅度分别为85.19%, 83.10%和90.75%, 1 h预报误差减小率则分别为73.33%, 46.51%和50.86%。冬季所有站的综合检验结果与单站的分析结果一致, 表明了RISE 系统100 m分辨率产品不仅在分辨率上具备较大的优势, 而且在产品准确性上也具备较大的改进。
5 结论和讨论
本文提出了一种可以平衡模式地形与实际地形影响的三维插值方案, 分析了这种插值方案在复杂地形中进行高分辨率降尺度插值存在误差的原因, 利用高斯模糊算法对插值后的数据进行处理, 消除了在业务中出现的不连续马赛克现象。将该方法试验应用于模式后处理系统中, 得到以下主要结论:
(1) 该方法实现了高分辨率数值预报模式释用产品的精细化和美观性, 从3 km分辨率产品提升到100 m分辨率产品, 从而有助于产品在复杂地形区域取得更佳的实际应用效果。
(2) 基于本文插值方法得到的高分辨率释用产品比原始数值预报产品的各类误差均显著减小, 包括均方根误差、 绝对误差和偏差。
基于高斯模糊的复杂地形下高分辨率三维插值方法既能满足业务上对产品美观化和精细化的要求, 同时更能进一步提高产品的分辨率, 进一步提升产品的质量和准确性。在实际业务应用中, 使用两个分离的一维高斯卷积进一步降低运行计算的时间, 使得这套方案可以成功地部署在业务系统中。此外, 这种方法可以为2022年北京冬奥会的气象服务提供一定的技术和产品支撑, 为冬奥赛事保驾护航。在本文中, 仅以气温为例进行具体分析, 其他气象要素还需在未来进一步探索研究。