

1 引言
青藏高原有着“世界屋脊”之称, 拥有世界上最高的山脉以及复杂的地形、 地貌特征。在高原大地形的动力和热力作用下, 深刻地影响着亚洲地区以及全球的水循环, 是全球天气气候变化的敏感区(梁宏等, 2006; 施小英等, 2008; 吴国雄等, 2004; 徐祥德等, 2014; 周秀骥等, 2009; 陈斌等, 2012)。水汽是大气中非常活跃的气体, 对云降水有重要的作用, 通过三相变化实现凝结、 蒸发、 渗透、 径流等, 参与全球的水循环过程(Gui et al, 2017), 同时也是对局地强对流天气系统形成和演变的关键因子。作为中国东部地区的上游区域, 青藏高原对水汽的屏障作用, 使高原成为一个水汽“转运站”(Chen et al, 2012)。青藏高原的水汽收支直接影响着高原及周边的降水分布和水分循环过程, 尤其对长江中下游夏季旱涝具有重要影响, 因此研究其降水来源对我国水安全和水资源的利用有重要意义。
对于不同地区的水汽收支和输送特征前人已做了大量的研究, 包括了水汽输送的路径、 源汇、 年代际变化及水汽输送与降水的关系等。马京津等(2006)利用HYSPLIT(Hybrid Single Particle Lagrangian Integrated Trajectory)模式及55年的再分析资料, 对华北地区夏季水汽轨迹的年代际变化特征进行了分析。Huang et al(2015)发现四川盆地暴雨的水汽主要来自孟加拉湾和本地, 南海水汽源对盆地东北部的暴雨也很重要。孙力等(2016)研究了2010年7 -8月东北地区三类暴雨的水汽收支情况以及水汽轨迹和不同源地的水汽贡献率。孙颖姝(2018)分析了一次“大气河”背景下东北冷涡暴雨的水汽源地。杨柳等(2018)分析了东亚水汽输送与中国东部季风区夏季降水的关系, 指出四类雨型的水汽输送和收支特征有明显的差异。以上研究加深了对不同地区水汽输送特征的认识, 有助于指导区域水资源管理、 降水异常的气候预测以及灾害性暴雨的预报工作。
对于青藏高原的水汽输送研究, 王霄等(2009)指出夏半年输送至高原的水汽通道主要有三条, 分别为西风带、 印度洋-孟加拉湾和南海-孟加拉湾, 并且占主导的水汽通道随大尺度环流的变化而变化。李江萍等(2012)对比分析了玛曲地区夏季强降水的环流分型及对应的水汽输送路径, 虽然不同等级降水的路径存在差异, 但水汽主要以偏南气流的海洋输送为主。朱丽等(2019)对比研究了黄河源区正负异常年对应的月降水的水汽输送特征, 发现其水汽输送路径、 源汇及其贡献差异明显。总之, 青藏高原不同地区的水汽来源和降水时空分布不均。对于青藏高原中部的水汽研究, 杨梅学等(2004)采用同位素分析法根据 的比率确定藏北高原夏季的水汽来源为孟加拉湾、 印巴次大陆和阿拉伯海。该方法得出的结果可靠性较高, 但局限性较大, 应用范围窄。李生辰等(2009)使用欧拉法分析了三江源地区的水汽输送特征发现在大尺度环流背景和高原地形引起的特殊天气系统的影响下, 不同边界的水汽输送存在明显的季节差异。该方法计算的水汽通量具有瞬时性, 致使得到的水汽输送通道较简单(James et al, 2004), 不能客观得出主要的水汽输送通道, 也不能定量水汽源地对降水的贡献率, 而拉格朗日方法能弥补欧拉方法的缺陷, 能更加客观、 定量地分析出不同水汽通道, 明确各通道的相对重要性。
位于藏北高原的那曲地区是众多河流的发源地或支流的流经地, 有着丰富的冰川融水和地下水资源, 为周边和下游地区提供了充足的水源, 是大气水分循环的重要研究区。本文将利用HYSPLIT模式对高原中部夏季水汽的输送特征进行分析研究, 确定高原中部夏季水汽的主要来源。分析高原中部夏季不同等级降水的水汽输送特征, 比较不同等级降水水汽的轨迹、 输送过程中物理量的变化以及贡献率, 以期对高原地区降水的水汽输送特征和水循环过程有进一步认识。
2 资料来源与方法介绍
2.1 研究区概况
那曲地区处于藏北高原腹地, 东西距离1156 km, 南北距离760 km, 平均海拔达4500 m以上, 地理区域为83°55′E -95°05′E, 29°55′N -36°30′N。南边是念青唐古拉山, 北边有昆仑山和唐古拉山脉的阻挡。每年的5 -9月, 在南亚夏季风影响下, 降水集中, 期间降水量约占全年总降水量的88%(洛桑卓玛等, 2014), 为高原季风气候区的代表。
研究时段为2014年夏季(6 -8月), 该年印度夏季风偏弱, 6月6日印度夏季风首先在喀拉拉邦地区爆发, 较常年同期偏晚5天, 于7月17日在整个印度半岛建立, 较常年偏晚2天。西太副高偏强、 偏南, 中国地区降水呈“北少南多”分布。那曲地区该年夏季气温较常年偏高0.5~1 ℃, 降水也较常年同期偏多(宋连春, 2015)。
2.2 资料来源
降水资料选自中国气象局国家气象信息中心发布的中国地面气候资料日值[20:00(北京时, 下同)至次日20:00]数据集(V3.0)。选取2014年6 -8月那曲站(31.29°N、 92.04°E, 海拔4507 m)日降水量资料进行降水分型。高原地区的日降水等级标准为: 小雨(0.1~5.0 mm)、 中雨(5.1~14.9 mm)、 大雨(15.0~24.9 mm)、 暴雨(25.0~49.9 mm)(全思航等, 2019)。根据该标准统计2014年6 -8月产生降水的天数后得出小雨32天、 中雨21天、 大雨5天、 暴雨1天, 说明那曲降水主要以小雨为主, 中雨次之, 大雨频次较少, 暴雨最少。
HYSPLIT模式运行数据为全球资料同化系统将NECP/NCAR资料进行同化计算得到的GDAS资料(时间分辨率为 3 h, 空间分辨率为 0.5°×0.5°)。文中所涉及的地图是基于国家测绘地理信息局标准地图服务网站下载的审图号为GS(2016)2948和GS(2016)1550的标准地图制作, 底图无修改。
2.3 方法介绍
2.3.1 HYSPLIT模式简介
由NOAA和澳大利亚气象局联合开发的拉格朗日混合单粒子轨道模式(Draxler et al, 1997), 能够支持多种格式的气象输入场, 除了可以计算气团的轨迹, 还用于模拟复杂的扩散和沉降。早期主要用于研究污染物的传输和扩散, 随着模式的发展, 如今应用越来越广泛。该轨迹模式可以进行前向模拟和后向模拟, 追踪气块的运动, 分析气块的去向和来向。计算方法为: 假设质点的轨迹随风场运动, 通过空间和时间的线性插值得到三维速度矢量, 最终模拟的轨迹为质点在空间和时间上位置矢量的积分, 计算公式如下:
,
,
式中: 为时间步长; 为气块初始位置; 为初始位置的三维速度矢量; 为气块初始假想位置; 为初始假想位置的三维速度矢量; 为气块最终位置。
2.3.2 后向轨迹模拟方案
方案一: 为了研究高原中部夏季水汽输送特征, 分析那曲地区夏季水汽输送轨迹的月、 旬变化。选取那曲站为模拟初始点经纬度, 500 hPa在那曲地区距离近地面约1000 m, 因此取距离地面1000 m的高度层次为模拟初始高度, 取2014年6 -8月的GDAS资料模拟初始点向后追踪10天的三维运动轨迹, 每隔3 h重新后向追踪模拟10天, 分别得到6、 7、 8月水汽输送轨迹240, 248和248条。
方案二: 降水是水循环中一个至关重要的环节, 为了更好地区分那曲夏季不同等级降水的水汽来源, 选取那曲站为模拟初始点经纬度, 取距离地面1000 m(约500 hPa)的高度层次为模拟初始高度, 取不同等级降水模拟初始点向后追踪7天, 并插值得到相应位置上气团的物理属性, 每隔24 h输出轨迹点的位置, 每隔1 h重新后向模拟7天, 分别得到500 hPa高度上小雨、 中雨和大雨轨迹768, 504和120条。
2.3.3 轨迹聚类分析法
模式输出的轨迹条数较多, 为了更加直观清晰地分辨出目标点的水汽来向和占比, 采用聚类分析法对大量轨迹按照最接近的原则进行合并分组。根据总空间方差(Total Spatial Variance, TSV)的变化图和总空间方差变化率确定轨迹聚类的条数, 随着聚类条数的减少, TSV的变化迅速上升, 将TSV大幅增加的几个点之前的数暂定为聚类条数, 进一步计算TSV变化率, 最终将轨迹数小, 变化率小的数作为轨迹聚类数。
2.3.4 气块追踪分析法
一种客观定量的轨迹分析方法, 在水汽路径及贡献率分析方面应用广泛(江志红等, 2013)。首先确定后向追踪的气团到达研究区前某一时刻所处位置, 然后统计 的网格内气块的个数, 最后计算每个区域网格内的贡献率。不同区域网格内的气块以及水汽输送贡献率为:
,
式中: 和 分别表示网格内的气块及水汽的贡献率; 表示气块最终位置的比湿; m表示该区域网格所包含气块的个数; n表示气块的总数。
3 结果分析
3.1 夏季水汽输送轨迹分析
分析那曲地区夏季逐月逐旬500 hPa水汽输送轨迹[图1(a)~(c)]可知, 该地的水汽主要来自西南和偏西方向, 西南方向的水汽最远可以追溯到印度洋, 偏西方向的水汽最远可以追溯到大西洋。6月上旬(季风爆发)和中旬的水汽主要来源于中纬度西风带和阿拉伯海水汽输送; 6月下旬的水汽可追溯至印度洋, 在相同的追踪时间内却可以追踪至更远, 说明季风有所加强。7月, 西风带水汽输送减弱, 水汽输送的主要位置由30°N北移至40°N, 季风维持, 西南方向的水汽输送占主导。8月上旬和中旬来自西南方向印度洋的水汽轨迹数增多, 夏季风强度进一步加强, 大量的暖湿气流向那曲地区输送; 8月下旬西南方向的水汽轨迹长度缩短至阿拉伯海附近, 说明季风趋于减弱, 西风带水汽输送很弱。从以上分析可看出, 随着南亚夏季风爆发和西风带北移, 西风带水汽输送逐渐减弱, 高原以南西南风加强, 在夏季风系统环流的影响下, 水汽呈自西向东的纬向输送, 受孟加拉湾季风槽的影响在90°E转为向北的经向输送, 强劲的西南季风携带来自印度洋的水汽经索马里-阿拉伯海-印度半岛-孟加拉湾从喜马拉雅山中段雅鲁藏布江河谷等地进入那曲, 小部分从高原西南部翻越喜马拉雅山脉到达研究区。通过对6 -8月所有轨迹进行聚类后发现[图1(d)], 夏季向那曲地区输送水汽的通道有5条, 分别可以追溯到印度洋、 阿拉伯海、 孟加拉湾、 大西洋附近以及中亚地区, 其中孟加拉湾通道的轨迹数量占比最大, 达到了44%, 是夏季水汽输送最主要的通道, 来自大西洋的轨迹数量最少, 仅为7%; 来自西南气流的水汽轨迹数量百分比相加后达73%, 说明夏季高原地区的水汽输送主要来自西南方向。
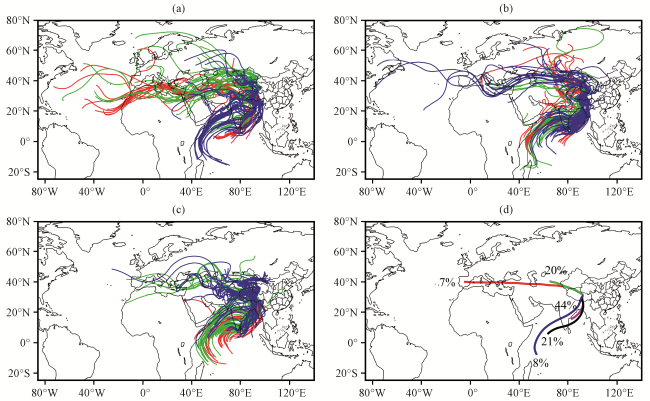
图1 2014年那曲地区6月(a)、 7月(b)和8月(c)水汽后向轨迹及6 -8月轨迹聚类及对应的轨迹数量百分比(d)红色代表上旬, 绿色代表中旬, 蓝色代表下旬 Fig.1 Backward trajectories of the moisture at the Naqu region in June (a), July (b) and August (c), trajectory clustering and the corresponding percentage of the number of tracks from June to August (d) in 2014.Red represents the first ten-day period of a month, green represents the midmonth, blue represents the last ten-day period of a month |
综上所述, 那曲地区夏季水汽输送轨迹的变化主要是由于夏季风的向北推进和中纬度西风带的北移造成的, 该年夏季风于6月上旬爆发, 8月下旬减弱, 向高原的西南暖湿气流输送逐渐占主导, 致使青藏高原雨季来临。这也印证了青藏高原水汽来源及其输送与大尺度环流密切相关, 特别是由西南气流输送的南亚夏季风(张人禾, 2001)。不同之处在于多了来自大西洋和中亚的水汽输送路径(杨梅学等, 2004)。
3.2 夏季不同等级降水的水汽输送轨迹聚类分析
3.2.1 小雨的水汽输送轨迹分析
在500 hPa上模拟得到768条轨迹, 聚类分析后得到5条轨迹, 即输送至那曲上空500 hPa的水汽通道有5条[图2(a)], 其中南方路径2条, 其中53%的偏南路径(路径1)来自孟加拉湾, 经偏北路径进入印度东北部、 不丹, 翻越喜马拉雅和念青唐古拉山脉到达那曲地区; 23%的西南路径(路径3)水汽来源于阿拉伯海附近, 经东北路径转北方路径, 经过印度半岛、 孟加拉湾、 孟加拉国、 印度东北部、 不丹, 翻越喜马拉雅山和念青唐古拉山脉到达那曲地区。西方路径3条, 其中8%的西方路径(路径2), 水汽来源于印度北部的拉贾斯坦运河, 经东方路径, 途径尼泊尔, 翻越喜马拉雅山和冈底斯山脉到达那曲地区; 5%的偏西路径(路径4), 水汽可以追溯到土耳其东部的凡湖, 经偏东路径, 经过伊朗、 里海、 土库曼斯坦、 阿富汗、 巴基斯坦、 藏北高原到达那曲地区; 11%的西北路径(路径5), 水汽来源于新疆伊犁河, 经东南路径转南方路径, 翻越天山山脉, 经过塔里木盆地, 翻越昆仑山和唐古拉山到达那曲地区。
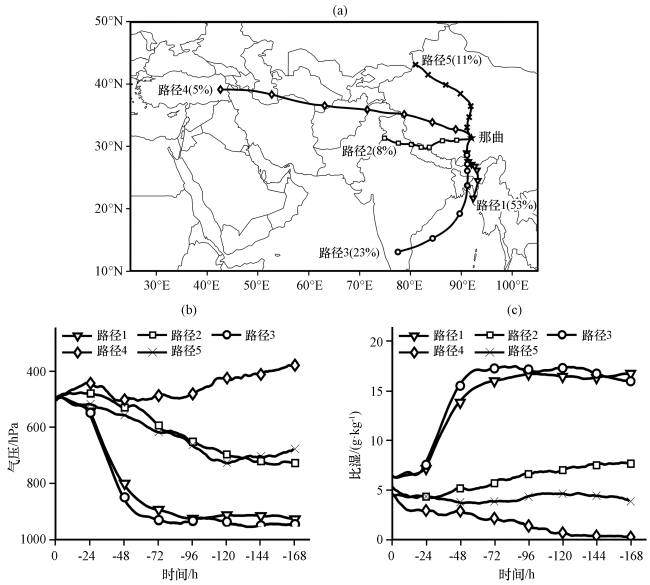
从不同路径的气团输送过程中气压、 比湿的演变[图2(b), (c)]可以发现, 来自海洋的气团(路径1和3)位于900 hPa以下的对流层低层, 受海洋面水汽蒸发的影响水汽含量较大, 气块的初始湿度较高, 最大比湿接近17 g·kg-1, 在输送过程中随着地形逐渐爬升水汽流失, 当气团上升至800 hPa, 比湿由15 g·kg-1逐渐下降, 最终输送到那曲地区500 hPa高度时比湿在6~7 g·kg-1。而路径2和5的水汽相对较干, 初始高度在700 hPa左右, 输送过程中比湿变化不明显, 路径5的气块在进入塔里木盆地后高度降低, 而后翻越高大山脉高度又逐渐升高。西方通道(路径4)最干, 气团的轨迹高度和质点起始高度最高, 源地的比湿几乎为0 g·kg-1, 在向那曲输送的过程中比湿缓慢上升但最终比湿仍小于来自海洋的气团。
小雨主要的水汽输送路径有5条, 南方路径轨迹条数占到76%, 水汽来自暖湿的海洋。西方路径的气团较为干冷, 其高度和湿度的变化明显不如南方两个通道剧烈, 最终到达降水区的比湿也更少。
3.2.2 中雨的水汽输送轨迹分析
在500 hPa上模拟得到504条轨迹, 聚类分析后得到4条轨迹, 即输送至那曲上空500 hPa的水汽通道有4条[图3(a)], 南方路径2条, 其中源自孟加拉湾(路径1)的轨迹数目最多, 占到63%, 轨迹以及高度和比湿的变化与小雨的路径1相似; 21%的西南路径(路径3)是来自阿拉伯海卡奇湾, 经东北路径, 经过印度半岛、 尼泊尔, 翻越喜马拉雅山到达那曲地区。西方路径2条, 其中12%的西北路径(路径2), 水汽来源于新疆的阿克苏河, 经偏东路径转南方路径, 经过塔里木盆地, 翻越昆仑山和唐古拉山脉到达那曲地区; 偏西路径占4%(路径4), 水汽来源可以追溯到黑海, 经偏东路径, 经过土耳其、 里海、 土库曼斯坦、 阿富汗、 巴基斯坦、 藏北高原到达那曲地区, 其高度和比湿的变化与小雨的路径4相似。
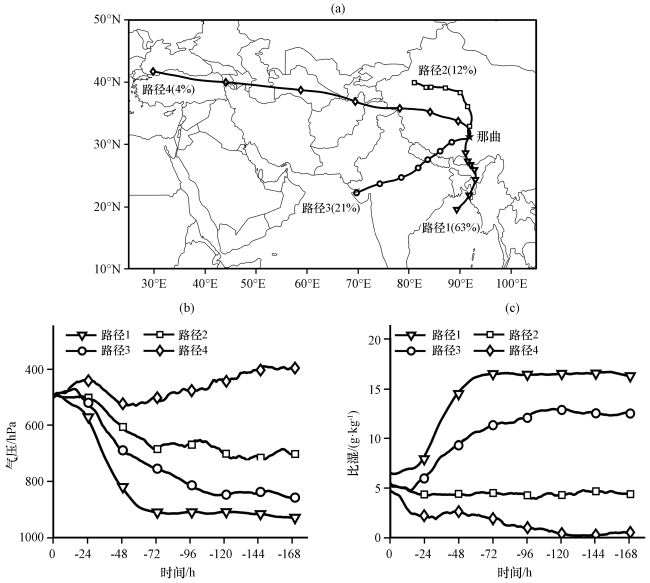
中雨主要的水汽输送路径有4条, 南方路径轨迹条数占到84%, 携带了比小雨更多的水汽。西方路径的干冷空气变为2条, 少了来自印度北部的水汽输送。气团进入高原后(-2天), 受地形影响各通道气团都有不同程度的抬升, 其中孟加拉湾通道的气团抬升最强烈, 比湿变化也最剧烈。
3.2.3 大雨的水汽输送轨迹分析
在500 hPa上模拟得到120条轨迹, 聚类分析后得到2条轨迹, 即输送至那曲上空500 hPa的水汽通道有2条[图4(a)], 均为南方路径, 其中47%的偏南路径(路径1)来自孟加拉湾, 轨迹以及高度和比湿的变化与小雨和中雨的路径1相似; 53%的西南路径(路径2), 水汽来源于阿拉伯海, 其轨迹以及高度和比湿的变化与小雨的路径3相似, 但轨迹数量百分比明显更多。
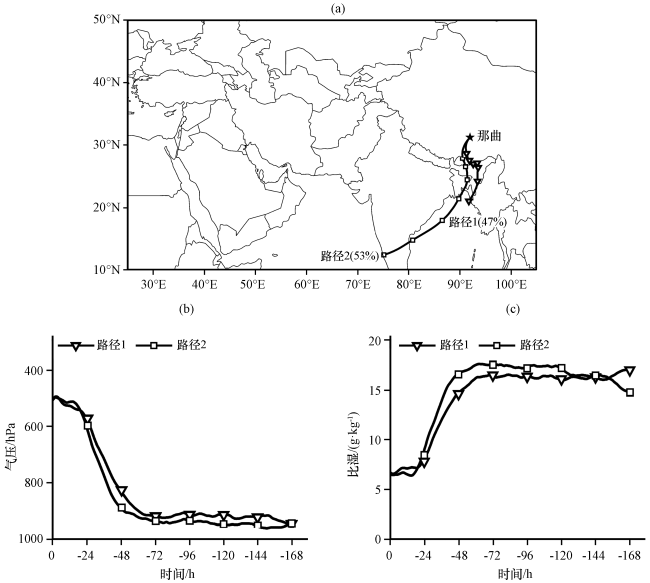
大雨主要的水汽输送路径有2条, 高度和比湿的变化基本一致, 水汽全都来源于海洋, 西南暖湿气流的输送为降水区提供了能量与水汽。这与江吉喜等(2002)结论一致。
综上所述, 运用HYSPLIT模式模拟得到了不同等级降水的水汽输送轨迹以及高度和比湿的变化, 发现小雨和中雨存在南方路径和西方路径, 而大雨只存在南方路径, 说明降水量越大水汽来源越集中。南方路径的轨迹数量百分比为小雨<中雨<大雨, 说明来自海洋(南方路径)的水汽输送对降水等级具有决定性作用。结论与孙力等(2016)一致。南方路径的水汽源自贴近洋面的低层, 携带水汽丰富, 而西方通道由于海拔更高以及气团运行路径较长, 携带的水汽量少于南方水汽通道。海洋丰富的水汽在输送过程中受到高原大地形的阻挡, 在山脉迎风坡一侧凝结产生降水, 损失了大量的水汽, 最终到达研究区上空时比湿相差不大, 说明降水的产生不仅需要良好的水汽供应, 热力和动力条件也很重要。
3.3 夏季不同等级降水水汽输送贡献率
前人研究表明, 水汽通道及其对应通道上的轨迹数量百分比与通道的水汽输送贡献率不同(王佳津等, 2015), 利用比湿计算的水汽贡献率更能反映出水汽的源区。下文将继续讨论不同等级降水到达降水区1、 3和7天前的水汽输送贡献率的水平分布。
图5,6,7给出了不同等级降水、 不同追踪时间的水汽输送贡献率分布。1天前(图5), 水汽主要来自研究区周围, 小雨和中雨水汽来源的范围比大雨大, 大雨水汽来源相对集中。水汽输送贡献的大值区都位于雅鲁藏布江附近。3天前(图6), 小雨的水汽向北可以追踪到巴湖, 中雨向东可以追踪到四川, 大雨水汽较集中, 有少部分来自青海。水汽贡献的大值区都处于印度与不丹的交界。小雨和中雨比较而言, 中雨有部分孟加拉湾的贡献。7天前(图7), 小雨和中雨的水汽贡献大值区为缅甸、 印度、 孟加拉国、 孟加拉湾, 中雨的水汽向南可追踪至印度洋。大雨的水汽贡献大值区为缅甸、 印度、 孟加拉国、 孟加拉湾、 斯里兰卡以及阿拉伯海。
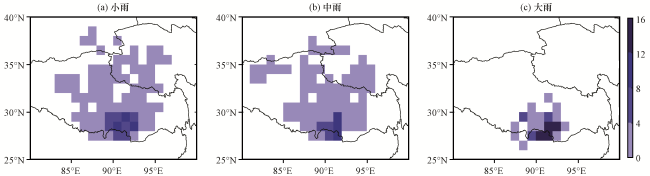
图5 2014年夏季那曲地区后向追踪1天不同等级降水的水汽输送贡献率(单位: %)Fig.5 Back tracking for one day the contribution rate of water vapor transport for different levels of precipitation at the Naqu region in summer of 2014.Unit: % |
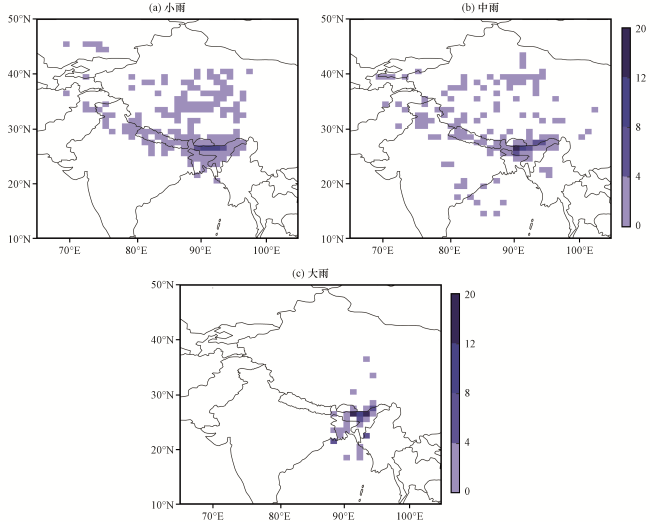
图6 2014年夏季那曲地区后向追踪3天不同等级降水的水汽输送贡献率(单位: %)Fig.6 Back tracking for three days the contribution rate of water vapor transport for different levels of precipitation at the Naqu region in summer of 2014.Unit: % |
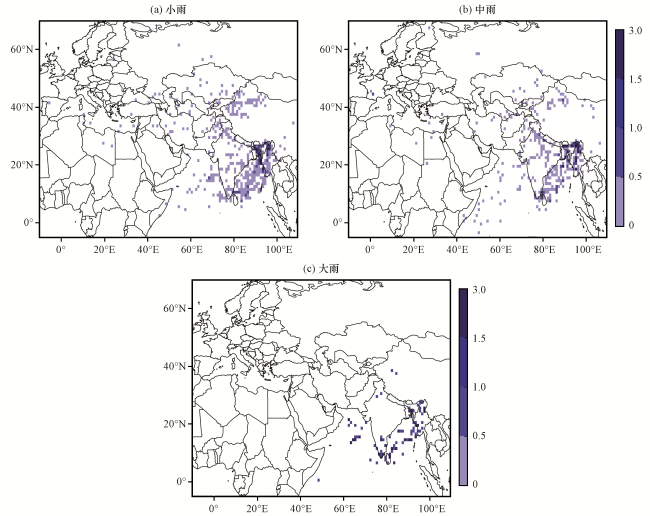


综上所述, 不同等级降水1天和3天前的水汽来源大值区分别都来自雅鲁藏布江、 印度与不丹的交界, 而7天前水汽来源的大值区有所区别, 大雨的水汽来源较小雨和中雨更集中。根据7天前水汽贡献的分布可以大体确定水汽的源地, 小雨的水汽源地为阿拉伯海、 孟加拉湾、 印度、 新疆以及中亚地区; 中雨的水汽源地为印度洋、 阿拉伯海、 孟加拉湾、 印度、 新疆以及中亚地区; 大雨的水汽源地为阿拉伯海和孟加拉湾。根据贡献率的大小, 可知夏季来自海洋的水汽输送对高原地区的降水具有重要贡献。同时, 水汽贡献分布集中的区域与水汽轨迹追踪的终点也有较好的对应关系。
4 结论与讨论
采用HYSPLIT拉格朗日模式进行水汽输送轨迹的模拟, 对那曲地区2014年夏季水汽输送轨迹以及不同等级降水进行了分析研究, 得出以下结论:
(1) 夏季输送至那曲地区的水汽可以追溯至印度洋和大西洋; 6月上旬南亚夏季风爆发, 随着夏季风的推进和西风带的北移, 西风带水汽输送逐渐减弱, 西南暖湿气流输送占据主导地位; 来自西南方向的水汽从喜马拉雅山中段雅鲁藏布江等地以及西南部翻越喜马拉雅山脉输送至那曲; 印度洋、 阿拉伯海、 孟加拉湾、 大西洋和中亚为5条主要的水汽输送路径。
(2) 聚类水汽输送轨迹后, 发现小雨和中雨存在南方路径和西方路径, 而大雨只存在南方路径, 来自海洋的水汽输送对降水等级具有决定性作用; 来自海洋的水汽主要来自对流层低层且较为暖湿, 而西风带水汽较为干冷, 且高度和比湿的变化不如前者剧烈。
(3) 1天前水汽来源大值区为雅鲁藏布江流域; 3天前水汽来源大值区为印度与不丹的交界; 大雨的水汽来源较小雨和中雨更加集中; 水汽贡献率分布集中的区域与水汽轨迹追踪的终点有较好的对应关系。
(4) 小雨的水汽源地为阿拉伯海、 孟加拉湾、 印度、 新疆以及中亚地区; 中雨的水汽源地为印度洋、 阿拉伯海、 孟加拉湾、 印度、 新疆以及中亚地区; 大雨的水汽源地为阿拉伯海和孟加拉湾。
前人的研究中指出南海对青藏高原的水汽输送有一定的贡献, 而本文的研究中不存在南海的水汽输送, 期望未来能够利用FLEXPART(FLEXible PARTicle dispersion model)做进一步的对比研究。