

1 引言
2 模式介绍和资料来源
2.1 全球气候模式
2.2 区域气候模式
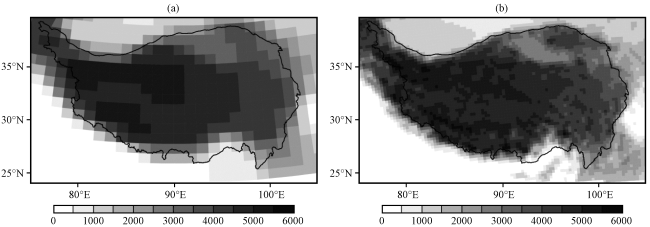
2.3 资料来源
3 结果分析
3.1 模式对高原总降水率的模拟评估
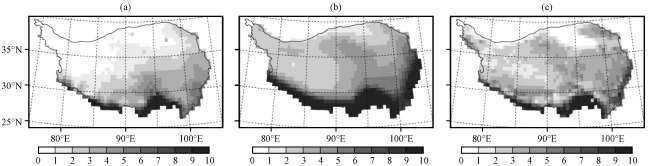
图2 1998 -2005年TRMM 3B43 (a), CCSM (b), WRF (c)数据中高原湿季(5 -9月)总降水率的空间分布 (单位: mm∙d-1)Fig.2 Spatial distributions of the wet season (from May to September) total precipitation rate over the QTP for TRMM 3B43 (a), CCSM (b) and WRF (c) from 1998 to 2005.Unit: mm∙d-1 |
表1 1998 -2005年TRMM 3B43, CCSM和WRF数据中高原湿季总降水率的统计量Table 1 Annual mean wet season total precipitation rate averaged over the QTP for TRMM 3B43, CCSM and WRF from 1998 to 2005 |
| 月份 | 平均值/(mm∙d-1) | 偏差/(mm∙d-1) | 均方根误差/(mm∙d-1) | ||||
|---|---|---|---|---|---|---|---|
| TRMM | CCSM | WRF | CCSM | WRF | CCSM | WRF | |
| 5 | 1.71 | 4.02 | 2.66 | 2.31 | 0.95 | 3.49 | 1.92 |
| 6 | 2.92 | 5.88 | 3.81 | 2.96 | 0.89 | 4.79 | 1.94 |
| 7 | 3.56 | 6.67 | 4.76 | 3.11 | 1.2 | 4.73 | 2.42 |
| 8 | 3.34 | 5.73 | 4.15 | 2.39 | 0.81 | 3.84 | 2.50 |
| 9 | 2.19 | 4.28 | 3.12 | 2.09 | 0.93 | 3.04 | 1.70 |
| 平均 | 2.74 | 5.32 | 3.70 | 2.58 | 0.96 | 3.55 | 1.74 |
偏差和均方根误差为WRF/CCSM与TRMM 3B43计算得出 |
3.2 模式对高原对流降水比例的模拟评估
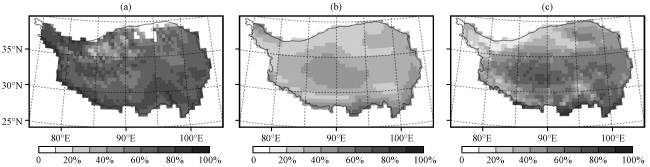
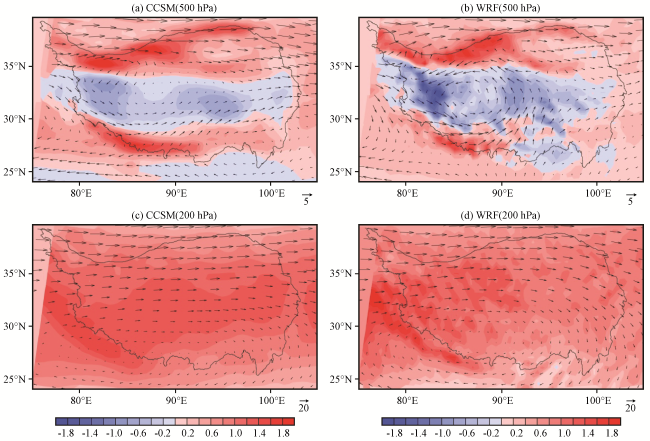
图4 CCSM (a, c)和WRF (b, d)模式模拟的1998-2005年高原湿季的500 hPa(a, b)和200 hPa(c, d)风场(矢量, 单位: m∙s-1)及其散度(彩色区, 单位: s-1)的空间分布Fig.4 The wet season averaged wind field (vector, unit: m∙s-1) and divergence (color area, unit: s-1) at 500 hPa (a, b) and 200 hPa (c, d) over the QTP for CCSM (a, c) and WRF (b, d) simulated from 1998 to 2005 |
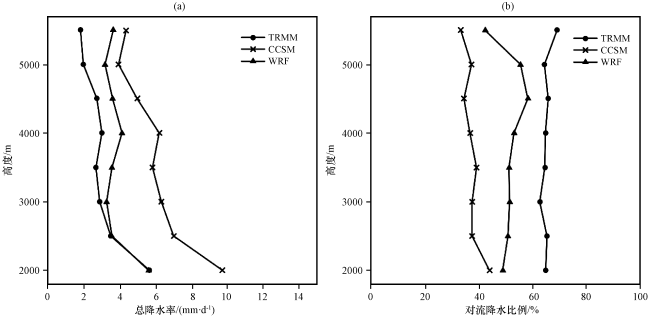
3.3 高原降水随海拔的变化特征
3.4 高原未来降水的空间变化特征
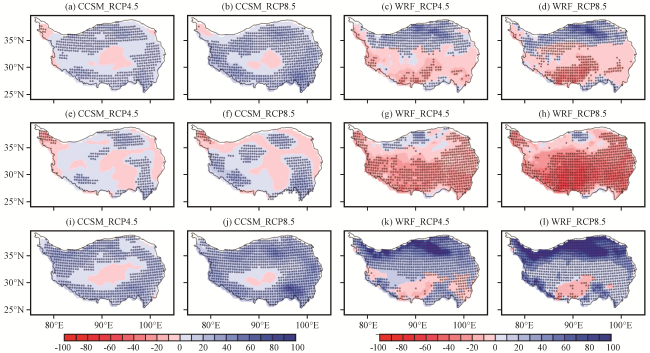
图6 CCSM和WRF模式预估的高原湿季总降水(a~d)、 层云降水(e~h)和对流降水(i~l)在RCP4.5和RCP8.5情景下未来(2070 -2099年)相对于历史时期(1980-2005年)的相对变化(单位: %)黑色圆点表示通过了0.05显著性检验 Fig.6 Relative changes of the total (a~d), stratiform (e~h), convective (i~l) precipitation projected by CCSM and WRF for wet season in the future (from 2070 to 2099) under the scenario of RCP4.5 and RCP8.5 compared to the historical period (from 1980 to 2005).Unit: %.Black dots denote the changes have passed the significant level at 0.05 |
表2 CCSM和WRF模式预估的高原湿季总降水、 层云降水和对流降水在RCP4.5和RCP8.5情景下未来(2070 -2099年)相对于历史时期(1980 -2005年)的相对变化率Table 2 Projected relative changes of the wet season total, stratiform and convective precipitation averaged over the QTO in the future (from 2070 to 2099) under the scenario of RCP4.5 and RCP8.5 compared to the historical period (from 1980 to 2005) for CCSM and WRF |
| 降水 | CCSM | WRF | ||
|---|---|---|---|---|
| RCP4.5 | RCP8.5 | RCP4.5 | RCP8.5 | |
| 总降水 | 6.19% | 10.75% | 6.93% | 10.59% |
| 层云降水 | 3.93% | 5.68% | -9.87% | -18.92% |
| 对流降水 | 10.67% | 20.11% | 29.91% | 51.82% |
3.5 高原未来降水变化随海拔的分布特征
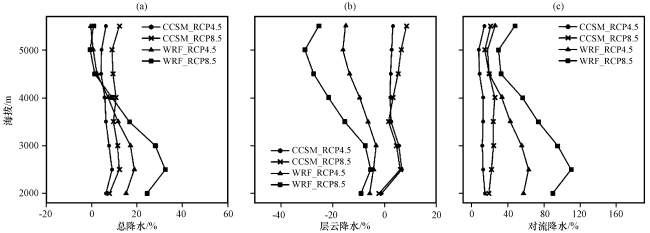


图7 CCSM和WRF模式预估的高原湿季总降水(a)、 层云降水(b)和对流降水(c)在RCP4.5和RCP8.5情景下未来(2070 -2099年)相对于历史时期(1980 -2005年)的相对变化随海拔分布Fig.7 Linear trends of relative change of total, stratiform and convective precipitation with elevation from the CCSM and WRF for wet season in the future (from 2070 to 2099) under the scenarios of RCP4.5 and RCP8.5 compared to historical from 1980 to 2005 |