

1 引言
全球气候系统自20世纪以来不断增暖, 1906 -2005年全球平均地表温度已升高了0.74±0.18 ℃, 科学家们还预测未来地表气温仍将持续增加。全球变暖已引发一系列威胁人类生存的问题, 例如冰川融化、 海平面上升、 冰冻圈退缩和极端事件频发等(Jevrejeva et al, 2010; 秦大河, 2014; Zhao et al, 2016; 李宗省等, 2010; 李红梅等, 2015)。随研究的不断深入, 越来越多的研究表明, 人类活动所排放的过量温室气体是导致近百年全球变暖的主因(IPCC-AR5)。然而, Knight et al(2009)基于全球实测气温数据和再分析资料发现, 自1998年开始全球陆地平均温度的长期变暖趋势中出现了一个相对停滞的间歇性时段。在之后的研究中称这一特殊现象为全球增温减缓(或停滞)现象。上述研究表明全球平均地表温度并没有随温室气体的增多而继续上升(Foster et al, 2011), 这挑战了现有研究对于全球温度变化的解释机制, 而“温室气体是全球变暖的主因”的真实性也引起了科学家们的热烈讨论。
众多学者对全球增温减缓现象及其成因进行了深入研究, 并得到很多重要结论, 主要概括为两类观点: 第一类认为全球增温减缓现象与气候内部变率密切相关, 尤其是海洋内部变率。如太平洋多年代际振荡的负位相(Meehl et al, 2014; Trenberth et al, 2014; Dai et al, 2015)、 信风加强导致的赤道东太平洋变冷(Kosaka et al, 2013; England et al, 2014)、 北大西洋涛动(NAO)的负位相(Huang et al, 1998; Higuchi et al, 1999; Guan et al, 2015)等。部分学者从能量平衡的角度理解全球增温减缓现象, 认为进入气候系统内部的能量进行了再分配。有更多热量(由温室气体排放导致)从上层海洋传输进了大西洋等深层海域(Chen et al, 2014), 从而暂时减缓了上层海洋和大气温度的持续上升(Katsman et al, 2011)。第二类观点认为除了海洋的影响, 大气响应也发挥着关键作用。太阳活动变化或平流层水汽增加可能导致大气顶部辐射减少(Solomon et al, 2010; Kaufmann et al, 2011); Hu et al(2018)指出增温减缓时期从海洋向大气传递的潜热能增加, 且由于云量增加引起太阳能吸收减少, 向地表的总辐射通量减少; 大气中的微小颗粒(气溶胶)可以通过吸收辐射导致变暖, 也可以通过散射和反射辐射导致变冷; 其他人为影响, 如城市热岛、 土地使用或土地覆盖的变化和灌溉, 在区域范围内也影响着气候变化。
20世纪下半叶的全球变暖进程中, 冷季的地表气温相较于暖季出现了更显著的增暖(IPCC-AR5)。而同时, 在近十年的全球增温减缓时期, 冷季相对于暖季出现了更明显的气温下降现象(Huang et al, 2016), 各国气象学者针对冷季出现的增温减缓现象做了不少的研究。Guan et al(2015)应用改进的动力分解方法(Wallace et al, 2012)从原始气温提取动力温度, 指出北半球冷季增温减缓现象是由于动力温度抵消了辐射强迫温度的增暖而导致的。Huang et al(2016)进一步从全球尺度和大气环流的角度探究了北半球冷季出现增温减缓的动力机制, 指出北半球阻塞事件的增多使更多的冷空气从极地传入了中高纬地区。在以往对全球增温减缓的研究中主要着眼于冷季, 还少有对暖季气温如何变化及其成因进行讨论和分析。因此, 本文首先根据东英吉利大学气候研究中心(CRU)的地表气温资料分析了全球增温减缓时期北半球陆地暖季气温的时空变化特征, 并基于500 hPa位势高度场、 阻塞高压和极端高温事件的变化来初步探讨气温变化的可能原因。
2 资料选取和方法介绍
2.1 地表气温数据
气温资料为CRU提供的TS4.01全球地表月平均温度数据, 空间分辨率为0.5°×0.5°。研究时段选取1901 -2015年, 暖季选取当年5 -9月, 冷季选取11月至次年3月。
2.2 位势高度场数据
近年来, 欧洲中期天气预报中心(ECMWF)发布的第3代ERA-Interim再分析资料因其优势已经在气候研究领域得到广泛应用(曹杨等, 2017; 刘菊菊等, 2018; 杨朝虹等, 2018; 李黎等, 2019)。本文使用的是ERA-Interim提供的1994 -2013年暖季(5 -9月)位势高度场逐日数据, 其空间分辨率为2.5°×2.5°, 垂直方向从1000~1 hPa共计37层, 本文选用500 hPa高度层的数据。
2.3 日最高气温数据
逐日最高地表气温数据来源于美国气候预测中心(CPC)的再分析资料, 本文研究时段为1980 -2013年, 空间分辨率为0.5°×0.5°。
2.4 极端高温事件的定义方法
将第90个百分位值作为某格点的极端高温阈值, 阈值确定方法具体如下(陈少勇等, 2012): 对某一格点某年的暖季逐日最高气温按升序排列, 得到该年该格点第90个百分位值所代表的最高温度, 以此类推可得到该格点1980 -2013年共34年的最高温度的第90个百分位值, 取34年的平均值将其作为该格点的极端高温阈值。在确定了极端高温阈值的基础上, 将格点上逐年暖季日最高气温与其阈值进行对比, 当某日的最高温度高于该阈值, 就把该日计入高温日数。
2.5 阻塞高压的统计方法
阻塞高压(简称阻高)是存在于中高纬度地区的大气环流持续性异常系统(Rex, 1950), 它的建立与崩溃往往伴随着大范围的天气异常现象(仇永炎, 1985)。早在20世纪中期, 已有大量气象学者对阻高开展了研究, 其中如何客观定量地表征阻高是一个至关重要的研究课题(金荣花等, 2009)。定义阻高的方法主要分为两个阶段: 第一阶段主要依靠人工查阅地面(或500 hPa)的历史天气图得到主观阻塞高压指数(Treidl et al, 1981), 此方法具有很大的主观性和经验性, 难以推广和处理大批量数据。20世纪70年代后期, 伴随着观测资料质量的提高和计算机的快速发展, 阻高的统计方法发展到第二阶段, 即: 计算500 hPa高度场的位势梯度得到客观定量的阻塞高压指数(Lejenas et al, 1983; Tibaldi et al, 1990; 季明霞等, 2008), 此方法大大提高了检索阻高活动的效率。
本文采用了二维阻高指数(Davini et al, 2012), 它是根据1990年Tibaldi et al(1990)提出的一维阻高指数(TM指数)拓展到二维, 通过判断500 hPa高度场的某经度上南北位势梯度是否发生反转来定义阻塞事件。下面介绍其基本原理, 首先计算出每个经度上500 hPa位势高度场的南、 北梯度值:
式中: 、 是3个参考纬度, , , 其中 分别为 -2.5°, 0°, 2.5°(TM最初定义的纬度间隔为4°)。当某特定经度符合了以下两个条件:
则该日定义为出现阻塞形势。本文需要确定一个区域是否有阻塞高压, 还要在此基础上满足空间和时间的双重连续性, 即如果一个“阻塞形势”在纬向至少连续15°且持续5天以上, 就定义为一个区域阻塞事件。每年暖季发生的阻塞频率为阻塞天数除以总天数。
2.6 集合经验模态分解方法
使用的尺度分析方法是Wu et al(2009)提出的集合经验模态分解(Ensemble Empirical Mode Decomposition, EEMD)方法, 它是一种用于分离不同时间尺度的一维数据分析方法(Ji et al, 2014)。其原理是将原始的非线性时间序列分解为一系列不同时间尺度的本征模态函数(Intrinsic Mode Function, IMF), 进而揭示数据的非线性以及非定常性。利用该方法能够将气温时间序列分解为不同时间尺度的分量, 包括年际、 年代际尺度变率以及长期趋势等。在本文的EEMD分解过程中, 白噪音序列的幅度是原始数据标准差的0.2倍, 集合平均成员的数目为400, IMF的数量为6, 详细步骤参考Ji et al(2014)的文献。
2.7 相对贡献的计算方法
北半球陆地暖季气温变化具有显著的区域性差异, 为了量化这种空间特征, 本文计算了每个格点相对于北半球平均增温(降温)速率的贡献率 。北半球平均增温(降温)趋势是用 计算的, 为所有温度趋势为正(负)的格点个数。每个格点的贡献率 计算公式为:
式中: 为格点 的温度趋势; 18.0); 为格点所在的纬度; 为所有温度趋势为正(负)的格点个数。下文中计算的区域总贡献为该区域内所有格点的相对贡献之和。
2.8 线性趋势法
利用一元线性回归法对研究变量的变化趋势进行线性分析(吕晶等, 2018), 即建立时间序列t与气象要素y之间的一元线性回归方程, 如果认为y与t是一种统计线性关系, 那么y与t存在如下关系:
式中: 为气候变化趋势; 若 >0, 数值越大, 递增越显著; 若 <0, 绝对值越大, 递减越显著。
3 研究结果与分析
3.1 全球增温减缓时期北半球陆地暖季气温的时空分布特征
图1为1901 -2015年北半球陆地暖季和冷季平均气温距平的时间序列。从图1中可以看出, 在过去百年尺度上, 冷季和暖季的平均气温均呈冷暖相间、 波动上升的特点。1901 -1940年和1980 -2000年分别为两次增暖过程, 冷季和暖季温度均显著上升; 1940 -1980年为一次变冷过程, 两者均表现为降温。2001 -2013年冷季和暖季温度表现为不同的变化趋势: 冷季温度呈现出下降趋势, 降温速率为-0.25 ℃·(10a)-1; 暖季温度则持续增温, 增温速率为0.26 ℃·(10a)-1, 与其在1980 -2000年增温速率相似[0.25 ℃·(10a)-1]。从2014年开始, 冷季气温又从降温转为急剧上升, 使2015年的温度距平达到了器测时代的最高值(2.07 ℃)。目前已有大量研究着眼于21世纪初期冷季气温的增温停滞现象且分析了其出现的物理机制, 却很少有研究分析该时期暖季气温持续上升的原因。本文以21世纪初期冷季出现降温而暖季持续增温的2001 -2013年(全球增温减缓时期)作为研究时段, 重点探讨这段时期内暖季气温的时空变化特征及其原因。
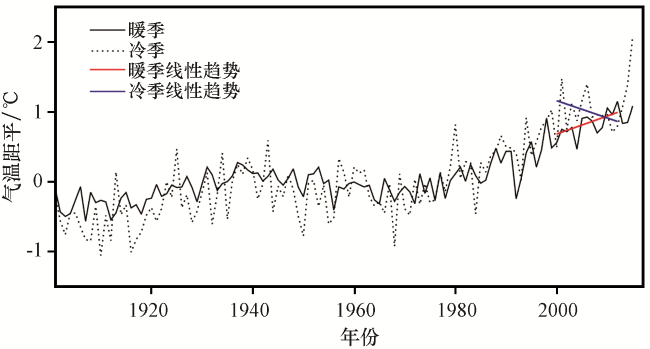
图2(a)为北半球陆地在增温减缓时期暖季气温的线性趋势空间分布。从图2(a)中可以看出, 虽然北半球暖季平均气温在2001 -2013年期间表现为持续上升, 但其变化趋势在空间上具有显著的区域性差异。其中, 欧洲东南部和北美北部是最强的升温中心, 两个区域的气温在10年内增温都超过1.5 ℃, 欧亚大陆东北部和北美东南部也呈现出显著的增温趋势。欧亚大陆中部为大范围的降温区域, 美国西部、 阿拉斯加和加拿大东北部等地区也观测到了小范围的降温现象。为了量化全球增温减缓时期的暖季气温变化的空间特征, 计算了每个格点对于北半球暖季平均增温(降温)趋势的相对贡献[图2(b)], 左(右)上角的红(蓝)色数字分布代表北半球平均增温(降温)趋势。图2(b)中表明2001 -2013年内北半球平均升温趋势为0.47 ℃·(10a)-1, 比同期北半球平均降温趋势[-0.32 ℃·(10a)-1]高出了0.15 ℃·(10a)-1。北半球大部分区域有增暖的贡献, 其中欧洲东南部和北美北部两个区域的增暖贡献最大, 欧洲东南部的区域贡献为9.5%, 北美北部为3.1%。欧亚大陆中部对于北半球降温的贡献为15.6%。
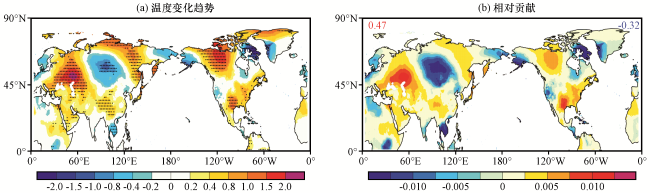
图2 2001 -2013年北半球陆地暖季温度变化趋势[单位: ℃·(10a)-1]及每个格点的相对贡献(单位: %)打点区通过90%的显著性检验 Fig.2 The linear trend in the warm season temperature in the Northern Heimisphers from 2001 to 2013 and the relative contribution of each grid point.The dotted areas pass the significance test of 90% confidence level |
3.2 气温的长期趋势和多年代际变率
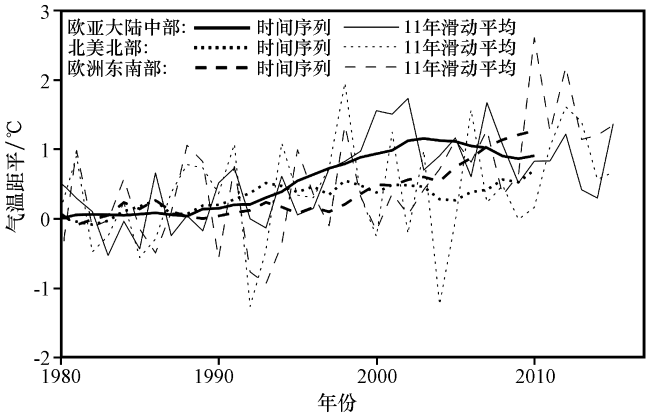
2001 -2013年北半球暖季的温度变化趋势空间分布存在三个显著的变化中心, 即: 欧亚大陆中部(45°N -60°N, 80°E -120°E), 北美北部(50°N -65°N, 90°W -130°W), 欧洲东南部(45°N -60°N, 30°E -70°E), 下面以上述三个区域为代表分析其气温的变化原因。图3分别给出了三个区域的气温距平时间变化曲线及其11年滑动平均。从图3中可以看出, 三个区域的气温变化差异显著, 尤其是从1990年之后。在年代际尺度上, 1990 -2000年欧亚大陆中部的气温以0.90 ℃·(10a)-1的增长率上升, 明显高于北美北部[0.47 ℃·(10a)-1]和欧洲东南部[0.82 ℃·(10a)-1]的增长率, 而2001 -2013年气温距平出现停滞维持在1 ℃左右; 欧洲东南部和北美北部在1990-2000年均表现出相比于欧亚大陆中部缓慢的增温趋势, 而在2001 -2013年, 欧洲东南部的气温以1.26 ℃·(10a)-1的增温率剧烈上升超过了欧亚中部, 北美北部则呈现出与2000年之前相类似的速率缓慢升温。
为了探究全球增温减缓时期三个区域暖季平均气温呈现不同变化的原因, 考虑将其原始温度分解为由于外部强迫导致的变化和内部气候变率调控所导致的变化, 从时间尺度上来看, 二者分别对应气温变化的长期趋势和内部振荡项。气候系统是一个复杂的非线性耦合系统, 气温的变化具有多尺度和非线性(魏萌等, 2016), 而大多数传统的分析方法适用于提取数据在时间、 空间范围内的平均信息, 很难发掘出潜在的物理信息。为此本文使用了EEMD方法来分解原始的气温时间序列。
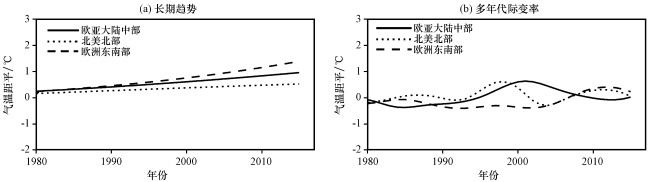
首先分别将三个区域1901 -2015年的气温距平时间序列(图3)进行EEMD分解, 每一条原始气温序列可以分解得到6个IMF分量, IMF1-IMF6的时间尺度依次增加。IMF1-IMF2说明气温的变化表现出非常大的年际波动; 除了年际变率, IMF3-IMF5表明气温的多年代际变率同样很显著; IMF6代表与辐射强迫有关的长期趋势。值得注意的是在几十年时间尺度上, 多年代际变率引起的温度振幅与长期增温趋势的振幅相当。
本文分别提取三个区域原始气温的多年代际变率和长期趋势进行讨论, 把IMF3-5的和作为多年代际变率, IMF6为长期趋势, 对比结果如图4所示。结合图3看出, 原始气温的变化是由气温的多年代际变率和长期趋势的协同作用所主导。从图4中可以看出, 三个区域的长期变化均呈增暖的趋势, 只是程度不同, 这说明由于温室气体导致的温度上升并未停止, 不容忽视其重要的增暖作用。在全球增温减缓期间, 欧洲东南部上升最剧烈, 欧亚大陆中部次之, 北美北部最低。三个区域在全球增温减缓期间的多年代际变率处于不同的冷暖位相, 其中欧亚大陆中部的多年代际变率处于下沉支, 抵消了长期趋势的增暖作用, 使得该区域的温度由前10年的持续增暖转变为增温停滞; 北美北部地区的多年代际变率先下降再上升, 虽然长期趋势持续上升, 但二者的协同作用使得气温先下降再上升; 欧洲东南部的多年代际变率是三个区域里上升最快的, 且长期趋势增暖也最剧烈, 这种多年代际变率造成的升温叠加在长期趋势的增暖之上导致了该区域的气温上升最快。
3.3 全球增温减缓时期北半球暖季气温变化的动力机制
基于以上的分析可以得出, 全球增温减缓时期北半球暖季的三个气温变化中心(欧亚中部、 北美北部、 欧洲东南部)呈现出不同的气温变化均与温度的多年代际变率密切相关, 那么接下来的关键问题是探讨影响气温的多年代际变率的动力机制。首先分析了大尺度环流场的变化, 图5给出了1994 -2003年暖季500 hPa平均位势高度场和2001 -2013年位势高度场的变化趋势分布。从图5中可以看出, 北半球的平均位势高度场由低纬向高纬逐渐降低, 对于中高纬大陆地区, 南部位势高度高, 而北部位势高度低。从2001 -2013年的位势高度变化图来看, 中高纬地区呈现有规律的正负中心相间的波动分布, 其中欧亚大陆中部区域的位势高度降低, 欧洲东南部和北美洲北部两个区域的位势高度升高。且500 hPa环流场的正负中心配置与图2中气温变化的正负中心基本一致: 位势高度升高的区域气温在上升, 反之亦然。对于位势高度升高的区域, 该区域下沉气流会偏强, 导致晴朗无云天气增多, 加强地表的太阳辐射增温, 同理在位势高度降低的区域则相反, 这说明全球增温减缓时期气温的变化与位势高度场的异常变化有关。
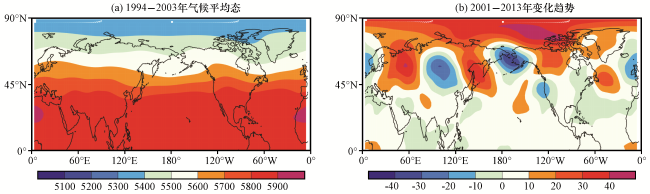
图5 1994 -2003年北半球暖季500 hPa平均位势高度场(a, 单位: gpm); 2001 -2013年北半球暖季500 hPa位势高度场变化趋势[b, 单位: gpm·(10a)-1]Fig.5 500 hPa average geopotential height from 1994 to 2003(a, unit: gpm) and the trend of geopotential height during 2001 -2013 [b, unit: gpm·(10a)-1] in warm season around the Northern Hemisphere |
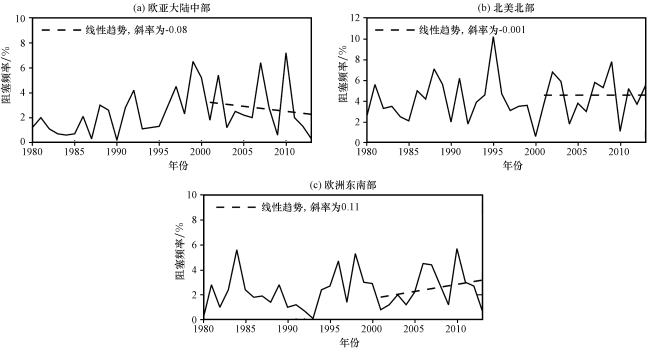
阻高作为存在于中高纬度地区的环流异常系统, 它的建立和崩溃会引起大范围天气异常。全球增温减缓时期北半球500 hPa位势高度场的异常变化(图5)对于阻高的形成会产生重要影响。以下将分析三个典型区域(欧亚中部、 北美北部和欧洲东南部)增温减缓期间暖季阻塞事件的变化特征(区域阻塞事件的定义和阻塞频率的统计方法在第2.5节中有详细的说明)。图6给出了1980-2013年暖季三个区域的阻塞频率变化序列, 重点关注增温减缓期间(2001-2013年), 欧亚大陆中部的阻塞频率呈下降趋势, 欧洲东南部呈上升趋势, 虽然北美北部也有轻微上升但不明显。这表明三个区域阻塞频率的趋势变化与图5中位势高度场的趋势变化呈正相关: 位势高度降低的区域阻塞频率呈下降趋势, 相反位势高度增加的区域阻塞频率呈升高趋势。
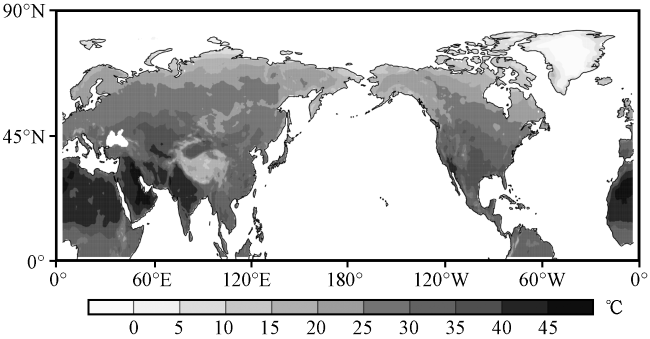
阻塞高压会导致大尺度的天气形势发生改变, 尤其是有助于形成极端天气。在夏季, 阻塞高压盛行下沉气流并且维持几天或几周甚至超过一个月, 使晴空辐射加热地表, 形成局地的热浪天气。如2003年发生在欧洲(Stott et al, 2004; Ogi et al, 2005)和2010年发生在俄罗斯(Dole et al, 2011)的持续高温天气都造成了数千人的死亡和巨大的经济损失。下面对三个区域1980 -2013年暖季发生的极端高温事件进行统计。首先计算了北半球陆地高温阈值的空间分布(图7), 由于不同区域的经纬度和海拔不同, 使得气温分布存在差异, 因此极端高温事件的阈值同样具有区域差异性。从图7中可以看出, 阈值的分布呈现出从低纬到高纬逐渐降低的趋势, 暖季极端最高气温的最大值主要出现在非洲北部和印度地区, 这些地方的阈值在40 ℃以上; 而格陵兰岛的暖季极端最高气温最低, 低至0 ℃以下, 阈值的这种分布反映了太阳辐射对于不同纬度区域极端高温气候的影响。其中青藏高原作为全球海拔最高、 面积最大的高原, 平均海拔4 km以上(张渊萌等, 2014), 且海拔每升高100 m气温下降0.6 ℃, 因此青藏高原地区的暖季极端高温阈值相对于周边为低值中心。
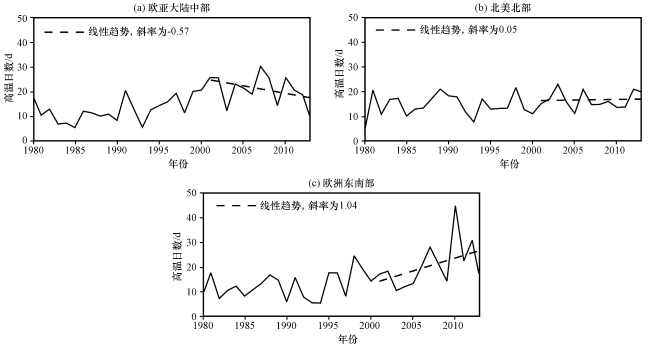
确定了格点的高温阈值之后, 逐个格点统计其每年暖季的高温日数, 再把区域内的格点进行空间平均, 建立区域暖季的高温日数时间序列, 分析其年际变化特征。图8为欧亚中部、 北美北部以及欧洲东南部三个区域的高温日数时间序列。从图8中可以看出, 在年代际尺度上, 三个区域的高温日数变化差异显著: 欧亚中部的高温日数在1980 -2000年呈上升趋势, 上升倾向率为3.6 d·(10a)-1, 而在全球增温减缓时期(2001 -2013年)呈下降趋势, 下降倾向率为-5.7 d·(10a)-1; 北美北部地区的高温日数维持稳定, 平均高温日数为15.3天; 欧洲东南部的高温日数从1980年开始一直呈上升趋势, 特别是2001 -2013年更加剧烈, 其中2010年暖季的高温日数高达45天。将图8与图6进行对比, 发现2001 -2013年各区域高温日数与阻塞频率的变化趋势有很好的一致性: 欧亚中部的阻塞频率下降, 其高温日数也下降; 北美北部的高温日数和阻塞频率均轻微上升; 欧洲东南部的高温日数与该区域阻塞出现的频率均增加最快。由于统计时间段太短, 高温日数和阻塞频率的变化趋势未通过显著性检验, 但两者之间的变化匹配的很好, 至于暖季阻塞与高温是否完全匹配仍需进一步验证。


4 结论与讨论
对全球增温减缓时期北半球陆地暖季气温的时空变化特征及其可能成因进行分析, 得到以下主要结论:
(1) 通过分析全球增温减缓期(2001 -2013年)北半球陆地的气温距平时间序列, 发现冷季气温有明显的下降趋势[-0.25 ℃·(10a)-1], 而暖季温度则持续增温[0.26 ℃·(10a)-1]。且暖季气温变化的空间分布呈现出显著的区域性差异, 存在三个气温变化中心: 欧亚大陆中部降温, 北美北部和欧洲东南部升温。北美北部和欧洲东南部的升温对北半球暖季平均气温的上升分别贡献了3.1%和9.5%, 欧亚大陆中部对于北半球降温的贡献为15.6%。
(2) 将全球增温减缓时期北半球暖季三个气温变化中心作为代表分析其气温变化原因, EEMD分解结果表明气温变化是由长期趋势和多年代际变率的协同作用导致的。三个区域的长期趋势均呈上升趋势, 其中欧洲东南部上升最快; 但由于全球增温减缓时期的多年代际变率处于不同的冷暖位相, 使得三个区域的气温有不同变化。其中欧洲东南部是三个区域中多年代际变率和长期变化均上升最快的地区, 促使其气温上升较为剧烈。
(3) 通过分析全球增温减缓时期暖季大气环流场、 阻高频率和高温日数的时间变化, 探究影响气温多年代际变率的动力机制。结果表明, 2001 -2013年500 hPa位势高度变化图在中高纬度呈现有规律的正负中心相间的分布形势, 且位势高度升高(降低)的区域对应着阻塞频率增多(降低)的地区。统计同期高温日数的时间序列表明阻塞增多(减少)的地区高温日数也增多(减少)。据此可以推测全球增温减缓时期的暖季气温变化的物理机制: 位势高度升高的区域阻塞高压增多, 其下方盛行下沉气流, 所以在暖季易形成高温热浪天气, 进而使得气温上升。
目前, 本文探究了全球增温减缓期间北半球陆地暖季气温的时空分布特征, 并且揭示了多年代际振荡在出现这类气候年代际信号过程中的重要作用。但多年代际振荡不仅会造成全球温度发生变化, 而且进一步引发其他气候效应, 比如说降水、 蒸发、 土壤湿度等一系列陆面过程变量发生改变。未来将收集和整理其他陆面变量的相关数据资料, 分析在年代际气候变化背景下陆面过程变量的变化特征, 以期为气候的年代际变化提供更全面详细的参考。