

1 引言
沙尘气溶胶被广泛认为在区域和全球尺度的气候变化中发挥着至关重要的作用, 这主要是由于它们显著但高度不确定的直接和间接影响(Wang et al, 2009; Huang et al, 2014)。一方面, 它们可以吸收和散射太阳短波和地面长波辐射, 进而通过改变地球辐射和能量收支平衡直接影响气候(Stier et al, 2007; 张芝娟等, 2019)。另一方面, 沙尘气溶胶强烈吸收辐射有助于对流层变暖和地面冷却, 这可能改变大气稳定性, 进一步影响云微物理过程和其他性质, 间接影响全球地表温度、 陆面过程、 气候、 水文循环以及生态系统(Charlson et al, 1992; Ramanathan et al, 2001; 史莹莹等, 2018)。且它们对空气质量和人类健康也有不利的影响(Davidson et al, 2005; Deng et al, 2011)。然而, 由于气候因素形成的沙漠(如撒哈拉沙漠、 塔克拉玛干沙漠等, 以矿物沙尘为主)与人类活动影响形成的沙漠(如咸海, 以盐尘为主)所产生的沙尘气溶胶主要成分不同, 它们的光学及微物理特性存在差异, 进而引起不同的区域辐射和气候影响。关于沙尘气溶胶的大量研究主要集中在全球分布广泛且常见的矿物沙尘, 然而针对仅部分地区存在的盐尘气溶胶目前还没有有效的识别算法。盐尘气溶胶由于其较为特殊的组成成分对环境的影响和危害远远超过了矿物沙尘, 能将其准确识别具有非常重要的科学意义。因此, 本文选取矿物沙尘和盐尘气溶胶的典型代表区, 进行深入的光学特性对比分析, 认识并理解盐尘光学特性与矿物沙尘的异同, 是建立盐尘气溶胶识别算法、 评估其辐射气候影响的前提。
塔克拉玛干沙漠是东亚最主要的沙尘源之一, 位于中国西北部塔里木盆地, 北面是天山山脉, 西面是帕米尔高原, 南面是昆仑山脉, 约85%的面积被移动沙丘所覆盖。春季的沙尘排放量约为70.54 Tg·y-1, 占东亚沙尘总排放量的42%(Chen et al, 2017)。塔克拉玛干沙漠的沙尘在一定天气形势条件下可以被抬升至10 km高度, 在沙尘活动最频繁的春季和夏季, 大量的沙尘能从塔里木盆地底部沿着昆仑山脉抬升到青藏高原上空(Ge et al, 2014)。在盛行西风气流的作用下, 该地区的沙尘可以向东输送至朝鲜、 韩国以及日本, 甚至能越过太平洋到达北美洲, 对区域及全球辐射能量平衡发挥着重要作用(Huang et al, 2008)。因此, 塔克拉玛干沙漠的沙尘气溶胶是典型的沙漠源地矿物沙尘的代表, 可以为沙尘气溶胶光学特性的对比分析提供重要参考。
伊朗高原位于“全球沙尘传输带”(从非洲西部经过中东、 中亚延伸到中国东部)中部(Gharibzadeh et al, 2017), 是典型的干旱半干旱地区, 沙尘活动频繁。该地区频繁的沙尘活动除了卡维尔沙漠、 卢特沙漠和雷吉斯坦沙漠等的局地贡献之外, 主要还受到大量阿拉伯半岛和撒哈拉沙漠远距离传输沙尘的影响。Shahsavani et al(2012)的研究指出, 阿拉伯半岛作为中东地区沙尘暴的主要来源, 在盛行西风和西南风的裹挟下, 将大量矿物沙尘输送到伊朗高原, 导致该地区的颗粒物PM10浓度急剧上升。Alizadeh-Choobari et al(2016)的研究也指出, 远距离传输的沙尘对伊朗高原的贡献要比局地沙尘源的贡献更加显著。因此, 伊朗高原可以作为传输型沙尘的典型代表区, 以便理解源区与传输区矿物沙尘气溶胶特性的差异, 也为盐尘气溶胶特性的对比分析提供更全面的参考。
中亚的咸海地区包含有世界上最典型的因人为活动影响而产生的盐尘沙漠。咸海地区自20世纪60年代以来经历了重大的土地利用和土地覆盖变化, 由于农业扩张和过度灌溉导致该地区急剧干涸, 裸露的湖底成为了丰富的盐尘源(Indoitu et al, 2015)。咸海地区每年约有100万吨的盐尘气溶胶进入到大气中(刘东伟等, 2011), 其成分中含有高密度的硫酸盐、 氯化钠等盐碱粉尘以及多种有害重金属元素, 导致土壤盐渍化, 危害地表植被, 加剧冰川消融, 对大气环境和人体健康造成严重威胁(张喆, 2017)。盐尘作为一种特殊形式的沙尘气溶胶, 对比分析其光学特性与矿物沙尘的差异, 是正确评估其辐射强迫及气候影响的重要前提。
卫星遥感探测由于其全球覆盖和高分辨率的特点, 被广泛应用于气溶胶分布与特性的研究, 如高分辨率辐射计(AVHRR)、 总臭氧测绘光谱仪(TOMS)、 中分辨率成像光谱仪(MODIS)、 臭氧监测仪(OMI)和多角度成像光谱仪(MISR)等资料可观测气溶胶的柱状特征(Prospero et al, 2002; Kumar et al, 2014; Hu et al, 2018; 陈爱军等, 2015), 搭载在云-气溶胶激光雷达和红外探测卫星(CALIPSO)上的双偏振云-气溶胶激光雷达(CALIOP)可连续地探测气溶胶垂直结构信息(Liu et al, 2008; Xu et al, 2016; 常倬林等, 2015)。OMI在吸收性气溶胶的研究中发挥着重要作用, 由于其在紫外光谱波段对气溶胶散射和吸收非常敏感, 因此可用于总气溶胶光学厚度(AOD)以及气溶胶吸收特性的反演, 包括气溶胶吸收光学厚度(AAOD)和单次散射反照率(SSA)等。然而, 尽管已有大量的工作利用卫星遥感研究了不同地区的沙尘气溶胶特性, 但是目前针对矿物沙尘与盐尘气溶胶光学特征的对比研究还相对较少。因此, 借助这些卫星的观测优势, 开展矿物沙尘与盐尘气溶胶光学特性的对比分析研究具有重要的意义。
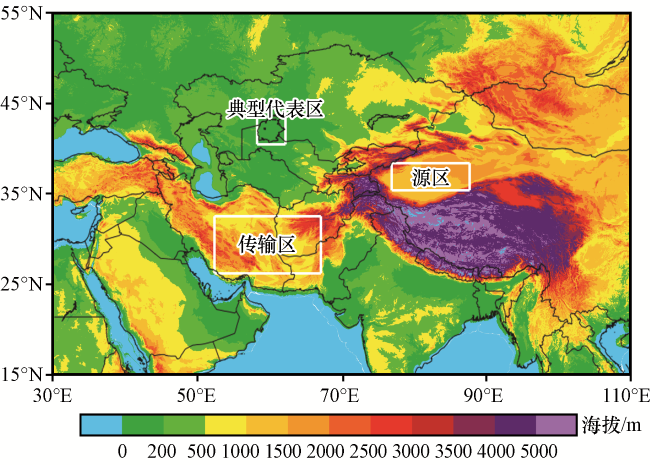
本文利用10年的主动(CALIOP/CALIPSO)和被动(OMI/Arua)星载传感器的遥感资料, 选取了矿物沙尘源区(38°N -41°N, 77°E -88°E)、 传输区(28°N -35°N, 52°E -67°E)以及盐尘(43°N -47°N, 58°E -62°E)的典型代表区域[图1, 此图及文中所涉及的地图均是基于国家测绘地理信息局标准地图服务网站下载的审图号为GS(2016)1665的世界地图制作, 底图无修改], 对比分析了这些区域气溶胶的主导类型、 垂直分布、 消光系数、 粒子退偏比、 颜色比、 吸收光学厚度和单次散射反照率等气溶胶物理和光学特性, 理解源区和传输区矿物沙尘与盐尘气溶胶光学特性的差异, 为正确评估矿物沙尘和盐尘气溶胶对区域和全球气候的辐射影响奠定基础。
2 数据介绍
2.1 CALIOP
CALIOP是搭载在CALIPSO卫星上一种双波段(532 nm和1064 nm)偏振后向散射激光雷达, 它的退偏探测技术具有独特的能力探测沙尘气溶胶及追踪其远程传输。它对沙尘气溶胶光学特性的反演取决于消光-后向散射比(或激光雷达比)。激光雷达比, 如粒子退偏比(即粒子散射的垂直与平行偏振分量的比率)是由粒子大小分布、 矿物组成和形状决定的固有光学性质。矿物沙尘由于其较强的不规则性和较大的粒径, 因而具有比大部分球形粒子(例如: 海洋、 烟尘气溶胶)偏大的粒子退偏比。本研究使用了10年(2007年1月至2016年12月)的CALIOP Vertical Feature Mask(VFM)、 5 km Aerosol Layer(ALayer)二级产品和Aerosol Profile(CL3AP)三级产品。由于太阳辐射使信噪比降低, CALIOP在白天的灵敏度比夜间低得多(Liu et al, 2009), 因此仅使用夜间数据。VFM产品对气溶胶类型的判别首先通过云-气溶胶识别(CAD)算法将大气特征分类为云和气溶胶, 分类的置信水平来自CAD分数, 云为正值(0~+100)气溶胶为负值(-100~0), 该分数绝对值越大表示置信度越高, 20≤∣CAD∣<50、 50≤∣CAD∣<70、 ∣CAD∣≥70分别表示低、 中、 高置信度。然后再通过场景分类算法进一步将气溶胶分类为其亚型: 沙尘、 污染沙尘、 抬升烟尘、 污染性大陆/烟尘、 清洁性大陆、 污染性海洋和清洁性海洋。ALayer产品中报告了每个气溶胶层的粒子退偏比和颜色比等光学特征参数。CL3AP产品中包含了来自二级产品的气溶胶分类信息, 每种气溶胶类型被预先指定一个激光雷达比(或消光-后向散射比), 用于随后气溶胶的消光反演。激光雷达比的假设是影响气溶胶消光反演不确定性的关键因素之一, 而气溶胶类型的错误分类是另一个不确定性来源(Yu et al, 2010)。尽管存在这些不确定性, 但有研究表明CL3AP数据中大于0.001 km-1量级的气溶胶消光系数在大多数情况下是具有代表性的(Winker et al, 2013)。
2.2 OMI
OMI是搭载Aura卫星上的天底观测光谱仪, 能够观测到可见光和紫外(UV)波段的大气太阳后向散射(Torres et al, 2007)。它的气溶胶产品包括两种反演算法: 多波段算法(OMAERO)和近紫外算法(OMAERUV)。OMAERUV算法是基于354 nm和388 nm两个近紫外波段的光谱信息进行气溶胶反演。近紫外观测的一个优势为分子散射与气溶胶吸收在该光谱范围内的相互作用能够用于评估气溶胶的吸收能力。大量研究结果表明, OMI的气溶胶光学厚度与单次散射反照率产品与地基气溶胶自动观测网(AERONET)的反演结果有较高的一致性(Changwoo et al, 2014; Jethva et al, 2014)。因此, 本研究利用了OMAERUV三级产品中的大气柱气溶胶光学厚度、 吸收光学厚度和单次散射反照率参数。
3 结果分析
3.1 大气柱气溶胶光学厚度
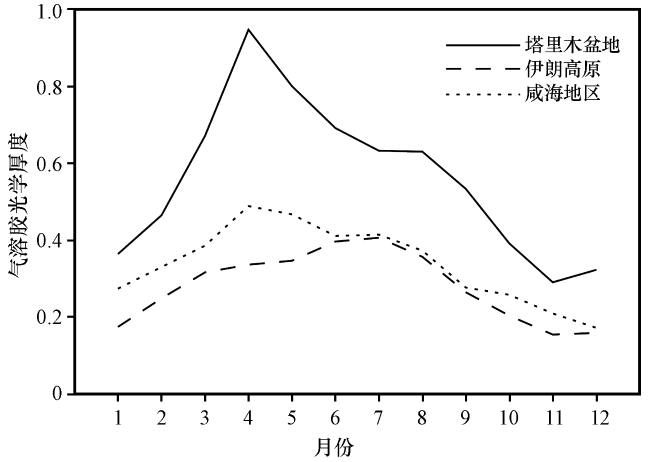
图2给出了塔里木盆地、 伊朗高原和咸海地区10年平均的大气柱AOD逐月变化。从图2中可以看出, 塔里木盆地作为矿物沙尘的源区, 其大气柱AOD毫无疑问是三个典型区域中全年最大的。由于塔克拉玛干沙漠春季频繁的沙尘活动(Huang et al, 2008; 茹建波等, 2018), 大气柱AOD在4月达到全年最大值(0.95), 几乎是咸海地区当月AOD的2倍、 伊朗高原的3倍多。塔里木盆地大气柱AOD具有显著的季节变化, 冬季全年最低, 随月份推进在4月出现全年最大值, 之后逐月递减。塔里木盆地沙尘气溶胶与咸海地区盐尘气溶胶的季节变化规律相似, 主要归因于它们地处相同的纬度, 矿物沙尘和盐尘的频发都是该地区春季(特别是4月)的气旋活动和强风天气影响所致(Xi et al, 2015)。与它们不同的是, 沙尘传输区的伊朗高原由于受更低纬度的非洲和阿拉伯半岛沙尘的影响, 其大气柱AOD随月份推进逐渐上升, 在7月达到最大值(0.4)。这主要是由于, 印度夏季风期间伊朗高原对流层低层强烈的大气加热导致阿拉伯半岛、 阿拉伯海的西南风和西北风增强, 增强的西北风又将更多的沙尘从阿拉伯半岛输送至阿拉伯海和伊朗高原, 形成正反馈效应(Jin et al, 2014)。
3.2 气溶胶类型及出现频率
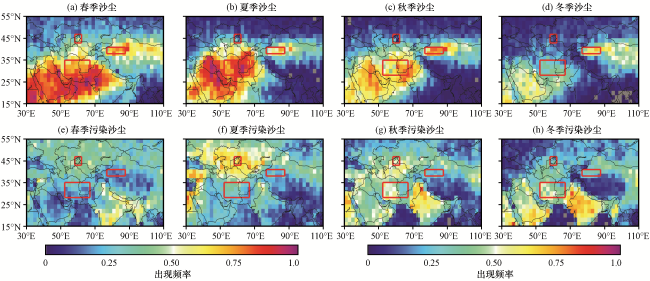
图3 沙尘和污染沙尘在塔里木盆地、 伊朗高原以及咸海地区不同季节的出现频率水平分布从小到大的三个红色方框依次代表研究区域: 咸海地区、 塔里木盆地、 伊朗高原 Fig.3 Seasonal occurrence frequency of dust and polluted dust in Tarim Basin, Iranian Plateau and Aral Sea.The three red boxes from small to large represent the study region: Aral Sea, Tarim Basin and Iranian Plateau |
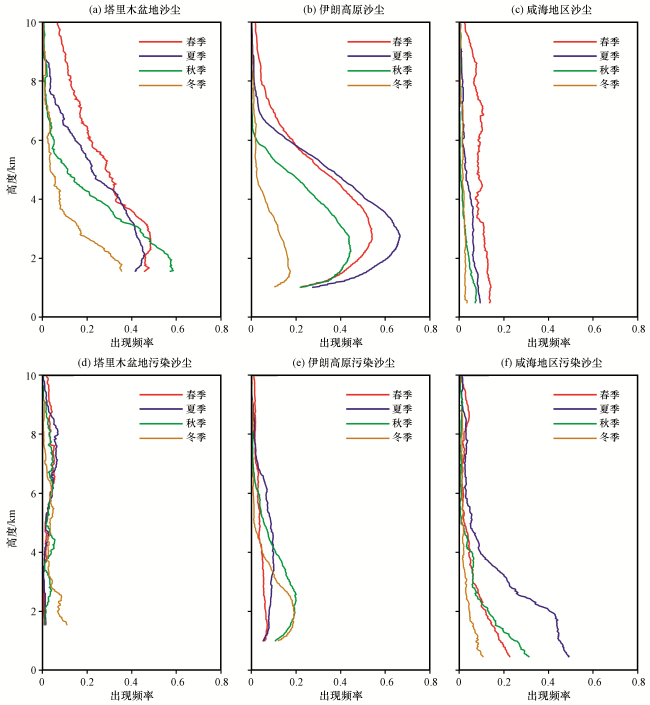
沙尘气溶胶出现频率的高值区从北非延伸至中国, 主要分布在撒哈拉沙漠、 阿拉伯半岛、 伊朗高原、 塔尔沙漠、 塔克拉玛干沙漠以及戈壁沙漠[图3(a)], 与“全球沙尘传输带”的分布一致(Prospero et al, 2002; Kaufman et al, 2005)。沙尘气溶胶的发生频率与季节变化有紧密的联系, 春季是沙尘活动最活跃的季节, 大面积的沙尘频率超过0.8, 塔里木盆地的沙尘频率在春季达到最大值, 并且最大高度可以到达10 km以上[图4(a)]。塔里木盆地由于是典型的沙尘源, 因此其沙尘出现频率的最大值通常出现在近地表, 并随高度增加而递减。而伊朗高原的沙尘出现频率随高度增加先增大后减小, 其最大值主要集中在2~3 km[图4(b)], 这主要是由于非洲和阿拉伯半岛向伊朗高原地区的沙尘输送强于局地沙尘释放导致(Léon et al, 2003; Bayat et al, 2011)。此外, 伊朗高原沙尘出现频率的最大值出现在夏季, 和全年中大气柱AOD的最大值有很好的一致性。
污染沙尘是CALIOP识别的陆地上空粒子退偏比介于0.075~0.2之间的气溶胶粒子, 主要指沙尘与生物质燃烧气溶胶的混合物(Omar et al, 2009)。其出现频率的最大值主要集中在夏、 秋季节的中亚地区[图3(f), (g)]和秋、 冬季节的印度恒河平原[图3(g), (h)], 伊朗高原和塔里木盆地具有非常小的出现频率。中亚地区夏季污染沙尘的出现频率高值, 明确了中亚是将污染颗粒物远程输送到东亚、 太平洋甚至美国西部的一个重要区域(Fischer et al, 2009; Miller-Schulze et al, 2011)。Miller-Schulze et al(2011)研究表明, 夏季的移动源, 即汽油和柴油发动机的废气排放, 生物质燃烧和生物二次有机气溶胶是中亚地区人为颗粒物的主要来源。咸海地区污染沙尘的出现频率垂直分布类似于塔里木盆地的沙尘气溶胶, 其最大值出现在夏季的近地表(高达0.5), 随高度增加逐渐减少[图4(f)], 这意味着局地释放是该地区污染沙尘的主要来源。相关研究表明, 咸海地区的盐尘气溶胶是中亚地区最为重要的人为污染源(Xi et al, 2016), 其次生物质燃烧和生物二次有机气溶胶也是颗粒物的主要贡献(Miller-Schulze et al, 2011)。因此, 咸海地区被CALIOP识别的污染沙尘主要是由频繁出现的盐尘气溶胶所贡献, 其次为沙尘与生物质燃烧气溶胶的混合物。
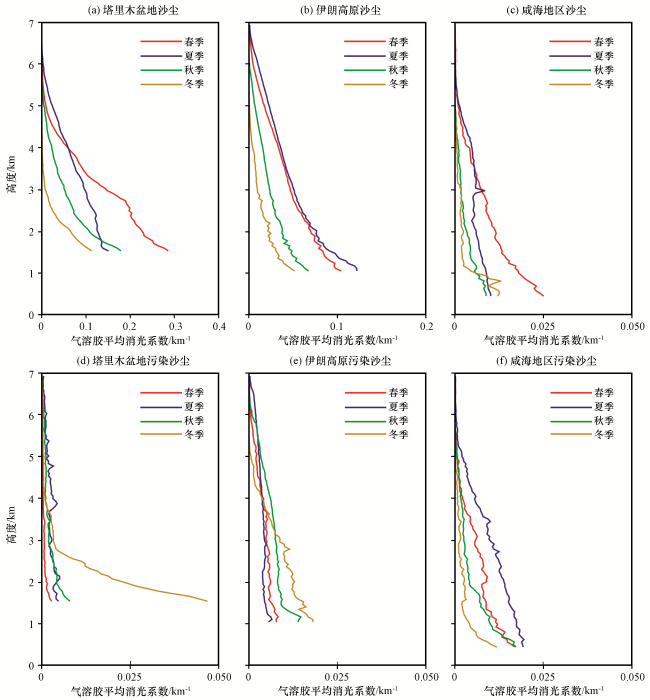
3.3 平均气溶胶消光系数垂直分布
总体来说, 三个地区的气溶胶平均消光系数最大值均集中在近地面, 随高度增加而递减。沙尘源区塔里木盆地的沙尘消光系数远大于其他两个地区, 春季最大, 近地面高达0.3 km-1, 冬季最小, 近地面约0.1 km-1[图5(a)]。伊朗高原沙尘气溶胶的消光系数递减率明显高于塔里木盆地, 意味着沙尘传输区的垂直输送强于沙尘源区, 这与Mehta et al(2018)的研究结论相一致。尽管污染沙尘在塔里木盆地的出现频次较小[见图4(d)], 但其消光系数冬季在该地区的近地表可达到约0.05 km-1, 这可能是由于中国西北地区在寒冷季节因取暖使用化石燃料燃烧增加而产生的人为污染物所致(Pan et al, 2019)。相反的是, 虽然咸海地区污染沙尘的出现频率是三个研究区域中最大的[见图4(f)], 但是其近地表的消光系数相对较小, 最大值出现在夏季, 和该地区春季的矿物沙尘气溶胶消光系数相当[图5(f)]。
3.4 粒子退偏比和颜色比
粒子退偏比(PDR)定义为气溶胶粒子垂直方向衰减后向散射系数与水平方向衰减后向散射系数的比值, 主要用于表征气溶胶粒子的不规则程度。一般来说, 退偏比越大意味着粒子越不规则, 球形粒子则接近零。Freudenthaler et al(2009)研究发现撒哈拉沙漠地区沙尘的PDR集中在0.27~0.35之间; 华雯丽等(2018)研究统计了中国敦煌地区沙尘气溶胶的PDR, 其阈值为0.34±0.03。郝巨飞等(2018)反演了邢台市一次沙尘天气过程, 得到沙尘聚集区域的PDR平均值为0.25。颜色比(PCR)定义为1064 nm波段气溶胶粒子衰减后向散射系数与532 nm波段的衰减后向散射系数的比值, 用于表征气溶胶粒子的相对大小, 通常随气溶胶粒径的增大而增大。
为了对比分析矿物沙尘与盐尘气溶胶粒子的不规则程度及相对尺度大小, 图6给出了塔里木盆地、 伊朗高原以及咸海地区气溶胶的PDR和PCR的出现频谱分布。从图6中可以明显看出, 三个区域气溶胶粒子PDR的出现频率具有明显的差异(见表1), 塔里木盆地源区沙尘的PDR平均值最大(约为0.306), 而伊朗高原的传输型沙尘与咸海地区的盐尘PDR平均值略低于源区沙尘, 分别约为0.264和0.265。与源区沙尘相比, 传输型沙尘较小的PDR可能与传输过程中较大尺度粒子的沉降以及与人为污染物的混合有关, 导致其整体不规则程度降低(华雯丽等, 2018), 而盐尘则可能与其化学组成的复杂性有关, 未来需要加强盐尘微物理及光学特性的外场观测试验。
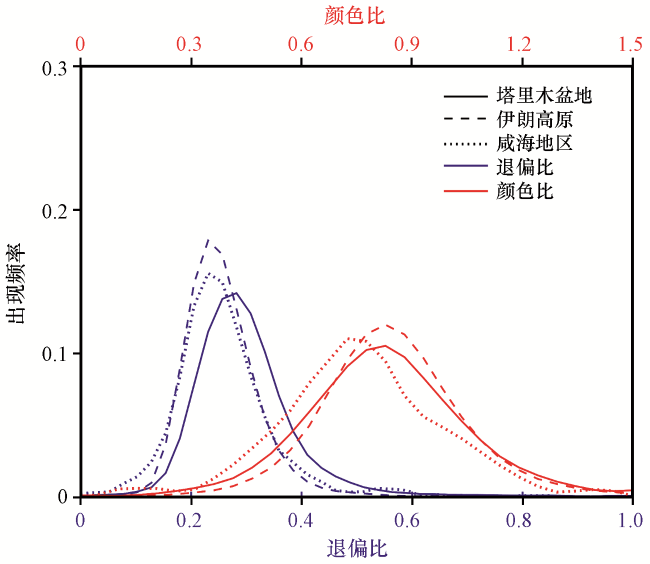
图6 塔里木盆地、 伊朗高原以及咸海地区气溶胶粒子退偏比和颜色比的频谱分布Fig.6 Spectral distributions of aerosol particulate depolarization ratio and color ratio in Tarim Basin, Iranian Plateau and Aral Sea |
表1 粒子退偏比、 颜色比、 气溶胶吸收光学厚度和单次散射反照率在研究区域的平均值Table 1 Mean value of particulate depolarization ratio, color ratio, aerosol absorption optical depth and single scattering albedo in study regions |
| 光学特性变量 | 研究区域 | ||
|---|---|---|---|
| 塔里木盆地 | 伊朗高原 | 咸海地区 | |
| 粒子退偏比(PDR) | 0.306 | 0.264 | 0.265 |
| 颜色比(PCR) | 0.823 | 0.841 | 0.762 |
| 气溶胶吸收光学厚度(AAOD) | 0.038 | 0.018 | 0.022 |
| 单次散射反照率(SSA) | 0.934 | 0.941 | 0.936 |
矿物沙尘气溶胶主导的塔里木盆地和伊朗高原地区, 气溶胶PCR的出现频率分布相似, 主要集中在0.4~1.2范围内, 其平均值分别约为0.823和0.841。咸海地区的盐尘气溶胶PCR显著低于塔里木盆地和伊朗高原, 主要集中在0.3~1.1范围内, 平均值约为0.762, 意味着盐尘粒子的平均尺度小于矿物沙尘。
3.5 气溶胶光学吸收特性
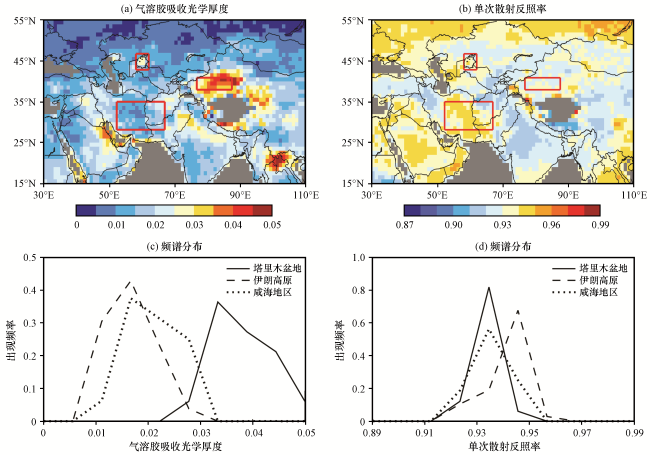
气溶胶吸收光学厚度是评估气溶胶大气加热的关键参量, 表示因吸收而导致的气溶胶对光的衰减, 定义为气溶胶光谱吸收系数的大气柱积分, 被广泛应用于吸收性气溶胶(如沙尘、 生物质燃烧物等)的研究。与之相关联的, 表征气溶胶散射能力大小的变量为单次散射反照率, 定义为散射系数与消光系数的比率(Gyawali et al, 2009), 理论值范围从0(完全吸收)到1(完全散射)变化, 在可见光和紫外光谱中介于0.5~1.0之间(Ialongo et al, 2010)。因此, 气溶胶吸收光学厚度和单次散射反照率之间存在如下的关系, 即AAOD=(1-SSA)×AOD, 其中, (1-SSA)表示气溶胶的吸收能力大小。
为了理解矿物沙尘和盐尘的气溶胶吸收特性, 本文专门分析了整个研究区域的AAOD和SSA的空间分布以及分别在塔里木盆地、 伊朗高原和咸海地区的出现频谱(图7)。从图7中可以看出, AAOD的最大值主要集中在沙尘源区塔里木盆地、 柴达木盆地、 阿拉伯半岛以及大规模生物质燃烧活动的东南亚地区, 这与Kang et al(2017)研究结果一致, 即AAOD高值主要分布在沙尘源以及黑碳、 有机碳源区。塔里木盆地的AAOD平均值(0.038)显著大于伊朗高原(0.018)和咸海地区(0.022), 根据上述AAOD与SSA和AOD之间的关系, 出现这般显著差异的可能原因有两个方面: (1)不同区域大气柱AOD存在显著差异, 塔里木盆地大气柱AOD是其他区域的2~3倍, 因此在相同吸收能力情况下, 其AAOD是三个区域中最大的; (2)不同区域气溶胶粒子的散射或吸收能力本身存在显著差异, 受沙尘影响的阿拉伯半岛、 伊朗高原、 中亚卡拉库姆沙漠均呈现较高的SSA, 即相对较弱的吸收能力, 然而在阿富汗及其周边地区、 印度恒河平原以及中国西北部均呈现较小的SSA, 即较强的吸收能力。三个典型研究区域SSA出现频谱的对比分析发现, 咸海地区与塔里木盆地SSA主要集中在0.92~0.95之间, 平均值分别为0.936和0.934, 均低于伊朗高原(0.941), 意味着咸海地区的盐尘与塔里木盆地的源区沙尘吸收能力相当, 略大于伊朗高原的传输型沙尘。


4 结论
选取矿物沙尘和盐尘的典型代表区, 即塔里木盆地(矿物沙尘源)、 伊朗高原(矿物沙尘传输区)以及咸海地区(盐尘源), 利用10年的主动(CALIOP/CALIPSO)和被动(OMI/Aura)卫星传感器的气溶胶产品, 综合对比分析了矿物沙尘与盐尘气溶胶的光学特性, 得到以下主要结论:
(1) 大气柱AOD的逐月变化在三个典型区具有相似的规律, 塔里木盆地和咸海地区最大值(分别为0.95和0.5)均出现在春季, 而伊朗高原最大值(0.4)出现在夏季; 气溶胶消光系数均呈现随高度增加而递减的垂直分布特征, 但是伊朗高原相比其他两个区域有更强的气溶胶垂直输送;
(2) 矿物沙尘源区塔里木盆地与盐尘源咸海地区的气溶胶出现频率最大值均集中在近地面, 并随高度增加而递减, 而因非洲和阿拉伯半岛沙尘输送强于局地释放的伊朗高原, 沙尘的最大出现频率主要集中在海平面以上2~3 km;
(3) 相比塔里木盆地的源区沙尘, 伊朗高原的传输型沙尘与咸海地区盐尘的不规则程度偏弱(PDR偏小), 此外, 盐尘粒子的粒径大小明显小于矿物沙尘(PCR偏小), 在CALIOP气溶胶分类算法中主要被识别为污染沙尘;
(4) 塔克拉玛干沙漠丰富的沙尘含量导致其气溶胶吸收光学厚度明显高于伊朗高原和咸海地区, 咸海地区盐尘气溶胶的光学吸收性与塔里木盆地的源区沙尘相当, 略大于伊朗高原的传输型沙尘。