

1 引言
2 模式介绍及模拟方案设计
2.1 模式及使用资料
2.2 模拟方案设计
表1 模拟过程中选用的参数化物理方案和气溶胶Table 1 Parametric physical schemes and aerosols adopted in the simulations |
| 模拟设计 | 分辨率值 | 物理方案 | 选择的方案 | 气溶胶 | 试验的气溶胶 |
|---|---|---|---|---|---|
| 水平网格分辨率 | 148×80 | 水汽方案 | 混合相显示水汽方案 | 硫酸盐气溶胶 | 模式自带背景场 |
| 水平距离分辨率 | 60×60 km2 | 积云方案 | Grell 积云方案 | 黑碳气溶胶 | GOCART输出场 |
| 垂直分辨率 | 23层 | 陆面方案 | BATS1E方案 | - | - |
| 物理方案时间步长 | 60 s | 辐射方案 | CCM3方案 | - | - |
-表示无数据 |
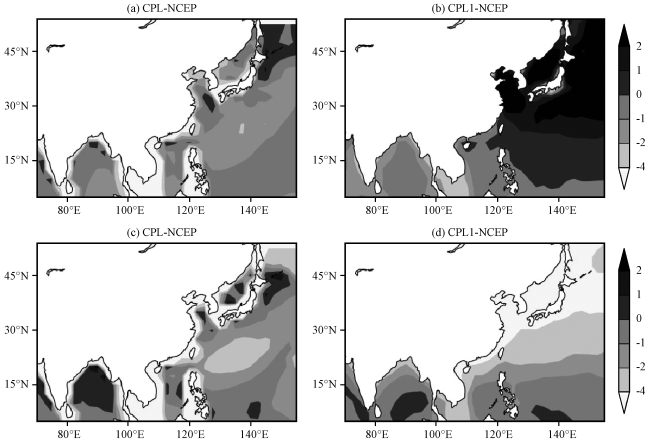
表2 模拟的物理量与NCEP资料间的偏差、 相关系数和均方根差Table 2 The deviation, correlation coefficient and root-mean-square deviation between simulated variables and NCEP data |
| 物理量 | 春季(CTL1, CPL) | 夏季(CTL1, CPL) | |||||
|---|---|---|---|---|---|---|---|
| 偏差 | 空间相关系数 | 均方根差 | 偏差 | 空间相关系数 | 均方根差 | ||
| 500 hPa 位势高度 /gpm | -1.8, -0.82 | 0.96, 0.97 | 5.12, 4.19 | -1.12, -0.52 | 0.90, 0.92 | 3.75, 3.18 | |
| 500 hPa 气温/K | -1.06, -0.19 | 0.95, 0.98 | 2.83, 1.97 | -1.16, 0.04 | 0.78, 0.91 | 2.92, 0.59 | |
| 850 hPa 水平风U分量/(m·s-1) | -1.13, 0.35 | 0.65, 0.71 | 4.67, 4.14 | -1.08, -0.26 | 0.43, 0.66 | 6.32, 4.45 | |
| 850 hPa 水平方V分量/(m·s-1) | -0.48, -0.22 | 0.49, 0.54 | 3.54, 3.41 | -0.56, -0.33 | 0.28, 0.44 | 4.04, 3.66 | |
| 850 hPa 比湿/(g·kg-1) | -0.35, -0.02 | 0.71, 0.79 | 2.87, 2.21 | -1.19, 0.37 | 0.21, 0.42 | 5.38, 3.52 | |
| 海平面气压/hPa | 3.10, 1.14 | 0.67, 0.81 | 5.53, 3.54 | 5.20, 1.62 | 0.31, 0.69 | 7.65, 3.62 | |
| 地表温度/K | -4.74, -2.52 | 0.78, 0.94 | 8.08, 4.29 | -7.14, -2.16 | 0.31, 0.87 | 12.46, 4.13 | |
相关系数均通过了基于t检验的0.05显著检验 |
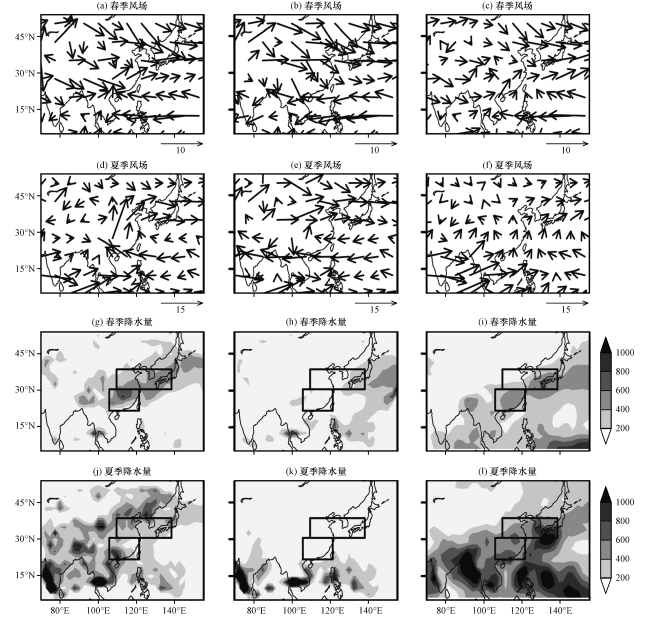
图1 CPL(左)和CTL1(中)模式模拟的850 hPa风场(单位: m·s-1)和降水量(单位: mm)与再分析资料(右)的比较图中小的矩形代表华南, 大的代表华北-黄海-日本南部 Fig.1 Comparisons of the CPL (left) and CTL1 (middle) simulated 850 hPa wind (unit: m·s-1) and precipitation (unit: mm) with the reanalysis data (right).The small rectangle denotes the area of South China, the big one denotes the area which covers North China, Yellow Sea and South Japan |
3 结果及讨论
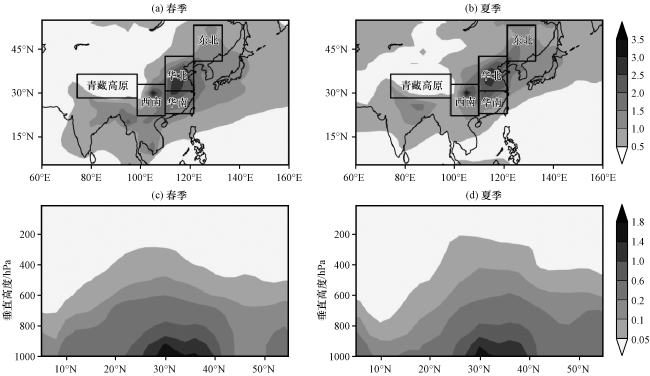
3.1 黑碳气溶胶分布
3.2 辐射强迫
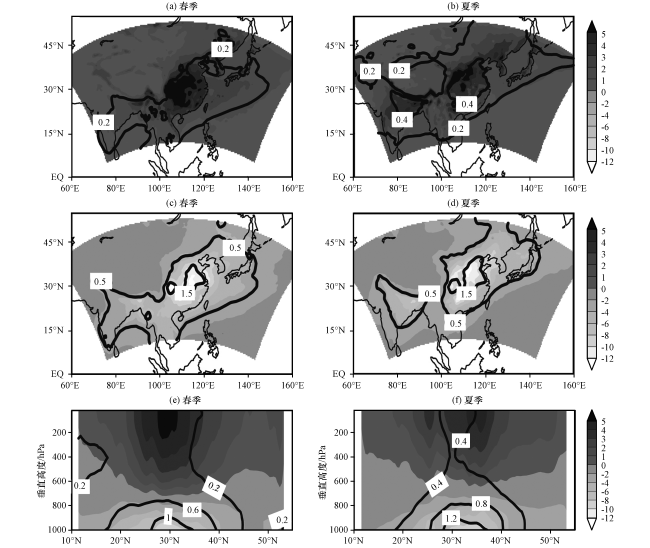
图 5 在大气顶(a, b)、 地面(c, d)和100°E -120°E范围内纬度-高度剖面(e, f)的晴空直接辐射强迫(单位: W·m-2)阴影表示短波辐射强迫, 等值线表示长波辐射强迫 Fig.5 The clear sky radiative forcing distribution at the top of atmosphere (a, b ), surface (c, d ) and latitude-height profile in the range of 100°E-120°E (e, f).Unit: W·m-2.The shaded denotes short wave radiative forcing, contour denotes long wave radiative forcing |
表3 在不同地区、 不同时期的大气顶和地面黑碳气溶胶直接辐射强迫的模拟结果Table 3 The simulated results of direct radiative forcing of black carbon aerosol at the top of atmosphere (TOA) and surface (SFC) in different regions and periods |
| 模拟区域 | 模拟时段 | TOA/(W·m-2) | SFC/(W·m-2) | 引用文献 |
|---|---|---|---|---|
| 全球 | 2001 -2009年 | 0.7(0.6~0.8) | -2.0(-2.3~-1.7) | Chung et al, 2012 |
| 华东(105°E -120°E, 32°N -50°N) | 1993 -2003年 | 1.1 | - | Wu et al, 2008 |
| 华东(100°E -130°E, 25°N -45°N) | 2006年 | 0.75 | -3.18 | Zhuang et al, 2011 |
| 华东(100°E -130°E, 20°N -50°N) | 2006年 | 0.81 | - | Zhuang et al, 2013 |
| 中国(70°E -140°E, 15°N -55°N) | 2010 -2014年 | 2.2 | - | Yang et al, 2017 |
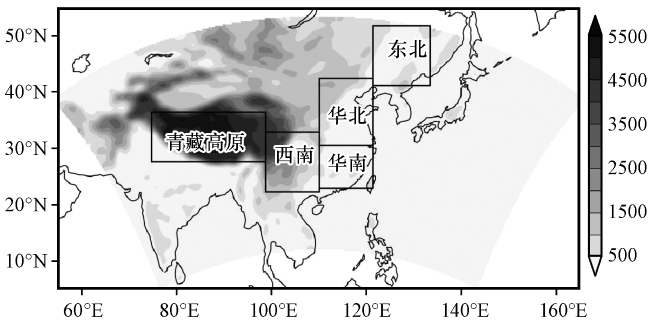
| 西南(98°E -109°E, 22°N -32°N) | 2002年 | 3.54 | -5.57 | 本文 |
| 华南(109°E -122°E, 24°N -31°N) | 2002年 | 3.99 | -6.6 | 本文 |
| 华北(109°E -121°E, 31°N -42°N) | 2002年 | 3.92 | -7.62 | 本文 |
| 东北(121°E -131°E, 40°N -51°N) | 2002年 | 1.51 | -3.80 | 本文 |
-表示无数据 |
3.3 气温及地表温度变化
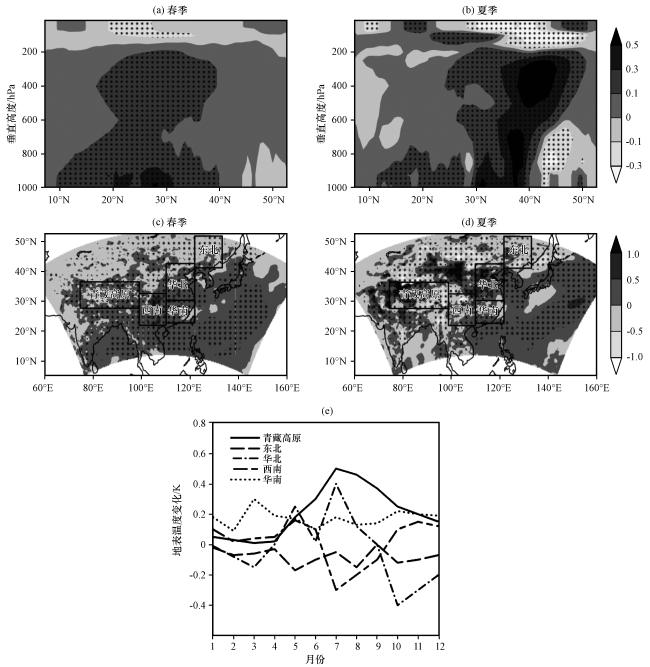
图6 100°E -120°E范围内平均扰动气温的纬度-高度剖面(a, b)与地表温度分布(c, d)及其随月份的变化(e)(单位: K)图6(a)~(d)中打点区域表示温度变化通过90%的置信水平检验 Fig.6 The latitude-height profile of mean perturbed air temperature from 100°E to 120°E (a, b), and the change of surface temperature (c, d) with its monthly change (e).Unit: K.Dots areas in Fig.6 (a)~(d) denote the change of temperature that passed the statistically significant confidence level of 90% |
3.4 中、 低层位势高度场及大气环流变化
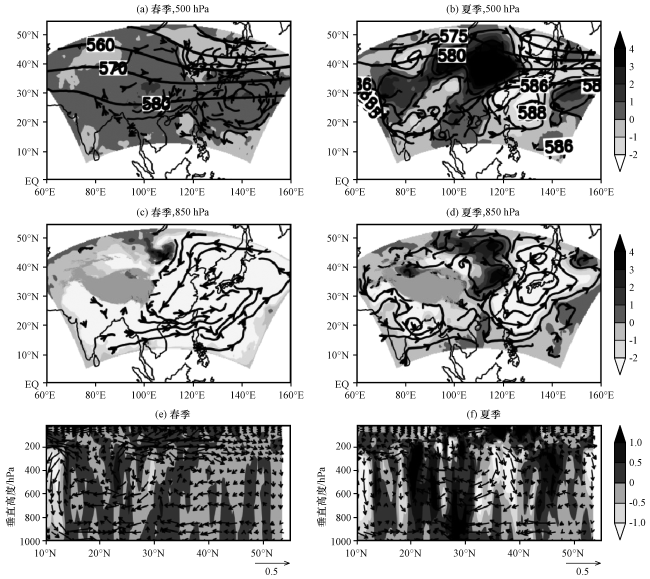
图 7 500 hPa和850 hPa位势高度变化(阴影, 单位: gpm)和扰动环流(流线)(a~d)以及100°E-120°E 范围内的平均垂直速度变化(阴影, 单位: mm·s-1)和扰动环流(矢量, 垂直速度扩大100倍, 单位: m·s-1)(e, f)图(a), (b)中等值线代表CTL2试验中的位势高度 Fig.7 Change of geopotential height (the shaded, unit: gpm) and perturbed circulation (streamlines) (a~d) and the mean change of vertical velocity (the shaded, unit: mm·s-1) and the disturbed circulation (vector, vertical velocity enlarged by 100 times, unit: m·s-1) in the range from 100°E to 120°E (e, f).The contour in Fig.7 (a)~(b) denotes the geopotential height in CTL2 experiment |
3.5 云量、 水汽输送及水汽柱含量变化
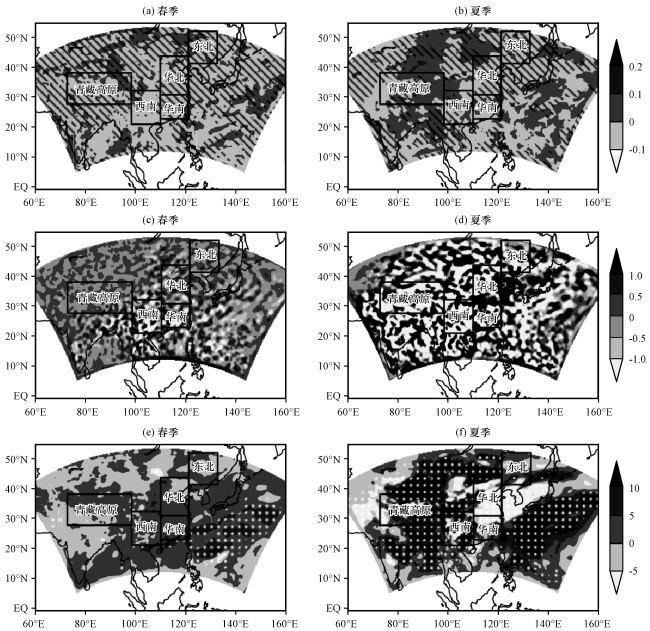
图8 云量(a, b)、 水汽通量散度(c, d, 单位:×10-5 g·s-1·m-2)和水汽柱含量(e, f, 单位: mm·m-2)的变化(a, b)中斜杠填充区代表大气热力稳定度增加的区域; (e, f)中打点区表示通过了90%的置信水平检验 Fig.8 The change of cloud (a, b), divergence of moisture flux (c, d, unit:×10-5 g·s-1·m-2) and the water vapor column content (e, f, unit: mm·m-2).In Fig.8 (a), (b) the slash filling area represents the area with increased atmospheric thermal stability; the Doted areas in Fig.8 (e)~(f) denote that the change of water vapor has passed the statistically significant confidence level of 90% |
3.6 降水变化及原因分析
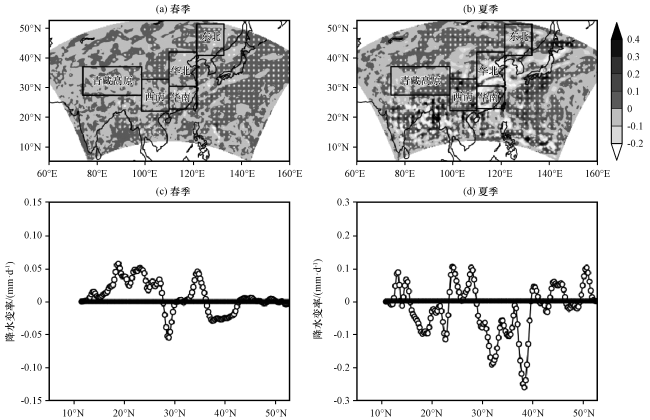
图9 降水率变化空间分布(a, b, 单位: mm·d-1)和100°E -120°E范围内平均异常降水的纬向变化(c, d)(a), (b)中打点区表示通过90%的置信水平检验 Fig.9 Spatial distribution of precipitation rate (a, b, unit: mm·d-1) and the latitudinal variation of mean abnormal precipitation in the range from 100°E to 120°E (c, d).The doted areas in Fig.9 (a), (b) denote that the change of precipitation has passed the statistically significant confidence level of 90% |
4 黑碳气溶胶对东亚夏季风的影响
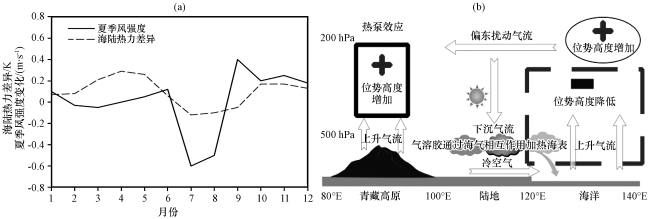
图10 夏季风强度和海陆热力差异变化(a)及黑碳气溶胶减弱夏季风可能的物理机制(b)Fig.10 The variation of summer monsoon intensity and land sea thermal difference (a) and the possible physical mechanism of black carbon aerosol weakening the summer monsoon (b) |
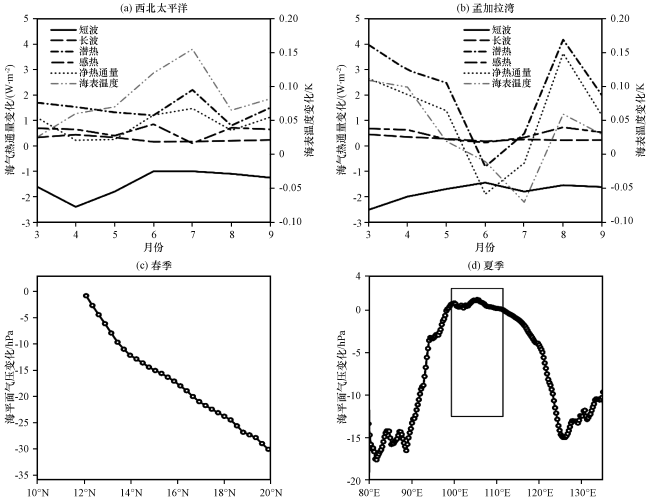
图11 海气热通量(单位: W·m-2)和海表温度(单位: K)随月份的变化(a, b)与100°E -120°E范围内(c)和10°N -20°N范围内(d)平均海平面气压(单位: hPa)的纬向变化和经向变化(a), (b)中海气热通量正值方向代表离开大气或者进入地面或海洋; (d)中矩形代表中南半岛 Fig.11 The variation of sea air heat flux (unit: W·m-2) and sea surface temperature (unit: K) with months (a, b), and the latitudinal and meridional variation of mean sea level pressure (unit: hPa) in the range from 100°E to 120°E (c) and from 10°N to 20°N (d).The positive heat flux in Fig.11(a), (b) indicates that the heat goes out of atmosphere or enter land and sea surface, the rectangle in Fig.11 (d) denotes the area of Indo-China Peninsula |
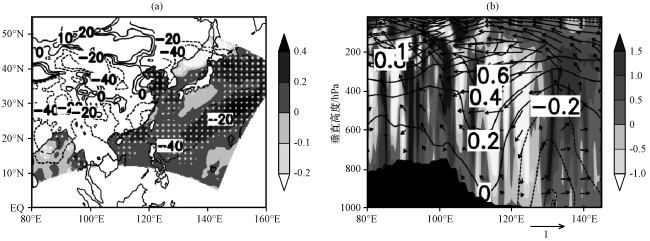


图12 海表温度(阴影, 单位: K)和海平面气压(等值线, 单位: hPa)变化(a)以及20°N -40°N范围内平均位势高度(等值线, 单位: ×10 gpm)、 垂直速度(阴影, 单位: mm·s-1)和扰动环流(矢量, 单位: mm·s-1)的经度-高度剖面 (b)(a)中打点区代表海表温度变化通过90%的置信水平检验; (b)中左下角黑色区域表示青藏高原主体地形 Fig.12 The change of sea surface temperature (the shaded, unit: K) and the sea level pressure (contour, unit: hPa) (a), and the longitude-height profile of geopotential height (contour, unit: ×10 gpm), vertical velocity (the shaded, unit: mm·s-1) and perturbed circulation in the range (vector, unit: mm·s-1) from 20°N to 40°N (b).Dots in Fig.12 (a) denote the change of SST that passed the statistically significant confidence level of 90%.The black area in the lower left corner in Fig.12(b) represents the main terrain of the Qinghai-Tibetan Plateau |