
1 引言
青藏高原是世界上平均海拔最高的高原, 被称为“世界屋脊”, 它对大气的作用比平原地区更为明显, 其热力、 动力效应都是通过边界层逐渐影响到自由大气。九龙地区地处青藏高原主体和成都平原之间的过渡带, 周边地形地貌复杂, 海拔高差大, 独特的地理位置使它成为西南低涡的主要源地和高原低值系统东移的途经地, 夏季是西南低涡和高原低值系统移出率最高的季节(慕丹等, 2017), 这些低值系统东移后往往在下游地区造成暴雨天气(李国平等, 2018)。九龙地区乃是天气、 气候研究的一个关键区, 其边界层热力和动力变化颇具特色, 因此, 对这个地区边界层大气的研究也很有意义。研究表明, 大气边界层内大气运动的主要特点是湍流性(Gao et al, 2000; 刘辉志等, 2000, 2013; Bian et al, 2003, 2012; 李英等, 2009), 除了湍流研究外, 各物理量廓线也是表征边界层大气结构特征主要方式。已有的研究阐明了青藏高原、 其周边地区和平原地区的大气边界层特征和影响因子各有异同(李家伦等, 2000; 李茂善等, 2004; Zuo et al, 2005; Ma et al, 2010; 韦志刚等, 2010; Bianco et al, 2011; Li et al, 2011; Dai et al, 2011; Guo et al, 2016; 苏彦入等, 2018; 马英赛等, 2019)。徐桂荣等(2014)利用探空加密试验资料, 估算青藏高原及下游地区边界层的高度, 认为高原中部对流边界层出现概率高于高原东侧及下游地区, 而四川盆地稳定边界层出现概率远高于高原和长江中游。高原东侧及下游地区平均边界层高度在白天高夜间低, 而高原中部平均边界层高度在日出左右较低, 之后随时间逐渐增高, 并在晚上达到最大值; 高原平均边界层高度的日变化振幅大于下游地区, 其日变化振幅随站点海拔的增加而增大。崔洋等(2015)利用2013年7月银川站高空气象探测资料, 发现河套干旱区夏季地表非绝热加热对边界层的影响主要集中在800 m以下, 800~2000 m高度边界层则主要受昼夜交替和大尺度天气系统的影响。卢萍等(2017)利用西南涡加密观测试验资料, 对比分析了四川境内不同海拔台站的边界层特征后发现, 高海拔地区地表大气受陆面的影响更为剧烈, 日变化幅度更大, 且极值出现时间更早。王倩茹等(2018)基于1981 -2010年CERA-20C再分析资料对青藏高原边界层高度的日变化特征进行研究后发现边界层高度大值区在海拔大于5000 m地区以及沙漠干旱地区, 东坡边界层高度明显低于高原西坡。杜一博等(2018)以2006年夏季敦煌野外观测的探空资料为基础, 对比研究了西北荒漠区晴天、 阴天大气边界层的构造, 同样发现该地区晴天和阴天的对流边界层以及稳定边界层均比中国中东部地区发展旺盛。马元仓等(2019)研究认为高原上地气温差越大、 风速越大、 湿度越小, 边界层高度越高, 并分析了边界层高度与灾害天气的关系。
理论突破往往需要以观测事实为基础和依据, 而资料仍然是制约青藏高原及周边地区大气边界层深入系统研究的客观原因。目前常用的多种再分析资料在高原地区都存在一定质量问题(Bao et al, 2013); 而已有研究工作中使用的试验资料观测时段偏短, 且侧重个例研究。自2010年开始, 中国气象局成都高原气象研究所(简称高原所)每年都在青藏高原东坡及下游的四川盆地关键区开展为期41天的西南涡加密观测科学试验, 获得了大量探空、 地面等长期综合观测资料(李跃清等, 2016; 卢萍等, 2012), 其中, 作为西南涡最主要源地(卢敬华, 1986; 李跃清等, 2016)的九龙站就是这个观测试验的重要站点。本文基于2010 -2018年夏天九龙站长期、 连续、 加密的观测试验资料, 对比分析其大气边界层的各气象要素场特征, 以期能够揭示该独特站点大气边界层垂直结构特征和时间演变特征, 为其他相关科学研究提供必要的事实依据。
2 测站、 资料和天气状况简介
2.1 观测站点和资料
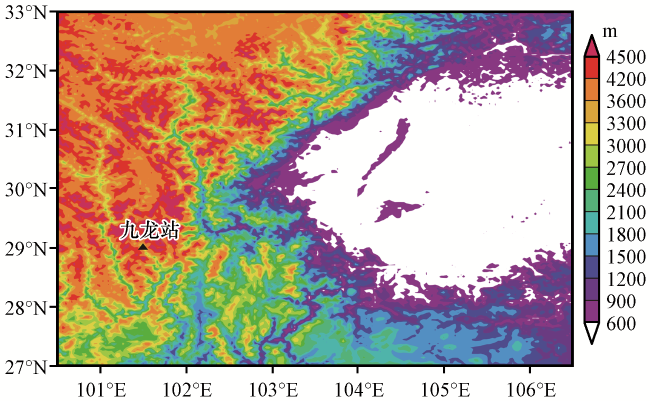
高原所西南涡加密观测科学试验是从2010年开始开展的一项大气科学试验, 时段为每年6月21日至7月31日, 试验期间在西南涡活动关键区进行加密探空观测, 按照业务观测规范每天进行4次(间隔6 h)探空观测(李跃清等, 2016)。观测试验使用芬兰维萨拉公司GPS(RS41)探空设备, 每秒传输一次数据, 垂直间隔小于10 m。站点分布在高原东坡及四川盆地, 因为九龙县具有特殊的地理位置(位于川西甘孜藏族自治州东南部, 地处青藏高原东缘, 境内地势起伏, 北高南低, 高山原和高山峡谷是境内主要两大地貌特征, 属中温带气候区, 站点位置(101.5°E, 29°N, 海拔2925 m, 图1)与天气意义(西南低涡主要源地), 且资料最为连续和稳定, 因此, 本文采用上述野外观测试验得到的一手资料, 重点针对九龙站2010 -2018年连续9年夏季边界层特征进行分析研究。
2.2 观测期间天气状况
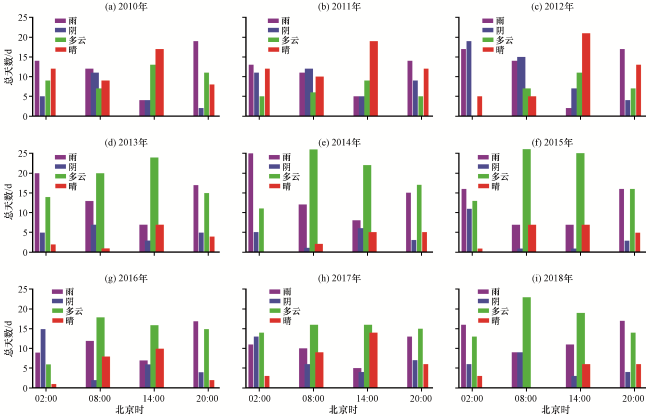
九龙站夏季天气阴晴不定, 一日内常常出现阴、 晴、 雨等多种天气状况。图2是所有观测时次(164次/每年, 存在少量缺失)的天气记录。从图2中可以看到, 整体而言, 每年雨天记录出现50次左右, 其中, 02:00(北京时, 下同)和20:00是出现降水记录频率最高的时次, 反映该地区夜雨概率较高。雨天记录最多的年份为2014年, 整个观测时段合计60次, 最少的年份是2017年, 仅有39次。阴天最少, 高频时次出现在02:00和08:00, 一般每年有20次左右的阴天, 唯有2012年达到了45次, 而2014年只有15次。多云天气出现次数差异较大, 08:00和14:00是其出现的高频时次, 2015年最多, 达到80次, 而2011年和2012年都仅有25次。晴天出现的次数也不多, 2014年仅有12次, 2011年为53次。再对比逐个时次的天气分布状况可知, 02:00出现雨天的情形最多, 晴天则主要出现在14:00, 其次是20:00和08:00。
3 九龙站边界层廓线特征
首先, 对比分析九龙站2010 -2018年9年夏季边界层大气基本要素场的垂直廓线, 讨论其日变化(日变幅仅针对观测的41天)和年际(仅针对观测的9年)变化特征。
3.1 温度的日/年际变化特征
大气温度廓线(图3)显示了九龙站边界层大气温度受太阳辐射影响具有相似的日变化特征: 08:00温度最低, 其次是02:00, 14:00最大; 四个时次中, 08:00和02:00的温度廓线较接近, 20:00和14:00的廓线特征较一致; 越靠近地面, 温度日变化越显著, 以上观测结果符合边界层大气温度普遍日变化特征。
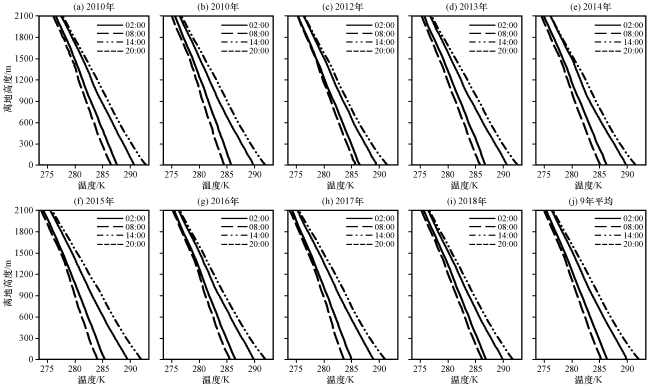
9年平均的地面大气温度02:00为286.5 K, 08:00为285.4 K, 14:00是292.3 K, 20:00为289.9 K, 平均的温度日变幅为6.9 K, 离地2 km高度处的最低温度和最高温度同样出现在08:00和14:00, 分别为275.6 K和277.3 K, 温度日变幅明显减小, 仅有1.7 K。近地层大气受下垫面的影响大, 温度的日变化幅度大, 2 km高空大气温度的日变幅小。
9年平均的温度垂直变化情况为: 08:00近地层到高空2 km高度, 温度从285.4 K减小至275.6 K, 温度垂直梯度约为-5 K·km-1; 14:00温度从292.3 K减小至277.5 K, 温度垂直梯度约为-8.5 K·km-1, 14:00的温度垂直梯度明显大于08:00, 温度高的时次对应的垂直梯度大。
对比九龙站近地层和2 km高度处逐年温度廓线的年际变化发现, 各年近地层最低大气温度都出现在08:00, 最低温度位于283.9~286.5 K, 年际差为2.6 K。最高温度全部出现在14:00, 最高温度范围在291.3~293.2 K, 年际差为1.9 K, 9年间近地层温度的日变幅在5.5~8.1 K。2010年和2013年近地层温度较高, 2012年和2017年近地层温度偏低。2012年日变幅最小, 2015年日变幅最大。离地2 km高度处, 08:00平均最低温度位于274.6~276.7 K, 年际差为2.1 K, 14:00平均最高温度位于276.4~278.6 K, 年际差为2.2 K, 日变幅在1.4~1.9 K。2015年和2017年离地2 km高度处温度偏低, 2010年和2013年离地2 km高度处温度偏高, 高空温度与地面温度的年际变化比较一致。各年的具体情况详见表1。
表1 九龙站逐年4个时次离地15 m/2 km高度处的平均温度和日变幅Table 1 The mean temperature and its daily amplitude at 15 m and 2 km above the ground at Jiulong station for 4 times |
| 年份 | 地面15 m高度温度/K | 2 km高度温度/K | ||||||||
|---|---|---|---|---|---|---|---|---|---|---|
| 02:00 | 08:00 | 14:00 | 20:00 | 日变幅 | 02:00 | 08:00 | 14:00 | 20:00 | 日变幅 | |
| 2010 | 287.5 | 286.5 | 293.2 | 290.7 | 6.7 | 277.2 | 276.7 | 278.6 | 278.3 | 1.9 |
| 2011 | 285.9 | 284.7 | 292.4 | 289.9 | 7.7 | 275.9 | 275.4 | 277.2 | 276.8 | 1.8 |
| 2012 | 286.6 | 285.8 | 291.3 | 288.8 | 5.5 | 276.1 | 276.0 | 277.4 | 277.2 | 1.4 |
| 2013 | 287.0 | 286.1 | 293.2 | 290.8 | 7.1 | 276.4 | 276.0 | 277.9 | 277.6 | 1.9 |
| 2014 | 286.5 | 285.3 | 291.9 | 290.1 | 6.6 | 275.7 | 275.2 | 277.0 | 276.9 | 1.8 |
| 2015 | 285.5 | 284.2 | 292.3 | 289.6 | 8.1 | 275.0 | 274.6 | 276.7 | 276.3 | 2.1 |
| 2016 | 286.7 | 285.7 | 292.2 | 290.0 | 6.5 | 276.1 | 275.9 | 277.3 | 277.0 | 1.4 |
| 2017 | 285.2 | 283.9 | 291.5 | 289.3 | 7.6 | 275.0 | 274.6 | 276.4 | 276.0 | 1.8 |
| 2018 | 287.2 | 286.5 | 292.1 | 290.2 | 5.6 | 276.4 | 276.0 | 277.5 | 277.3 | 1.5 |
| 平均 | 286.5 | 285.4 | 292.3 | 289.9 | 6.9 | 276.0 | 275.6 | 277.3 | 277.1 | 1.7 |
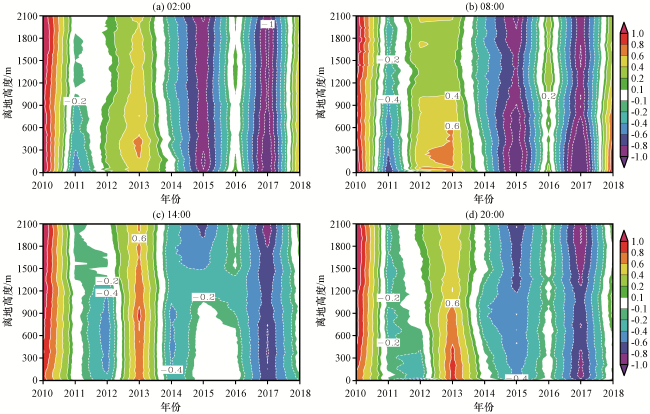
图4是逐年平均与9年总平均值相减得到的各个时次的温度距平垂直分布。从图4中可以看出, 02:00, 2010, 2012, 2013, 2016和2018年的温度较平均值偏高, 2010年偏高最显著, 其次是2013年; 2017年则是偏低最显著年。低层大气的温度偏差幅度较高层更大, 但最大偏差并非在最接近地表的大气层, 而是位于地面以上100~400 m高度范围。08:00的温度偏差分布与02:00相似, 但偏差幅度比02:00更大。14:00, 2010, 2013, 2015和2016年的温度较平均值偏高, 2010年偏高最显著, 其次是2013年; 2012, 2014和2017年则偏低, 2017年偏低最为显著, 最大正负偏差都出现在边界层的中部。20:00, 2010, 2013, 2016和2018年的温度较平均值偏高, 2010年偏高最显著, 其次是2013年; 2012, 2015和2017年则偏低, 2017年偏低最为显著。对比4个时次历年整个边界层的大气温度偏差, 08:00靠近地面的大气温度偏差幅度最大。
总之, 九龙站边界层大气的日变化特征显示, 08:00温度最低, 其次是02:00, 14:00最大。近地层大气受下垫面的影响显著, 温度日变幅大, 2 km高空大气温度的日变幅小。温度垂直梯度08:00小于14:00。9年间年际变化显示, 08:00地面大气平均温度年际差约2.6 K, 14:00地面大气平均温度年际差为1.9 K, 低于08:00, 温度的日变幅在5.5~8.1 K。离地2 km高度处平均温度年际差与地面大气相当, 但其日变幅在1.4~1.9 K之间, 较之地面大气明显减小, 且波动幅度也相应减小。平均温度年际差结果说明低层大气的温度偏差幅度比高层大, 但最大偏差并非出现在最接近地表的大气层。
3.2 比湿的年际/日变化特征
九龙站的比湿廓线(图5)日变化特征为: 14:00最小, 08:00次之, 20:00和02:00皆较大(2012年和2017年是20:00比湿最大, 其他7年都是02:00比湿最大), 即白天小夜间大, 与气温的日变化位相相反。比较边界层低层大气比湿日变化的变幅可以看到, 2010, 2012和2013年较大, 日变幅约2.1 g·kg-1, 其他年份的日变化幅度较小, 2018年最小, 仅为1.13 g·kg-1, 9年平均的02:00比湿为12.24 g·kg-1, 08:00比湿为11.61 g·kg-1, 14:00为10.70 g·kg-1, 20:00为12.24 g·kg-1, 平均日变化幅度为1.54 g·kg-1; 边界层大气比湿随着高度的增加迅速降低, 在离地2 km高度处, 9年平均的比湿在02:00仅为7.83 g·kg-1, 08:00为7.43 g·kg-1, 14:00为7.42 g·kg-1, 20:00为8.08 g·kg-1, 平均日变幅仅为0.66 g·kg-1。
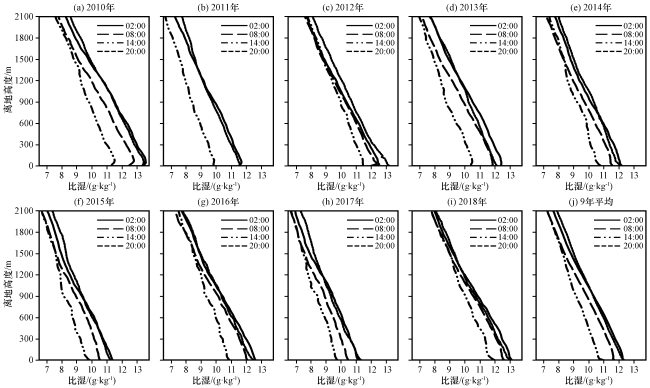
9年平均的比湿垂直梯度在02:00为-2.21 g·kg-1·km-1, 08:00为-2.09 g·kg-1·km-1, 14:00为 -1.64 g·kg-1·km-1, 20:00为-2.08 g·kg-1·km-1, 不同时次的梯度变化幅度大小与比湿大小相一致, 即比湿值大的时次, 垂直梯度也大。
年际变率则显示: 离地15 m高度处的比湿值, 2010, 2012和2018年较大, 极大值都超过13 g·kg-1, 2013, 2014和2016年次之, 2011, 2015和2017年最小。9年平均的02:00比湿值为12.24 g·kg-1, 年际差为2.22 g·kg-1, 08:00比湿值为11.61 g·kg-1, 年际差为2.13 g·kg-1, 14:00比湿值为10.70 g·kg-1, 年际差为2.24 g·kg-1, 20:00比湿值是12.24 g·kg-1, 年际差为2.10 g·kg-1, 4个时次的年际差幅度相当, 比湿值较小时次(14:00)对应的年际差反而略大。边界层大气比湿与温度一样, 都是随着高度的增加而降低, 在离地2 km高度处, 20:00比湿值最大, 其次是02:00, 08:00和14:00的比湿则较小。其中2010, 2012和2018年的比湿值较大, 平均极大值超过8.3 g·kg-1, 2017年和2015年比湿值最小, 都为7.57 g·kg-1。9年平均的02:00比湿值为7.83 g·kg-1, 年际差为1.4 g·kg-1, 08:00比湿值为7.43 g·kg-1, 年际差为1.15 g·kg-1, 14:00比湿值为7.42 g·kg-1, 年际差为1.25 g·kg-1, 20:00比湿值是8.08 g·kg-1, 年际差为1.22 g·kg-1, 4个时次的年际差值相当。对比结果显示低层大气比湿的年际差幅度显著高于离地2 km高度处(表2)。
表2 九龙站逐年4个时次离地15 m/2 km高度处的平均比湿和日变幅Table 2 The averaged specific humidity and its daily amplitude at 15 m and 2 km above the ground at Jiulong station for 4 times |
| 年份 | 15 m高度比湿/(g·kg-1) | 2 km高度处比湿/(g·kg-1) | ||||||||
|---|---|---|---|---|---|---|---|---|---|---|
| 02:00 | 08:00 | 14:00 | 20:00 | 日变幅 | 02:00 | 08:00 | 14:00 | 20:00 | 日变幅 | |
| 2010 | 13.40 | 12.46 | 11.30 | 13.37 | 2.10 | 8.51 | 8.01 | 7.85 | 8.79 | 0.94 |
| 2011 | 11.51 | 10.85 | 9.83 | 11.55 | 1.72 | 7.51 | 6.98 | 6.77 | 7.90 | 1.13 |
| 2012 | 12.38 | 12.00 | 10.94 | 13.12 | 2.18 | 7.91 | 7.85 | 8.02 | 8.35 | 0.50 |
| 2013 | 12.40 | 11.77 | 10.27 | 12.05 | 2.13 | 7.98 | 7.35 | 7.20 | 7.97 | 0.78 |
| 2014 | 12.20 | 11.58 | 10.79 | 12.09 | 1.41 | 7.97 | 7.45 | 7.56 | 8.18 | 0.73 |
| 2015 | 11.40 | 10.55 | 9.87 | 11.27 | 1.53 | 7.26 | 6.90 | 6.84 | 7.57 | 0.73 |
| 2016 | 12.62 | 12.09 | 10.90 | 12.46 | 1.72 | 7.99 | 7.46 | 7.69 | 8.09 | 0.63 |
| 2017 | 11.18 | 10.50 | 9.75 | 11.33 | 1.58 | 7.11 | 6.86 | 6.86 | 7.57 | 0.71 |
| 2018 | 13.12 | 12.63 | 11.99 | 13.00 | 1.13 | 8.19 | 7.99 | 7.97 | 8.33 | 0.36 |
| 平均 | 12.24 | 11.61 | 10.70 | 12.24 | 1.54 | 7.83 | 7.43 | 7.42 | 8.08 | 0.66 |
九龙站的比湿日变化特征为白天小夜间大, 与气温的日变化位相相反, 14:00比湿最小, 20:00和02:00比湿皆较大。边界层大气比湿随着高度的增加迅速降低, 靠近地面的大气比湿平均日变化幅度为1.54 g·kg-1; 在离地2 km高度处比湿平均日变幅仅为0.66 g·kg-1。比湿值大的时次, 垂直梯度也大。地表比湿在4个时次的年际差幅度相当, 都略大于2 g·kg-1, 在离地2 km高度处4个时次的年际差值也相当, 略大于1 g·kg-1, 低层大气比湿的年际差幅度同样明显高于离地2 km高度处。
3.3 风速的日/年际变化特征
九龙站的风速日变化(图6)也非常有规律性: 02:00在1100 m高度附近出现一个风速极大峰值, 在3.5~4.5 m·s-1之间, 08:00风速非常小, 边界层内的风速几乎都在3 m·s-1以下, 14:00风速峰值高度位置偏低, 约在150 m高度附近, 从这个高度向上至800 m高度附近, 风速随高度的垂直变化较小, 呈现出典型的混合边界层风廓线特征。20:00风速最大, 峰值出现在1000 m高度附近。4个时次的风速在达到极大值以后都随高度减弱, 在其上空存在一个明显的风速谷值区。从9年平均来看, 02:00, 在80 m和1120 m各自出现一个极大值, 风速值分别为1.55 m·s-1和4 m·s-1, 极小值出现在220 m和1460 m高度附近, 风速分别为1.5 m·s-1和3.7 m·s-1; 08:00, 在60 m和1040 m高度附近都有一个极大值, 其值分别为1.5 m·s-1和2.75 m·s-1, 极小值出现200 m和1300 m高度附近, 其值分别为1.4 m·s-1和2.6 m·s-1; 14:00只出现一个明显的极值点, 极大值在140 m高度附近, 风速约为4.75 m·s-1, 从这个高度向上至750 m高度处, 风随高度逐渐减小, 但梯度不大。极小值出现在1460 m附近, 风速值为2.8 m·s-1。20:00, 极大值出现在1000 m高度附近, 风速为6.2 m·s-1, 极小值在1750 m附近, 风速为4.1 m·s-1。通过九龙站的地理位置(图1)显示, 九龙测站位于西北-东南向的河谷边矮山山腰, 距离测场不足5 km范围的两侧就是高度在4200~4800 m的高山, 因此, 九龙站风廓线会在1300~1800 m这个高度范围出现极小值。整个边界层内风场具有一定的不均匀性, 垂直方向上不同层次之间常常有切变存在, 就风速极大值而言, 20:00最大, 14:00次之, 08:00最小。
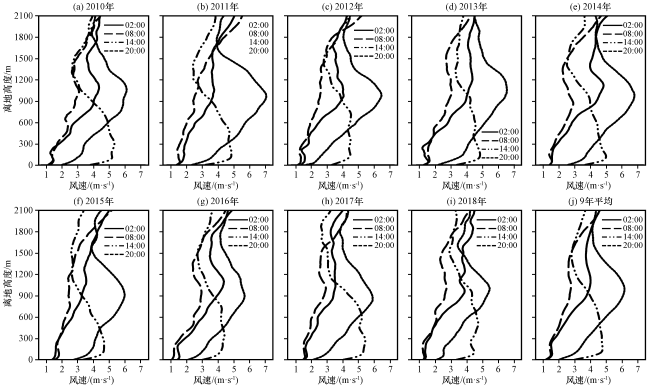
02:00, 2012年和2018年最大极值出现高度最低, 仅为980 m, 2013年最高为1220 m, 极大值出现的高度差为240 m左右, 平均风速最大值为4.8 m·s-1, 出现在2014年, 最小风速出现在2015年和2017年, 平均风速约为3.55 m·s-1, 最大风速差为1.25 m·s-1。08:00, 风速极大值所在高度最低的年份是2015年, 约为780 m, 这一年风速极大值也最小, 仅为2.5 m·s-1, 2010年和2013年风速极大值出现高度最高, 约在1050 m高度处, 2010年的风速极大值最大, 为3.1 m·s-1。14:00风速峰值高度位置偏低, 混合层中往往出现多个拐点, 这个时次风速从地面向上增长非常快, 不到200 m高度就迅速达到一个极大值, 出现第一个拐点, 2010年和2017年平均风速极值最大, 约为5.4 m·s-1, 出现在300 m高度附近, 2016年最小, 约为4.4 m·s-1, 出现在350 m高度附近, 平均风速极大值的年际差约为1 m·s-1。20:00平均风速极大值最大, 2017年风速极大值出现高度最低, 在880 m高度附近, 2010年最高, 出现在1060 m高度, 2011年平均风速极大值最大, 达到7.1 m·s-1, 2014年次之, 2018年最小, 为5.4 m·s-1, 2012年次小, 风速极大值的年际差为1.7 m·s-1。9年间各个时次风速极大值出现高度的波动范围和风速极大值有一定的差异, 02:00高度波动范围是240 m, 风速极大值差为1.25 m·s-1, 08:00高度波动范围270 m, 风速极大值差为0.6 m·s-1, 14:00高度波动范围最小仅50 m, 风速极大值差为1 m·s-1, 20:00高度波动范围是180 m, 风速极大值差为1.7 m·s-1。
九龙站风速也具有明显的日变化特征, 水平温度分布形成的斜压性和地形的共同作用使整个边界层内风场具有一定的不均匀性, 表现为垂直分布存在显著的风切变现象, 就平均风速极大值而言, 20:00最大, 14:00次之, 08:00最小。从9年间风速极大值的年际变化看, 各个时次风速极大值出现高度的波动范围在14:00最小, 08:00最大, 风速极大值之差则是08:00最小, 20:00最大。
3.4 风向的日变化特征
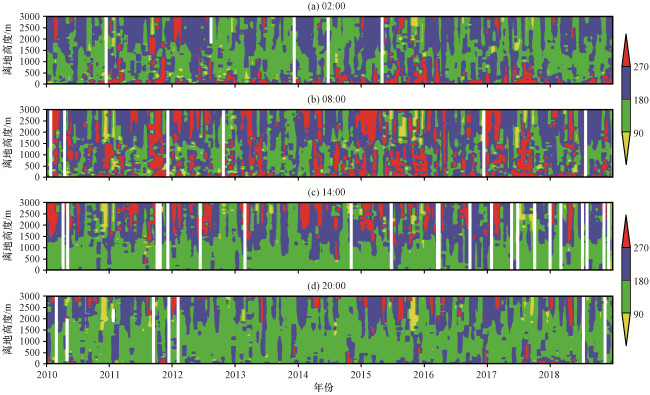
从9年间的各个时次的风向(图7)中可以看出, 02:00和08:00中下层大气的风向变化较大, 低层主要是西南风和西北风交替出现, 西北风的出现频率略大于西南风。02:00, 最底层西南风和西北风交替出现, 中间层则是东南风为主, 上层西南和东南风盛行。08:00整个边界层以西南风和西北风占主导。此后则是4个象限的风交替出现。14:00, 在1200 m以下层皆盛行东南风, 风向相对稳定, 其上层则分别以西北风和西南风为主。20:00, 整个边界层中东南风盛行的高度层最厚, 且时间都最为持久。总的来说, 受地形的动热力作用, 九龙站边界层在02:00和08:00以偏西风为主, 而14:00和20:00则是偏东风为主。
3.5 边界层高度
总体理查孙(Richardson)数通过计算浮力项和风切变的比值, 可以在一定程度上表示有无湍流的存在, 因此, 也有一些学者用它来定义边界层高度(Vogelezang et al, 1996), 其公式如下:
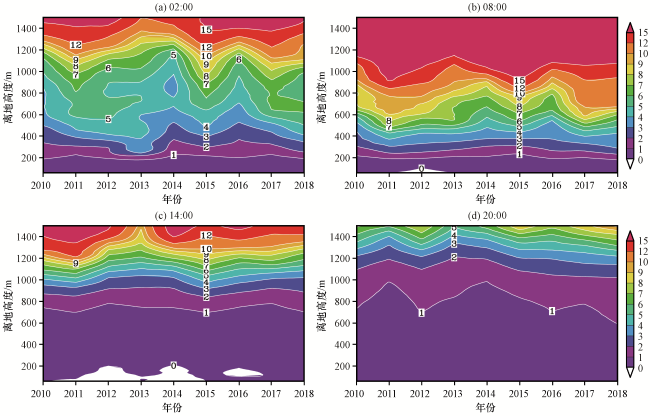
式中: 为重力加速度; 为地面海拔; 为位温; 和 分别为纬向和经向风分量。从9年逐个时次理查孙数的计算结果(图8)可以看到, 4个时次在地面以上都存在一个理查孙数小于1.0的较为深厚大气层, 1.0~2.0之间层更像一个过渡带, 2.0以上大气层的理查孙数的垂直梯度就迅速增大。根据这一现象, 本文把理查孙数等于2.0的高度作为边界层高度的一个参考高度, 由此得到: 02:00, 2010 -2018年各年平均的边界层高度分别为340, 310, 300, 220, 370, 300, 360, 320和250 m, 高度范围从220~370 m, 平均值为308 m; 08:00, 各年依次为300, 240, 250, 280, 310, 310, 260, 260和230 m, 高度范围从230~310 m, 平均值为271 m; 14:00, 各年依次为870, 850, 920, 930, 920, 840, 890, 920和900 m, 高度范围从840~930 m, 平均值为893 m; 20:00, 各年依次为1100, 1190, 1100, 1210, 1190, 1080, 1050, 1030和1020 m, 高度范围在1020~1210 m, 平均值为1108 m。图8清晰地展示了08:00边界层高度最低, 14:00混合程度最强, 20:00边界层高度最高, 这可能是边界层高度的日变化滞后于地表热通量, 边界层最大高度通常出现在17:00左右的缘故。
4 九龙站地面年际变化特征
上面采用探空观测资料分析了九龙站边界层大气垂直结构的日变化和年际变化特征, 接下来, 再结合该站地面观测资料, 分析相应年份对应时段的基本地面要素场。
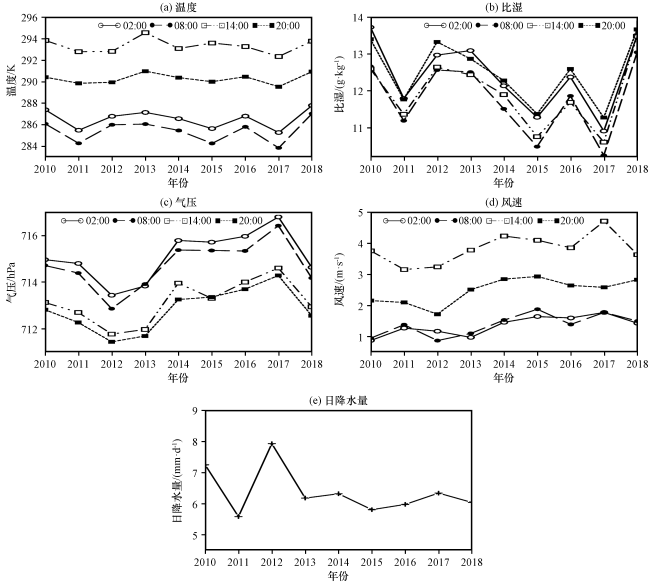
图9为加密探空观测试验期间(6月21日至7月31日)的九龙站逐年各个时次平均的地面要素场。首先对比分析地面平均温度: 2010, 2013和2018年的平均温度较高, 2012, 2014和2016年次之, 2011年和2017年最低, 最大温度年际差值为1.6 K(2013 -2011年), 日较差在6.7~9.3 K。再对比地面大气比湿演变状况: 2010年和2018年最大, 其次是2012年和2013年, 2015年和2017年皆小, 2018年和2017年最大年际差为2.66 g·kg-1, 日较差在0.6~1.13 g·kg-1。通过地面年际变化发现整个地面热力变量存在着高温/高湿, 低温/低湿的一致性; 与前面温度和比湿垂直廓线相对照后发现, 热力变量的垂直廓线形态与其地表量值之间关系十分紧密, 证明了陆气之间的热力交换对边界层结构的影响是非常显著的。2012年和2013年平均地面气压最低, 其次是2010年、 2011年和2018年, 而2014, 2015和2016年皆较大, 2017年最大, 2017年和2012年最大气压年际差为3.19 hPa。日变化规律则是02:00气压最大, 其次是08:00, 20:00气压最低, 日较差在2~2.5 hPa。地面平均风速则是2012年最小, 2015年和2017年最大, 其最大风速年际差为0.9 m·s-1。14:00的平均风速最大, 20:00次之, 02:00和08:00皆较小, 日较差值在1.9~2.9 m·s-1, 年际差值为0.9 m·s-1。地面风场与边界层风廓线之间关系不明显, 由于边界层大气动量主要由高层下传, 且贴地层摩擦大, 风速非常小。各年日平均降水量显示: 2012年降水量最多, 达到7.92 mm·d-1, 其次是2010年, 日均降水量为7.24 mm·d-1, 2014年和2017年皆超过6.3 mm·d-1, 2013年和2018年则略大于6 mm·d-1, 而2011、 2015、 2016年的日均降水量皆不足6 mm·d-1, 2011年降水量最小, 仅有5.57 mm·d-1。从年际变化看, 降水与地面温、 湿、 风、 压场之间具有一定的对应关系: 降水和地面温度、 比湿之间存在正相关关系, 和地面气压/风速之间存在负相关关系。这反映了有利的局地热力(高温高湿)条件对降水的重要性, 而低气压扰动同样有利于降水的产生。2012年九龙站温度和比湿都较大, 而气压偏低、 风速较小, 热力和动力气象要素场有利配置, 使其成为9年间日均降水量最大的年份。
5 结论与讨论
基于高原所在青藏高原东坡的九龙站9年夏季连续开展的西南涡探空加密观测试验资料, 通过对比分析该站边界层大气的日变化和年际变化特征, 得到以下主要结论:
(1) 九龙站边界层大气温度08:00最低, 其次是02:00, 14:00最大。近地层大气温度日变幅大, 2 km高空大气温度日变幅小。温度低的时次对应的其垂直梯度小。地面大气平均温度年际差在14:00低于08:00, 平均温度日变幅在5.5~8.1 K。离地2 km高度处的平均温度年际差与地面大气相当, 但日变幅幅度比地面大气明显减小。单就年际差而言, 低层大气平均温度的偏差幅度比高层大, 但最大偏差值并非出现在最接近地表的大气层。
(2) 九龙站地面比湿在14:00最小, 20:00和02:00较大。地面大气平均比湿日变化幅度为1.54 g·kg-1, 而离地2 km高度处仅为0.66 g·kg-1。比湿大的时次, 其垂直梯度也大。地面/2 km高度处大气平均比湿的年际差幅度在4个时次都相当, 其中地面平均比湿各个时次的年际差都略大于2 g·kg-1, 明显高于离地2 km高度处略大于1 g·kg-1的年际差。
(3) 九龙站边界层内风场具有一定的不均匀性, 在垂直方向上存在风切变。单比较边界层内风速极大值, 20:00最大, 14:00次之, 08:00最小; 边界层在02:00和08:00以偏西风为主, 而14:00和20:00则是偏东风为主。各个时次平均风速极大值出现高度的波动范围在14:00最小, 08:00最大。风速极大值的变幅与风速大小相一致, 08:00最小, 20:00最大。
(4) 以总体理查孙数为参考得到的九龙站边界层平均高度在08:00最低, 20:00最高, 14:00混合程度最强。
(5) 九龙站地面平均温度日变幅在6.7~9.3 K, 最大平均温度的年际差为1.6 K。地面大气平均比湿日变幅在0.6~1.13 g·kg-1, 最大平均比湿的年际差为2.66 g·kg-1, 。地面平均气压在02:00最大, 其次是08:00, 20:00最低, 日变幅在2~2.5 hPa, 最大平均气压的年际差为3.19 hPa。地面风场的平均风速在14:00最大, 20:00次之, 02:00和08:00皆较小, 日变幅在1.9~2.9 m·s-1。
(6) 从九龙站地面物理量的年际变化来看, 降水和温度/比湿之间存在正相关关系, 和气压/风速之间存在负相关关系。
虽然本文对比分析了位于青藏高原东坡复杂地形下具有典型天气意义的九龙站大气边界层的基本特征, 得到一些重要的观测事实。但是, 关于九龙站边界层温度、 湿度、 气压、 风速风向等热力、 动力特征及其变化, 尤其关键物理量的垂直分布、 日变化等的天气与气候意义, 依然是有待继续深入分析研究的重要科学问题。