
1 引言
沙尘暴虽是世界各干旱区春、 夏季常见的灾害性天气, 但在天气雷达、 气象卫星等先进观测手段问世前, 人们只能从地面仰视(不是鸟瞰)沙尘暴。鉴于沙尘暴过境时风骤沙浓, 漆黑一片, “天空状况不明”, 台站或因停水停电, 资料缺测, 事后分析困难。过去国内外对沙尘暴的现象、 灾情描述性介绍多, 实质性研究寥寥可数(徐国昌等, 1979; Lawson, 1971; Idso et al, 1972; Brazel et al, 1986; Middleton, 1986)。如早先认为中国甘肃河西走廊一带的沙尘暴常为西北路径冷空气入侵所致, 为低压冷锋型(更有人称纯冷锋型)沙尘暴(徐国昌等, 1979; 方宗义等, 1997)。1993年5月5日(下称19930505)金昌特强沙尘暴爆发后, 加上1999 -2002年中蒙东区沙尘活动频发, 人们又能借助气象卫星从空中观测, 东亚各国和地区的学者们掀起了对我国沙尘暴研究的新高潮, 催生了数十上百篇相关论文的发表(方宗义等, 1997; 石广玉等, 2003; 邵亚平, 2004; 钱正安等, 2006; 张强等, 2011)。
上述论文中, 钱正安等(1997a)、 项续康等(1996)及胡隐樵等(1996)揭示了19930505金昌特强沙尘暴是由飑线触发的; 宋敏红等(2007)从诱发沙尘暴的低压、 沙源、 入侵冷空气路径及主要影响区等方面看, 将中蒙地区的沙尘暴区分为中蒙东、 中、 西三大不同区系; 李雪等(2015)研究指出我国北方春季沙尘暴出现频数与亚洲大陆对流层高层中纬度西风急流存在密切联系; 许宝玉等(1997)和江吉喜等(1996)提出了如何监测、 预报沙尘暴; 王根绪等(2002)还特别提出如何刻不容缓地抓好西北区生态环境治理等大问题。
本文尝试充分利用后来尽可能得到的各种资料, 努力从全球视野, 综合分析、 讨论这次沙尘暴爆发前后, 地面风压场、 卫星云图及灾区对流天气演变等细节特征, 除讨论低压和冷锋天气形势的影响外, 还讨论飑线、 雷暴对流等不同天气形势对沙尘暴的影响和联系。
2 金昌沙尘暴的天气背景和演变概况
1993年5月5日从北疆有西北路径冷空气入侵河西走廊[图1(a)]。当天地面冷锋一路东南下, 过临泽、 经张掖、 抵山丹, 在山丹-金昌途中, 才由冷锋演变为飑线沙尘暴灾害性天气。
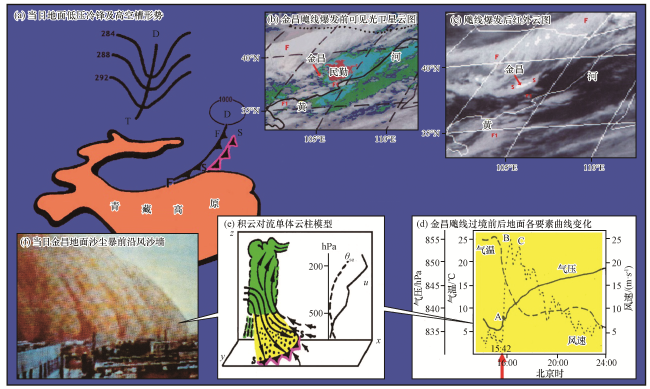
据现场调查报告(“调查报告”)(钱正安等, 1997a), 5日14:16(北京时, 如无特别说明, 下同), 冷锋过临泽时只短时间刮了17~21 m·s-1的大风, 短时间能见度降至50 m以下; 经张掖时, 可能因张掖绿洲面积更大, 风沙现象甚至比临泽更弱, 是可以理解的; 但认真的张掖观测员曾专业性地提醒我们, 冷锋过境时曾见“一块块积云移过”, 即下面屡次提及的“从祁连山区有伸向河西的中、 小尺度对流云带”。
15:42, 沙尘暴前缘风沙墙过境金昌, 沙尘暴(当地俗称“黑风”)爆发, 更准确地说, 是飑线形成, 并触发了沙尘暴。顷刻间黑风吞噬了金昌市, 风骤(达34 m·s-1)、 沙浓(浓度达1016 g·m-3), 是当时世界见诸报道过的最强沙尘浓度记录(方宗义等, 1997; 钱正安等, 1997a)、 天黑(地面能见度降为0 m)。黑风在金昌肆虐了近2 h, 酿成近百名正在放学回家途中的学生落入灌溉渠中溺水而死的事件。
接着, 黑风继续东南下, 又先后袭击了武威、 民勤、 古浪、 乌鞘岭等站, 各站分别出现了“闻雷”、 “炸雷”、 “阵性泥浆雨”及“雨雪交加”等不同程度的对流性天气。17:20, 黑风抵达宁夏中卫站, 最大风速达38 m·s-1, 维持了75 min。至此, 黑风在长途跋涉近500 km, 耗时5 h后, 终于耗尽了它的能量, 留下了方圆500 km的重灾区, 故被称为特强沙尘暴。
下面分别从飑线爆发前后地面风压场的剧变、 卫星云图特征及飑线等不同天气型对沙尘暴的影响和联系等三方面予以分析、 讨论。
3 飑线爆发前后金昌站地面风压场等的剧变
单站地面风、 温、 压演变曲线常是本站及邻近地区近地面风压场变化的反映, 也是各地分析飑线、 雷暴对流等中尺度天气系统的常用工具图。
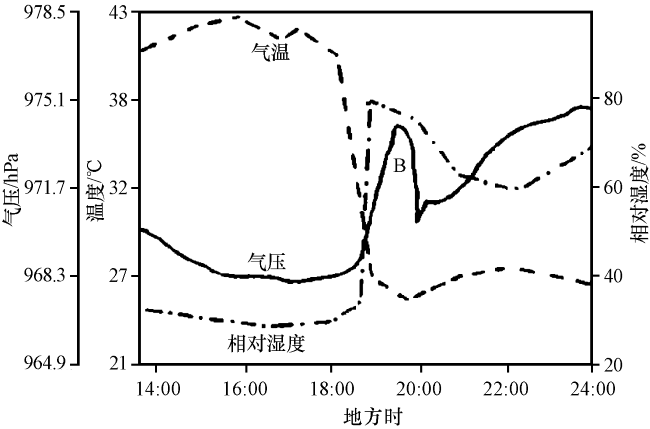
徐国昌等(1993)曾仔细订正了金昌站该日午后至傍晚期间的地面气压、 风速及气温等要素的自记曲线[图1(d)], 是分析这次沙尘暴变化特征的重要资料之一。徐国昌等(1993)首先揭示, 金昌沙尘暴过境前后, 气压曲线(实线)上15:42(红色箭头处)出现了有代表性的、 先升后降的弱气压“跃升峰A”(作者原称“气压鼻”); 同时地面风速(虚线)也在几分钟内由5 m·s-1急升至25 m·s-1, 且近2 h内出现了B、 C二峰; 正好分别与“调查报告”中15:44 -16:00及16:30 -16:45地面风更大、 天更黑的两时段相对应; 因当时停电, 也感谢敬业的金昌观测员们硬是齐心协力打着手电、 对着手表, 才在观测簿上留下了这珍贵的沙尘暴变化细节记录, 且B峰风更强等事实; 再查, 气温也由25 ℃急降至10 ℃以下。徐国昌等(1993)还指出, 上述气压等曲线上以跃升峰为代表的要素剧变及对流天气仅出现在金昌以东各站; 而山丹以西则没有。显然, 这些要素和天气的区域性变化不是偶然的。
可惜当年分析时, 限于当时的认识, 我们也未充分注意上述气压跃升峰特征, 更未联系飑线和积云对流动力学知识, 仔细解释前述诸细节特征所反映的飑线过境的物理本质(钱正安, 1997a)。后来联系到Johnson et al(1985)总结的飑线模型, 才知地面出现气压跃升峰等是飑线地面中尺度高压的产物, 是国内外飑线过境时共同的特征, 也是从地面识别飑线过境的重要标志之一(钱正安等, 1997b)。
4 关于飑线沙尘暴的研究
飑线爆发前后的变化也出现在高空。20世纪90年代前河西走廊地区尚无天气雷达回波观测, 幸有这次沙尘暴爆发前后日本地球静止卫星葵花GMS每隔1 h一次的3幅可见光及红外云图(钱正安等, 1997a)及项续康等(1996)同时刻的红外云图, 经定位、 放大和增强处理后, 再在微机上读取云顶亮温TBB数字图(图2)的补充, 这些都是当年确认金昌一带出现了飑线对流的重要依据之一。
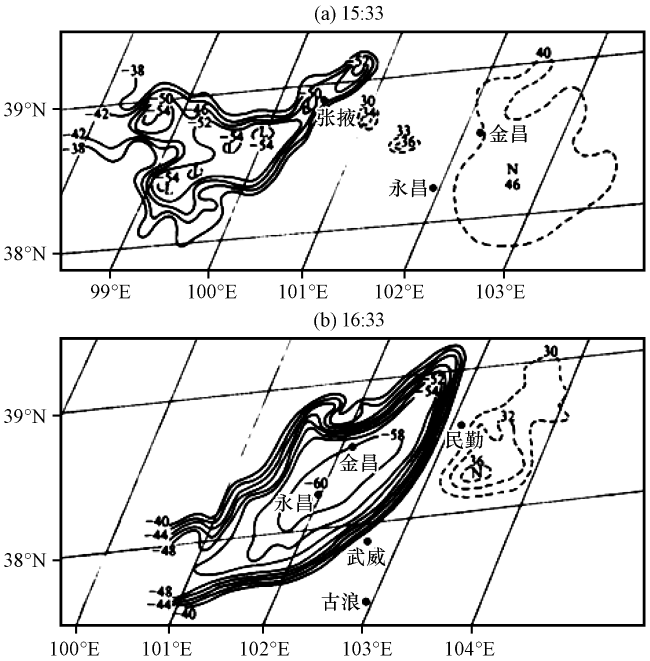
图2 1993年5月5日金昌特强飑线沙尘暴云系等亮温线分布(引自项续康等, 1996)实线为云顶等亮温线, 虚线为地面等亮温线 Fig.2 Distribution of the brightness temperature isolines of the cloud system in 19930505 squall duststorm in Jinchang, China (From Xiang et al, 1996).Solid lines are the brightness temperature isolines on the cloud top, dash lines are that on the surface |
该日14:33的可见光云图代表飑线沙尘暴爆发前[见图1(b)]。它北有大尺度的冷锋云带FF, 北边界齐整, 南边界参差不齐, 其中段南缘明显南凸; 张掖西南方还有“从祁连山区伸向河西的中、 小尺度对流云带F1F1”, 两者似有在金昌附近合并之势。
金昌以东是大片晴空无云区, 民勤及周围地区的大片红色区指示其地面温度达30~40 ℃, 图2(a)更指示15:33金昌南方地面更达46 ℃, 表明午后金昌以东地区近地层呈强绝热不稳定状态。至15:33可见光云图上, 从祁连山区伸向河西的对流云系进一步发展, 且更白亮; 金昌、 民勤一带的红色高温区已明显收缩; 只因此时沙尘暴仍未爆发, 才未给出该图。16:33红外云图[见图1(c)]代表飑线爆发后, 它已与图1(b)大相径庭: 1~2 h前原在金昌一带南北待合并的对流云带确实已合并在同一片对流云区中。更值得注意的是该云区中间有一狭长、 有组织的白亮云带SS, 其长度约是宽度的3倍以上, 这一清晰但不很起眼的云带正是典型飑线对流带的反映。在红外云图中更白亮处指示对流发展更旺盛, 云顶伸展更高, 这比先前使用的黑白素描云图更清楚(钱正安等, 1997a)。可惜在1993年兰州沙尘暴会议上一些人却忽略了这一重要云图细节特征, 下面我们将进一步指出, 正是它先触发了金昌沙尘暴爆发。
项续康等(1996)用分别代表沙尘暴爆发前后15:33及16:33两时刻的展宽红外TBB图, 更将金昌-民勤一带午后强对流云区的东南移和强度变化客观定量地示形于纸上(图2)。
在TBB数值图上, 一般将TBB值≤-32 ℃者定义为对流活动区。TBB值越低, 说明其对流云云顶越高, 对流发展越旺盛; 反之亦然。图2(a)上对流区尚在张掖西南像元, 区内仅有3~4处孤立点状的≤-54~-50 ℃的弱对流区, 云区无组织也不连片, 项续康等(1996)仅称其为“断线飑线”; 因该时刻飑线沙尘暴仍未爆发, 该弱而不连片的对流云区虽对河西地区输送了部分水汽, 但直接触发金昌飑线沙尘暴者还是后来东南移了的对流云区(图2b)。如该图所示, 这时永昌、 金昌等站已处在≤-58 ℃的更强对流中心区, 永昌的TBB值更达-60 ℃, 已是相当旺盛的对流云区了; 再配合同时刻的红外云图[见图1(c)]及金昌、 永昌等地飑线沙尘暴已爆发的事实, 可进一步证实图2(b)的飑线对流特征。
须指出如下两个事实细节: 一是16:33金昌沙尘暴虽已爆发, 且已在该站为害51 min了; 但由图2(b)可见, 这时下游的武威、 民勤站等仍处在上述飑线对流区的东南边缘, 即当时飑线(或沙尘暴)还未到达武威、 民勤。查“调查报告”知, 飑线沙尘暴确实也是约11 min后(即16: 44左右), 才经过上两站的; 且在武威时“闻雷”、 有“阵性泥浆雨”; 在民勤虽记载有“Cb云”记录, 但未“闻雷”, 也未见“雨滴及地”。即同时间在飑线沙尘暴灾区南、 北部出现了共同、 但又有区别的对流现象: 南部强、 北部弱; 无论从图1(b)、 (c), 还是从图2(b), 直接触发金昌一带15:42飑线沙尘暴的是位于冷锋云带FF前的飑线对流带SS。于是有图1(d)金昌风速曲线上15:42后出现了第一个强风峰B; 约1 h后, 待后面的冷锋冷空气“援军”加速赶上, 于是金昌地面风速曲线上, 继B峰后又出现了弱些的C峰, 金昌沙尘暴又二度加强。由于风强(金昌最强风达34 m·s-1), 天空漆黑, 先后持续了近2 h之久, 又由于缺乏防强沙尘暴的知识, 才酿成这次灾害中生命和财产的重大损失。
当时正是根据上述高空卫星云图特征及“调查报告”等的观测事实, 钱正安等(1997a)、 项续康等(1996)及胡隐樵等(1996)提出, 金昌沙尘暴是先由冷锋前暖区的飑线触发, 随后又由其后的冷锋加强的“干飑线+低压冷锋”的混合型沙尘暴。考虑到当时的不同看法, 为求同存异; 也考虑到干旱区水汽少、 飑线弱的特点; 我们才用了“干飑线”的字眼, 详见5.3节最后的讨论。它突破了我国北方沙尘暴常仅由低压冷锋引起的传统认识(徐国昌等, 1979; 王式功等, 2000; Qian et al, 2002; 刘景涛等, 2004), 更好地解释了此次沙尘暴为什么能维持这么长时间, 危害这么重的原因。
其实, 后来从全球视野看, 沙尘暴不仅常出现在“低压冷锋”天气形势下, 还可出现在飑线、 雷暴对流等不同天气形势下(胡隐樵等, 2003)。前者如19710716美国亚利桑那州菲尼克斯飑线沙尘暴(Idso et al, 1972); 后者如19690619及19690620北非苏丹喀土穆雷暴沙尘暴(Lawson, 1971)。
值得注意的是, 约10年后日本学者Takemi et al(1999, 2000)分别从19930505 16:33等同样的GMS-4红外卫星云图等, 也揭示了金昌地面冷锋前“很有组织的飑线结构”, 还强调它是“干旱区环境下的长生命史飑线”; 并利用一个二维可压缩非静力云模式, 模拟了该飑线发展和维持的机制。该两篇文章均发表在国际知名大气科学刊物上, 这也是对前述金昌特强沙尘暴由飑线引起观点的重要支持。
5 三个问题的讨论
为进一步回答全球各干旱区引发沙尘暴不同的盛行天气形势, 看飑线、 雷暴对流天气等是怎样引发沙尘暴的, 以及当地水汽多少对飑线强弱影响等前述争议问题, 尚需作下列讨论。
5.1 各干旱区诱发沙尘暴的不同盛行天气型
由于气象及地理条件等的差异, 全球各干旱区产生沙尘暴的盛行天气型也不尽相同, 各地产生沙尘暴的形势也不是唯一的。天气预报实践, Qian et al(2002)及刘景涛等(2004)的普查分析均表明, 我国北方沙尘暴大多数出现在低压冷锋形势下。可以理解, 地处西风带的河西走廊地区春季冷空气活动频繁。在前一次冷空气后, 随着天气短暂回暖, 热低压加强, 必将孕育着新一轮冷空气(低压冷锋)的入侵, 如此往复。特别是冷锋在午后过境时, 由于气层不稳定度加大, 冷锋后的强风增强了起沙的动力; 再加上当地多沙的地理背景, 正好同时满足了我们先前归纳的沙尘暴形成的三要素: 丰富的沙源是物质基础, 强风是起沙的动力, 气层不稳定是更易起沙的热力条件。由此推知, 在其他天气形势下, 如飑线、 雷暴对流等天气形势下, 因它们本身就是气层不稳定度明显增加的结果, 并出现了下面将提及的积云下曳气流强风动力, 如果又出现在多沙地区, 由于也同时满足了前述沙尘暴形成的三要素, 自然也会出现沙尘暴。实际上, Brazel et al(1986)、 Idso et al(1972)及Middleton(1986)也早就对北美、 北非及西南亚等干旱半干旱区的沙尘暴形势进行了普查总结, 也确实证实低压冷锋、 飑线及雷暴对流等分别是北美、 北非及西南亚等地沙尘暴出现的常见天气型。其中, 北美更多飑线沙尘暴, 北非则多雷暴对流沙尘暴。受北美洲西部落基山背风坡下沉及中高空干盖的影响, 美国春、 夏季气层常更不稳定, 故常出现飑线和龙卷风等强对流, 而季风雨现象不明显, 更少暴雨天气; 但位于同纬度的东亚区则相反, 很少飑线及龙卷风强对流, 而多暴雨天气。因东亚区气层更稳定些, 直到近年才见我国南方湿润区江苏镇江、 湖南西部桃园及西北干旱区金昌寥寥三例飑线的报道; 因东亚季风现象典型, 故东亚区多暴雨天气(李维京, 1985)。
看来, 不同干、 湿(指干旱、 半干旱及湿润区)环境下都可出现飑线天气。Idso et al(1972)也认为苏丹的雷暴对流沙尘暴与美国飑线沙尘暴有许多相似处。自然, 飑线对流在积云云系组织方面更有序, 对流活动更强, 触发的飑线及沙尘暴也会更强些。
5.2 飑线触发沙尘暴的机理
不了解飑线触发沙尘暴的机理, 也可能是前述争论的重要原因之一。干旱区学者对飑线等强对流天气可能陌生些。这里先简要介绍一下飑线的相关概念。飑线是一短生命史的中、 小尺度强对流天气。顾名思义, 它是空中一狭窄的线状强积云对流带或雷暴带, 要求其对流带的长度是宽度的3倍以上, 飑线和雷暴带常由几个积云单体构成, 如下面Idso et al(1972)提及的美国19710716菲尼克斯(Phoenix)飑线沙尘暴, 在其北移至菲尼克斯市时[即7月16日19:00(美国东部时间)], 就由三个积云单体并排而成(图3), 它们正好逐一对应着地面不断向前推进的沙尘暴前缘三段弧形外凸的风沙墙。
根据早先藤田(1959)及后来Johnson et al(1985)总结归纳的飑线模型: 它的生命史可分发展、 成熟及残余期等5个发展阶段。在成熟期地面气压场上, 紧随强对流线后依次分布着狭窄的中尺度高压(也称雷暴高压)、 雷阵雨及中低压(也称尾随低压)带; 中高、 低压带常在飑线雷达回波带内(图略); 至残余期, 中低压已填塞, 地面只留下中高压。对照前述国内外我国甘肃金昌、 美国菲尼克斯以及下面的我国江苏镇江三例飑线过境时, 前两例地面诸要素曲线图气压曲线上对应时刻出现了气压跃升峰A、 B[图1(d), 图3]。而我国19890813江苏镇江飑线(王亚君等, 1990), 文中虽未直接给出该飑线过境前后的地面气压曲线图等, 但从地面各站各要素变化表看(原文表3), 在灾情最严重的句容、 镇江及丹阳等站13:39 -14:34期间, 4~5 min内地面气压就分别跃升2.5~4.9 hPa; 再结合13:00 -15:00期间镇江、 丹阳一带最低地面气压从飑线前1004.2 hPa到飑线后留下的雷暴高压最高达1007.9 hPa等, 估计这一带飑线过境时地面气压平均跃升了4 hPa左右。我国湘西桃园飑线时亦然(图略)。可见各地出现地面气压跃升峰是飑线过境时的共同特征。再加上前述Johnson et al(1985)的飑线模型, 飑线后期地面中低压已填塞, 只留下中高压。这样各地的气压跃升峰实际应是飑线地面主要系统中高压的反映, 是下面将提及的飑线积云单体下曳冷气流在地面堆积的“冷空气堆”, 也是识别飑线(或雷暴对流)过境的另一重要特征。
人们自然更关注飑线、 雷暴对流等触发沙尘暴的机理。由积云动力学知识知, 飑线(或雷暴群)对流云的基本单元是积云单体, 积云单体云柱模型常包括两股垂直气流: 一是云柱右前方顺时针螺旋形上升的云内上升气流, 二是云柱左后方中下层的下曳气流[图1(e)]。我们更关注后者。正是它快速向下倾泻到近地面时又向四周流散开, 其强风足以吹起地面沙尘。犹如“低压冷锋”型锋后的强风可吹起地面沙尘一样; 这里“飑线”(或“雷暴对流”)型积云单体云柱的下曳气流强风也可吹起地面沙尘, 形成沙尘暴的风沙墙[图1(e), (f)], 从而也引起地面强风、 降温、 升压等要素的剧变及雷阵雨。因此, 北非干旱区人们又称沙尘暴为“下曳沙尘暴(down drought haboob)”。这里“haboob”是非洲人对沙尘暴的俗称。
人们或许不详细了解前述飑线模型及积云动力学等的全部知识, 但却熟知雷阵雨常相伴出现强阵风、 降温等事实。殊不知, 它们都是飑线及雷暴发展时的积云对流所为, 是积云单体强下曳气流的产物, 也是飑线、 雷暴对流触发沙尘暴的机理。
目前, 常根据传统的历史外推法预报绝大多数大尺度低压冷锋型沙尘暴, 要直接预报像中蒙中区金昌那样的飑线强对流混合型沙尘暴还有困难。但我们对中蒙中区系(指北疆、 河西走廊、 内蒙古中西部及蒙古国西北部)5例强沙尘暴(包括19930505金昌沙尘暴)的合成分析表明, 平均说来, 强沙尘暴前3~4天河西就已孕育了一次连日升温回暖降压过程; 到沙尘暴当日08:00地面图上已见低压冷锋形势(有时低压偏弱, 或偏北在蒙古国); 在其冷空气上游“风口”站额济纳旗07:00 850 hPa已出现≥17 m·s-1的大风; 至当日中午及午后, 如前述更见云图上有来自祁连山区的积云伸向河西并有与北方冷锋云系合并之势、 地面强烈增暖、 减压特征、 乃至卫星云图上的狭窄、 浓白云带等。其中, 19930505金昌沙尘暴更为显著。如5日15:00金昌1 h降压3 hPa多[见图1(d)], 甘肃民勤站亦然。须知, 国外早就称降压率在1 hPa·h-1以上的低压为“爆发性低压(bomb cyclon)”。金昌这一降压强度已是很强的锋生现象了。查历史上国外几次海上豪华游轮的倾覆事件、 2018年夏季美国强暴雨及2019年11月8日重创日本的第19号“海天思”超级台风暴雨等均归因于此类“爆发性气旋”的迅速发展。这次金昌飑线沙尘暴也就在上述南北云系合并部位、 在地面强降压-锋生区爆发的。应该说在爆发前已有预兆; 飑线过境时也显示出地面气压跃升峰及高空狭窄浓白对流云带等飑线标志性特征, 可惜当年分析时对上述细节特征注意不够。后来张小玲等(2006), 李祥余等(2009), 姜学恭等(2014)分别对中蒙西区系(主要指南疆区)及中蒙东区系(主要指二连浩特以东的东北、 华北和蒙古国东部)沙尘暴分析也指出有上述类似特征。
这样在各地沙尘暴多发季节(以中国为例, 3 -5月)、 时段(午后-傍晚间)及多发区, 只要注意跟踪上述分析特征, 把中、 短期乃至临近预报相结合, 再配合当日卫星云图及沙尘图等, 不断滚动地作补充订正预报, 更多更及时地捕捉强对流型沙尘暴变化的预警信息是可能的。
5.3 不同干、 湿环境下飑线特征的部分对比
前述我国金昌、 美国菲尼克斯及我国江苏镇江三例飑线正好分别出现在干旱(年均雨量25~200 mm)、 半干旱(年雨量在200~500 mm)及湿润区(年雨量在500 mm以上)。那么, 以上不同干、 湿程度区飑线的地面气压跃升峰及雷阵雨强度等的差异, 是否也可部分反映当地水汽因素对飑线强度发展的影响呢?
可能因干旱区金昌站水汽少, 飑线过境时, 地面气压跃升峰A升、 降压幅度仅2~3 hPa, 其波形又尖, 表明金昌飑线时地面中高压不强, 水平尺度不大, 且中高压维持时间短暂(不足30 min), 即干旱区飑线发展确实不完好; 又由于气压跃升峰A叠加在冷锋前陡峭的升压曲线背景上, 更显得跃升峰不起眼[图1(d)]; 卫星云图上虽见到典型飑线狭长浓白的对流云带标志, 但实际其对流不算强, 雷阵雨微弱, 且灾区南北部有区别: 微弱的雷阵雨主要出现在祁连山北麓, 虽“闻雷”, 还是“炸雷”, 但却是“干打雷, 不下雨”; 更干的北部(指金昌、 民勤一带), 虽见Cb云记录, 但未闻雷声, 也未见雨滴及地, 且飑线过境后湿度还变干了。可以理解, 因北部的大气边界高度更高, 有限的雨滴早在云下未饱和层被蒸发殆尽了。即金昌飑线的灾害主要表现在风骤沙浓的强沙尘暴方面, 而不是强雷雨方面。
再到当地更湿的江苏镇江飑线, 如前述灾情最重的镇江、 丹徙、 丹阳一带的地面气压平均跃升了4 hPa左右; 5 min后气温急降了9 ℃; 雷达积云对流回波旺盛, 最高积云单体云顶高近20 km, 飑线狂风使大范围电力设施破坏、 电讯中断及停电事件, 雷阵雨显著。飑线虽强, 但因当地下垫面植被覆盖好, 地面无沙可起, 自然不会出现沙尘暴。
将以上总结对比如下, 上述三地区确实都出现了地面中高压、 高空浓白、 线状对流云带及雷阵雨等飑线共有的标志性特征。但因各地区的水汽、 下垫面状况等有别, 各该地区的飑线及其对流天气又各不相同。
因湿润区、 半干旱区水汽多或稍多, 地面中高压发展完好, 飑线强、 雷阵雨明显。其中, 湿润区因植被覆盖好, 地面无沙可起, 即使强飑线也不能触发沙尘暴; 半干旱区因地面植被稀疏、 多沙, 强飑线则能触发沙尘暴。而干旱区与前两区几乎相反, 因水汽少、 飑线弱, 雷阵雨也较弱, 尤其灾区北部, 因下垫面裸露、 多沙, 热力不稳定强, 弱飑线照样触发了金昌特强沙尘暴。前文中的“干飑线”实际就是在干旱区环境下发展不完好的弱飑线, 它被深深地打上了干旱区水汽少、 多沙影响的烙印。看来, 水汽多(少)确有加强(减弱)湿润及半干旱(干旱区)飑线的作用, 以前对此质疑是合理的。当然, 上述论点还有待更多个例的检验。
6 结论
由上述综合分析和讨论, 可得到如下主要结论:
(1) 主要根据气象卫星云图上的狭长、 浓白的飑线云带、 地面气压跃升峰及雷阵雨等飑线标志性演变特征揭示, 19930505金昌沙尘暴是先由冷锋前暖区的干飑线触发, 待其后冷锋赶上, 沙尘暴又二度加强的“干飑线+低压冷锋”混合型沙尘暴, 史上罕见。
(2) 金昌干飑线形成前先后出现了强热力不稳定和强锋生等飑线预兆; 是飑线积云对流单体云柱左后方中下层的下曳气流强风为地面起沙提供了动力, 再加上金昌地区地面植被裸露、 多沙, 故飑线触发沙尘暴也是合理的。
(3) 在不同干、 湿环境下均可出现飑线天气, 但其飑线和沙尘暴特征确有一定差别: 湿润区和半干旱区飑线, 地面跃升峰强, 雷阵雨强, 飑线强; 而干旱区飑线则反之。地面跃升峰弱, 雷阵雨也弱, 飑线也弱。即水汽多(少)确有加强(减弱)湿润和半干旱区(干旱区)飑线的作用。