1 引言
2 资料选取与方法介绍
2.1 资料选取
2.2 方法介绍
3 高原感热的气候分区
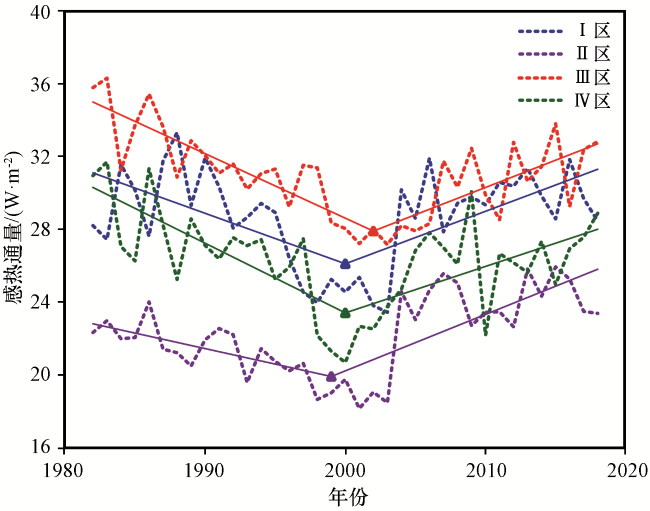
图2 1982 -2018年青藏高原4个分区年平均感热变化过程Fig.2 Changes of annual-mean surface sensible heat flux in the four zones and their linear trends in the Qinghai-Xizang Plateau from 1982 to 2018 |
表1 青藏高原各分区地表感热及其相关气象要素在趋势转折前后的气候倾向率Table 1 Climatic tendency rates of the surface sensible heat flux, surface temperature, air temperature, surface-air temperature difference and surface wind speed before and after the trend transition of annual-mean surface sensible heat flux in four zones |
| 要素 | 时间 | 各区域的趋势转折前后的气候倾向率 | |||
|---|---|---|---|---|---|
| Ⅰ区(2000年) | Ⅱ区(1999年) | Ⅲ区(2002年) | Ⅳ区(2000年) | ||
| 感热通量/[W·m-2 ·(10a)-1] | 转折前 | -3.01** | -1.97** | -3.53** | -4.20** |
| 转折后 | 2.93** | 3.02** | 2.97** | 2.63** | |
| 地表温度/[℃·(10a)-1] | 转折前 | 0.50** | 0.29* | 0.36** | 0.23 |
| 转折后 | 0.60** | 0.64** | 0.39* | 0.33 | |
| 气温/[℃·(10a)-1] | 转折前 | 0.67** | 0.34 | 0.37** | 0.30 |
| 转折后 | 0.21 | 0.37** | 0.26 | 0.34* | |
| 地气温差/[℃·(10a)-1] | 转折前 | -0.17** | -0.05 | 0 | -0.07 |
| 转折后 | 0.39** | 0.27** | 0.13 | 0.01 | |
| 地面风速/[m·s-1 ·(10a)-1] | 转折前 | -0.18** | -0.30** | -0.42** | -0.35** |
| 转折后 | 0.03 | 0.18** | 0.28** | 0.18** | |
**表示通过α=0.01显著性水平t检验; *表示通过α=0.05显著性水平t检验; 表头括号内年份表示各区域的趋势转折点 |
4 高原感热趋势转折的空间特征
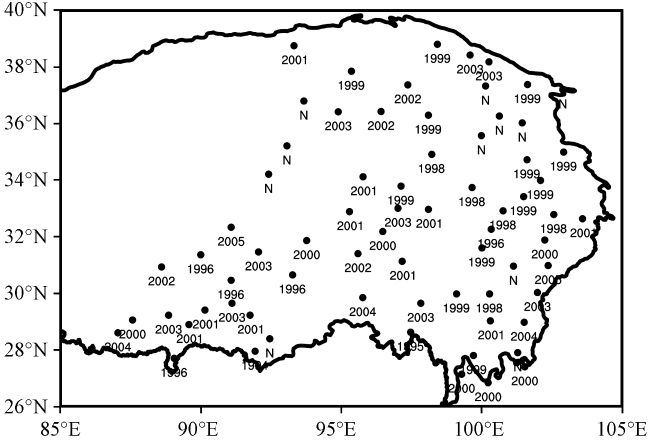
图4 1982 -2018年青藏高原70个气象站年平均感热趋势转折点N表示没有趋势转折, 数字表示趋势转折年份 Fig.4 Distribution of turn points in annual-mean surface sensible heat flux trend of 70 observation stations in the Qinghai-Xizang Plateau from 1982 to 2018.N means there is no significant trend turning, number means the turning point of the trend |
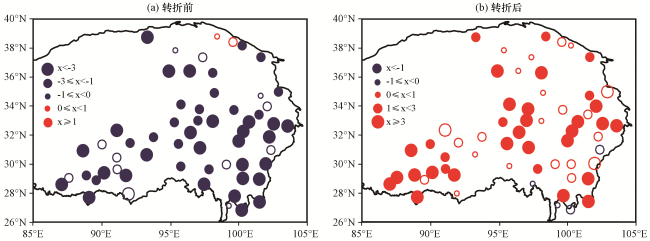
图5 1982 -2018年青藏高原各站年平均感热趋势转折前后气候倾向率分布[单位: W·m-2 ·(10a)-1]实心通过α=0.05显著性水平检验 Fig.5 Distribution of the climatic tendency rate before and after the transition of annual-mean surface sensible heat flux trend in the Qinghai-Xizang Plateau from 1982 to 2018.Unit: W·m-2 ·(10a)-1.Solid points pass α=0.05 confidence level t test |
5 影响高原感热趋势转折的关键因子的定量分析
表2 高原年平均地气温差和地面风速在感热趋势转折前后对感热变化影响的方差贡献超过50%的站数比例Table 2 Proportion of stations with surface-air temperature difference and surface wind speed contributing more than 50% to variance of before and after the transition of annual-mean surface sensible heat flux trend in four zones |
| 因子 | 转折前站数 | 转折后站数 | ||||||
|---|---|---|---|---|---|---|---|---|
| Ⅰ区 | Ⅱ区 | Ⅲ区 | Ⅳ区 | Ⅰ区 | Ⅱ区 | Ⅲ区 | Ⅳ区 | |
| 地气温差 | 3/6 | 7/21 | 6/16 | 4/11 | 7/7 | 16/24 | 6/16 | 7/11 |
| 地面风速 | 3/6 | 14/21 | 10/16 | 7/11 | 0/7 | 8/24 | 10/16 | 4/11 |
表中站数比例的分母表示高原各区感热趋势转折前后地气温差和地面风速方差贡献超过50%的总站数 |
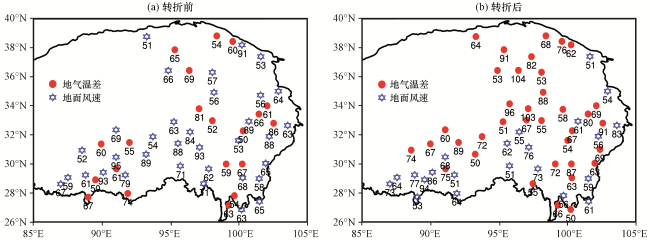
图6 1982 -2018年青藏高原年平均感热趋势转折前后各站地气温差和地面风速的方差贡献超过50%的站点分布(单位: %)Fig.6 Distribution with variance of surface-air temperature difference and surface wind speed contributes over 50% before and after the transition of annual-mean surface sensible heat flux trend over the Qinghai-Xizang Plateau from 1982 to 2018.Unit: % |
6 高原温度对北半球气温的响应
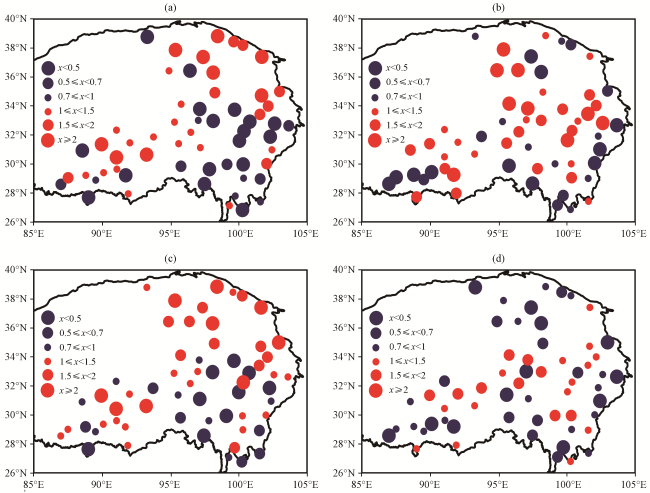
图7 1982 -2018年青藏高原年平均感热趋势转折前(a, c)后(b, d)各站地温(a, b)和气温(c, d)与同期北半球气温的气候倾向率比值Fig.7 Ration of climatic tendency rate of surface temperature (a, b) and air temperature (c, d) to the northern hemisphere temperature before (a, c) and after (b, d) the transition of annual-mean surface sensible heat flux trend in the Qinghai-Xizang Plateau from 1982 to 2018 |
7 大气环流背景场对高原感热趋势转折的可能影响
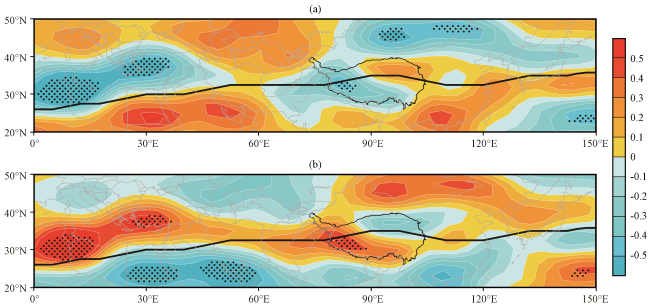
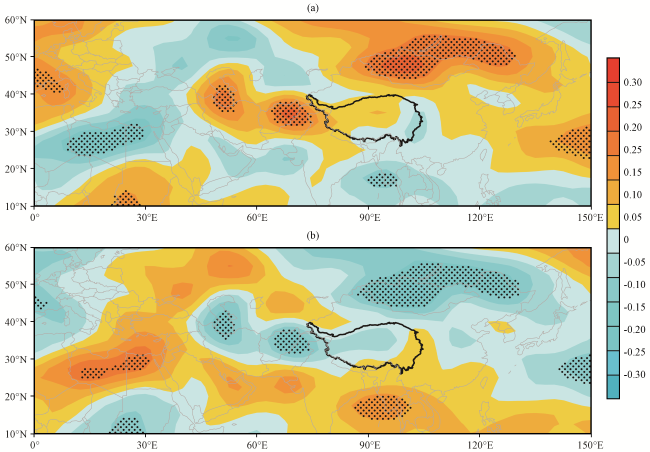
图8 1982 -2000年(a)与2000 -2018年(b)200 hPa纬向风距平场分布(单位: m·s-1)黑色粗实线为1982 -2018年西风急流轴平均位置, 打点区通过α=0.1的显著性水平t检验 Fig.8 Distribution of zonal wind anomaly at 200 hPa between 1982 -2000 (a) and 2000 -2018 (b).Unit: m·s-1.Black thick line is average westerly jet axis position and dotting area passes α=0.1 confidence level t test |