1 引言
2 资料选取和方法介绍
2.1 资料选取
2.2 方法介绍
3 降水日变化特征分析
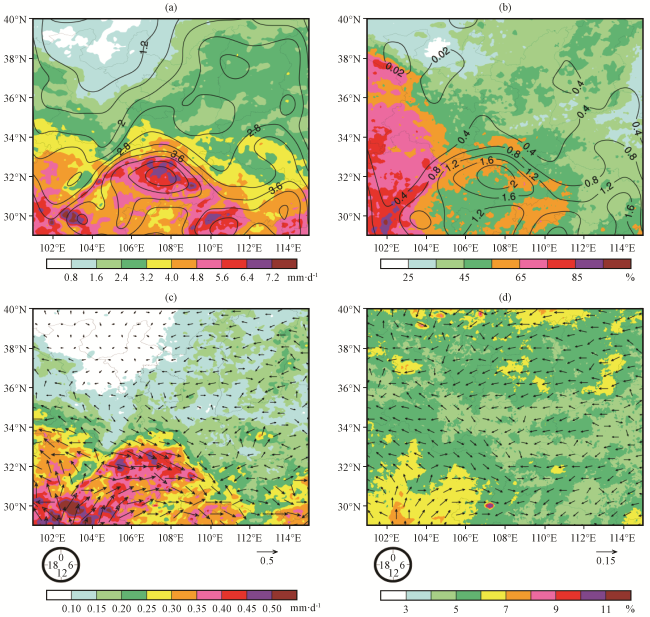
图2 秦岭周边暖季日均降水量(彩色区, 单位: mm·d-1)和标准差(等值线, 单位: mm·d-1)(a), 日降水量≥0.1 mm(彩色区)和>50.0 mm(等值线)的频率(b, 单位: %), PPA(彩色区, 单位: mm·h-1)及其出现时间(矢量)(c), PPF(彩色区, 单位: %)及其出现时间(矢量)(d)(c)、 (d)中箭矢表示峰值出现时间(表盘所示), 方向杆长度表示对应量值的大小 Fig.2 Spatial distribution of daily average precipitation (color area, unit: mm·d-1) and its standard deviation(contour, unit: mm·d-1) (a), the frequency of daily precipitation≥0.1 mm (color area) and >50.0 mm (contour) (b, unit: %), PPA (color area, unit: mm·h-1) and its occurrence time (vector) (c); PPF (color area, unit: %) and its occurrence time (vector) (d) in warm season in the surrounding areas of Qinling.The direction of the vector stands for phase (shown on the dial) of the maximum value, while the length of the vector stands for the magnietude in (c) and (d) |
表1 秦岭南部、 秦岭北部5 -9月降水量与降水频率、 降水强度日变化的相关系数Table 1 The correlation coefficient between daily average precipitation and frequency of precipitation and daily variation of precipitation intensity in southern and northern Qinling Mountains from May to September |
| 区域名称 | 要素 | 5月 | 6月 | 7月 | 8月 | 9月 |
|---|---|---|---|---|---|---|
| 秦岭南部 | 与降水频率的相关系数 | 0.69 | 0.48 | 0.41 | 0.56 | 0.54 |
| 与降水强度的相关系数 | 0.86 | 0.85 | 0.87 | 0.89 | 0.90 | |
| 秦岭北部 | 与降水频率的相关系数 | 0.47 | 0.52 | 0.42 | 0.41 | 0.51 |
| 与降水强度的相关系数 | 0.80 | 0.81 | 0.82 | 0.85 | 0.84 |
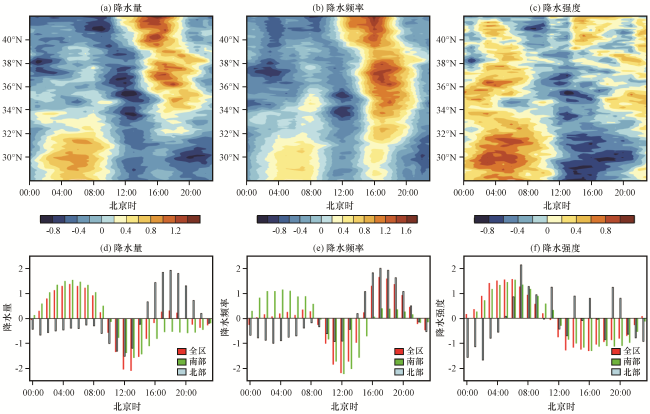
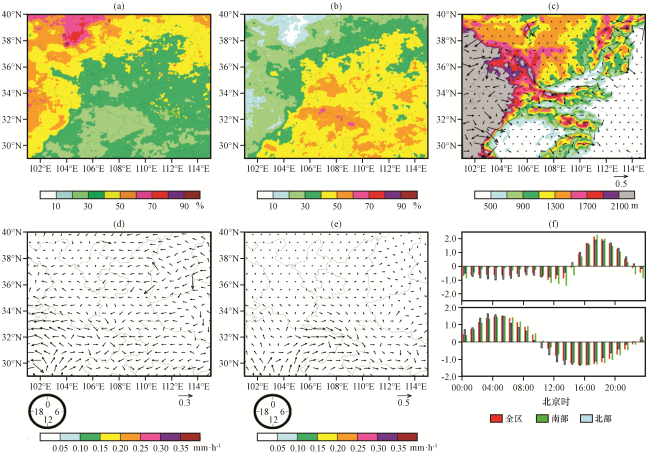
图4 短时(a)和长时(b)降水相对于总降水量贡献的空间分布, 秦岭及周边地区地形高度(填色, 单位: m)和风速的梯度(风矢, 单位: m·s-1)分布特征(c), 短时(d)和长时(e)降水日峰值和出现时间(箭矢表示峰值出现时间, 如表盘所示, 方向杆长度表示对应量值的大小)的空间分布, 短时(上)和长时(下)标准化降水量的日变化特征(f)Fig.4 Spatial distributions of the percentage contributions of short-duration (a) PA (SPA) and long-duration PA (LPA) (b) to total precipitation amount; the terrain height (shaded, unit: m) and gradient (vector, unit: m·s-1) of Qinling and surrounding areas (c); spatial distributions of diurnal peaks of the SPA (d) and LPA (e) and their occurrence time (arrows, the direction of the vector stands for phase of the maximum value, shown on the dial, while the length of the vector stands for the magnietude); diurnal variations of short (up) and long time (down) standardized precipitation (f) |
4 成因分析
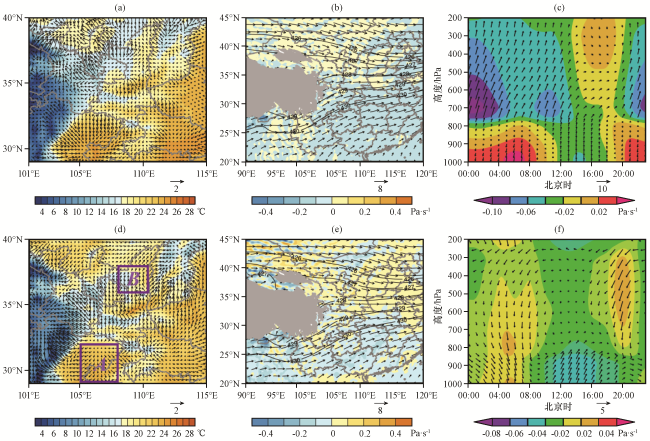
图6 气象要素的时空分布(a) 07:00温度(填色, 单位: ℃)和地面风(风矢, 单位: m·s-1), (b)07:00 600 hPa垂直速度(彩色区, 单位: Pa·s-1)、 位势高度(等值线, 单位: dagpm)和风场(风矢, 单位: m·s-1), (c)范围“A”内平均垂直速度(彩色区, 单位: Pa·s-1)、 经向风 (风矢, 单位: m·s-1)的时间剖面, (d)17:00温度 (彩色区, 单位: ℃)和地面风(风矢, 单位: m·s-1), (e)17:00 600 hPa垂直速度(彩色区, 单位: Pa·s-1)、 位势高度(等值线, 单位: dagpm)和风场(风矢, 单位: m·s-1), (f)范围“B”内平均垂直速度(彩色区, 单位: Pa·s-1)、 经向风 (风矢, 单位: m·s-1)的时间剖面。图(b)、 (e)中灰色阴影为地形 Fig.6 The spatial and temporal distributions of meteorological elements.(a) temperature (color area, unit: ℃) and the ground wind(vector, unit: m·s-1) at 07:00, (b) 600 hPa vertical velocity (color area, unit: Pa·s-1), geopotential height (isoline, unit: dagpm) and wind (vector, unit: m·s-1) at 07:00, (c) Average vertical velocities (color area, unit: Pa· s-1) and meridional winds time-height section (vectors, unit: m·s-1) of area“A”, (d) temperature (color area, unit: ℃) and the ground wind (vector, unit: m·s-1) at 17:00, (e) 600 hPa vertical velocity (color area, unit: Pa·s-1), geopotential height (isoline, unit: dagpm) and wind field (vector, unit: m·s-1) at 17:00, (f) average vertical velocities (color area, unit: Pa· s-1) and meridional winds time-height section (vector, unit: m·s-1) of area“B”, the gray shading is terrain in (b) and (e) |