

1 引言
2 资料选取和方法介绍
3 寒潮天气过程分析
3.1 寒潮冷堆增强过程简介
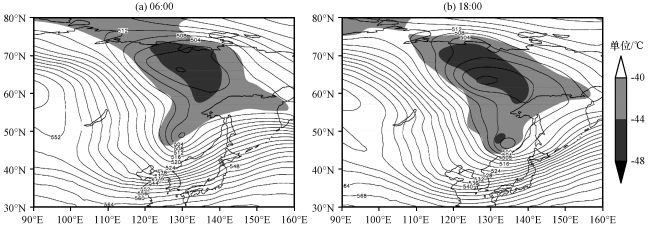
3.2 寒潮过程等熵位涡分析
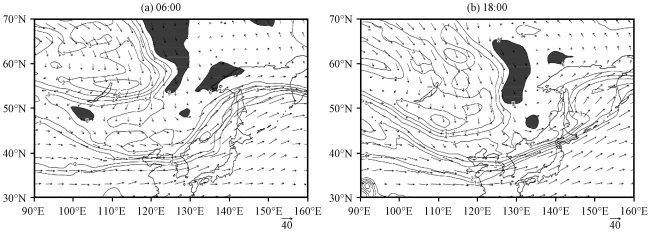
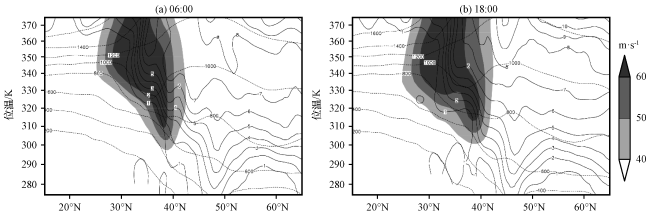
图3 2016年2月14日等位势高度线(虚线, 单位: dagpm)、 急流(阴影, 单位: m·s-1, 风速大于40 m·s-1)、等熵位涡(实线, 单位: PVU)沿132°E的纬度-等熵面剖面Fig.3 The latitude-isentropic surface cross section of geopotential height (dashed line, unit: dagpm), jet stream (the shaded, unit: m·s-1, larger than 40 m·s-1), and isentropic potential vorticity (solid line, unit: PVU) along 132°E on 14 February 2016 |
4 寒潮冷堆增强过程分析
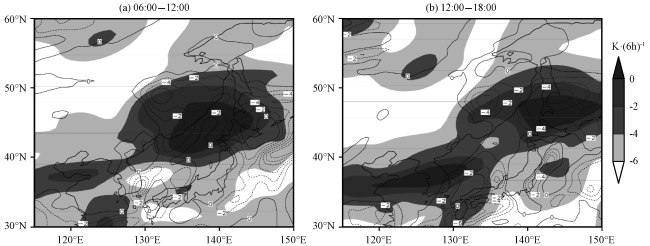
4.1 高空急流次级环流
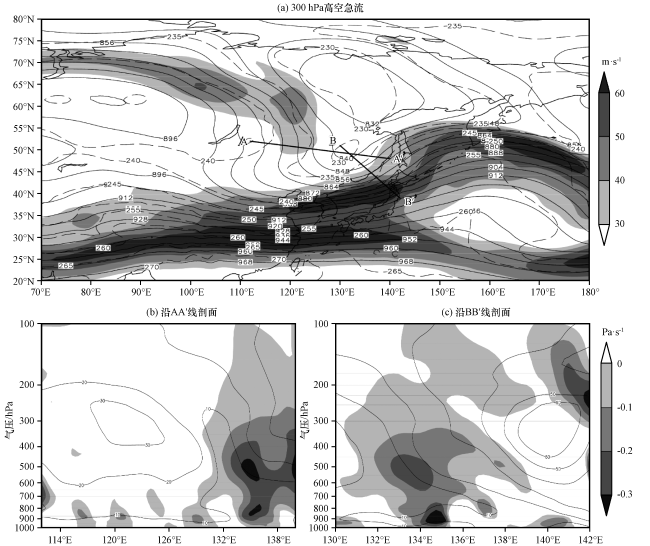
图5 2016年2月14日12:00 300 hPa高空急流(a, 阴影为急流风速, 单位: m·s-1, 等值线为位势高度, 单位: dagpm)和垂直剖面图[b, c, 阴影为垂直上升运动速度(单位: Pa·s-1), 等值线为等风速线(单位: m·s-1)]Fig.5 300 hPa upper jet (a, the shaded is wind speed, unit: m·s-1; isoline is geopotential height, unit: dagpm) and vertical section [b, c, the shaded is the vertical ascending velocity(unit: Pa·s-1), isoline is wind speed(unit: m·s-1)] at 12:00 on 14 February 2016 |
4.2 绝对涡度
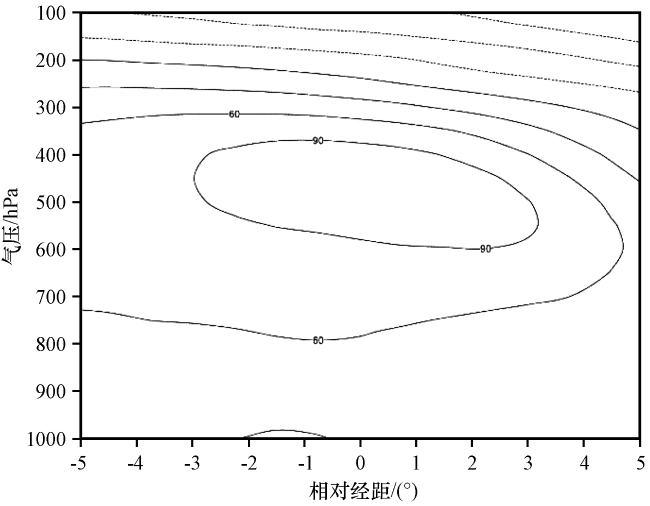


图8 2016年2月14日06:00 -18:00冷堆温度最低处气柱厚度变化[单位: gpm·(12h)-1]横坐标为0的位置为寒潮冷堆温度最低位置 Fig.8 Thickness change of air column at the lowest temperature of clod dome from 06:00 to 18:00 on 14 February 2016.Unit: gpm·(12h)-1.The position with abscissa of 0 is located in the lowest temperature of clod dome |