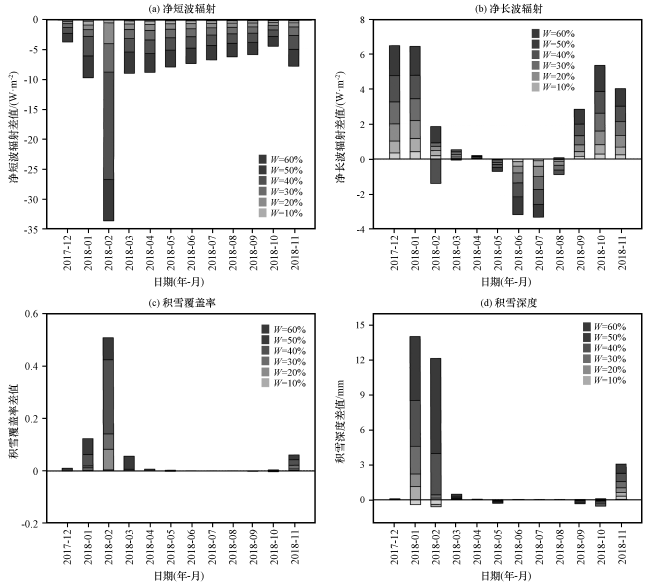
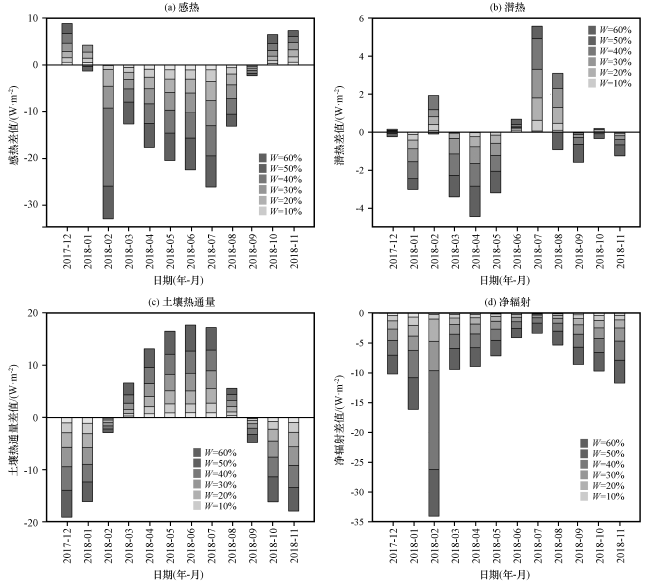
1 引言
2 模式及基础理论介绍
2.1 原模式及土壤水热参数化方案介绍
2.2 砾石对土壤水热参数影响的基础理论
3 台站及资料介绍
表1 玛多站土壤成分Table 1 Soil texture at Maduo site |
| 土层 | 深度/m | 沙土含量/% | 黏土含量/% | 砾石含量/% |
|---|---|---|---|---|
| 1 | 0.0175 | 30.2 | 30.0 | 5 |
| 2 | 0.0451 | 36.47 | 25.5 | 5.7 |
| 3 | 0.0906 | 51.09 | 14.03 | 18.14 |
| 4 | 0.1655 | 49.36 | 13.59 | 27.08 |
| 5 | 0.2891 | 59.05 | 9.42 | 26.37 |
| 6 | 0.4929 | 71.97 | 2.47 | 24.54 |
| 7 | 0.8289 | 64.06 | 1.82 | 33.07 |
| 8 | 1.3828 | 75.56 | 2.96 | 20.62 |
| 9 | 2.2961 | 72.99 | 3.2 | 22.73 |
| 10 | 3.8019 | 63.80 | 2.95 | 31.80 |
4 新方案适用性验证
4.1 土壤温度
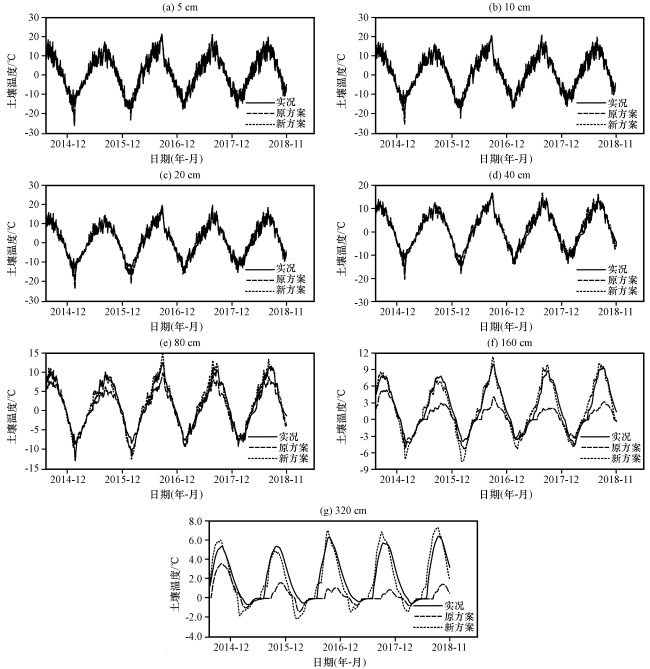
图1 2014年7月至2018年11月玛多站各层土壤温度原方案和新方案模拟数据与实况比较Fig.1 The simulation data from the original schemes and new schemes of soil temperature at each layer werecompared with the actual situation at Maduo Station from July 2014 to November 2018 |
表2 玛多站土壤温度原方案和新方案模拟数据与实况比较Table 2 The simulation data from the original schemes and new schemes of soil temperature are compared with the actual situation at Maduo Station |
| 统计量 | 方案 | 5 cm | 10 cm | 20 cm | 40 cm | 80 cm | 160 cm | 320 cm | 平均 |
|---|---|---|---|---|---|---|---|---|---|
| R | 原方案 | 0.966 | 0.974 | 0.977 | 0.976 | 0.970 | 0.916 | 0.676 | 0.922 |
| 新方案 | 0.968 | 0.977 | 0.982 | 0.983 | 0.982 | 0.970 | 0.938 | 0.971 | |
| MAE/℃ | 原方案 | 1.891 | 1.617 | 1.651 | 1.345 | 1.434 | 2.181 | 1.849 | 1.710 |
| 新方案 | 1.849 | 1.528 | 1.368 | 1.149 | 1.027 | 0.944 | 0.788 | 1.236 | |
| RMSE/℃ | 原方案 | 2.476 | 2.125 | 2.143 | 1.739 | 1.772 | 2.929 | 2.558 | 2.249 |
| 新方案 | 2.352 | 1.932 | 1.740 | 1.466 | 1.308 | 1.166 | 0.967 | 1.561 | |
| RSR | 原方案 | 0.277 | 0.244 | 0.276 | 0.237 | 0.311 | 0.713 | 1.113 | 0.453 |
| 新方案 | 0.263 | 0.222 | 0.224 | 0.200 | 0.230 | 0.284 | 0.420 | 0.263 |
4.2 土壤湿度
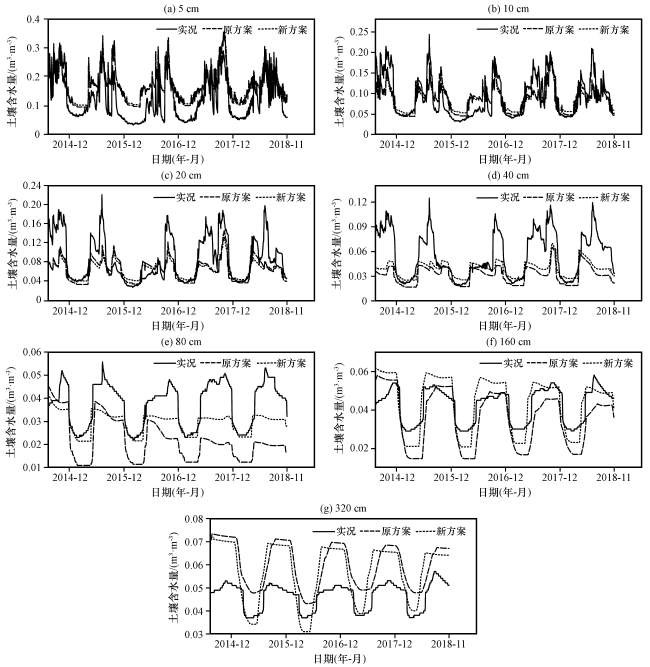
表3 玛多站土壤湿度原方案和新方案模拟数据与实况比较Table 3 The simulation data from the original schemes and new schemes of soil moisture are compared with the actual situation at Maduo Station |
| 统计量 | 方案 | 5 cm | 10 cm | 20 cm | 40 cm | 80 cm | 160 cm | 320 cm | 平均 |
|---|---|---|---|---|---|---|---|---|---|
| R | 原方案 | 0.834 | 0.811 | 0.760 | 0.705 | 0.656 | 0.870 | 0.843 | 0.783 |
| 新方案 | 0.830 | 0.816 | 0.774 | 0.701 | 0.793 | 0.874 | 0.841 | 0.804 | |
| MAE/(m3·m-3) | 原方案 | 0.053 | 0.023 | 0.028 | 0.024 | 0.016 | 0.009 | 0.013 | 0.024 |
| 新方案 | 0.056 | 0.026 | 0.029 | 0.020 | 0.008 | 0.007 | 0.012 | 0.022 | |
| RMSE/(m3·m-3) | 原方案 | 0.004 | 0.001 | 0.002 | 0.001 | 0.000 | 0.000 | 0.000 | 0.001 |
| 新方案 | 0.004 | 0.001 | 0.002 | 0.001 | 0.000 | 0.000 | 0.000 | 0.001 | |
| RSR | 原方案 | 0.824 | 0.618 | 0.836 | 1.167 | 1.801 | 1.132 | 2.486 | 1.266 |
| 新方案 | 0.858 | 0.646 | 0.867 | 0.999 | 1.055 | 0.844 | 2.295 | 1.081 |
5 不同砾石含量对土壤水热输送的影响
5.1 不同砾石含量对土壤水热参数的影响
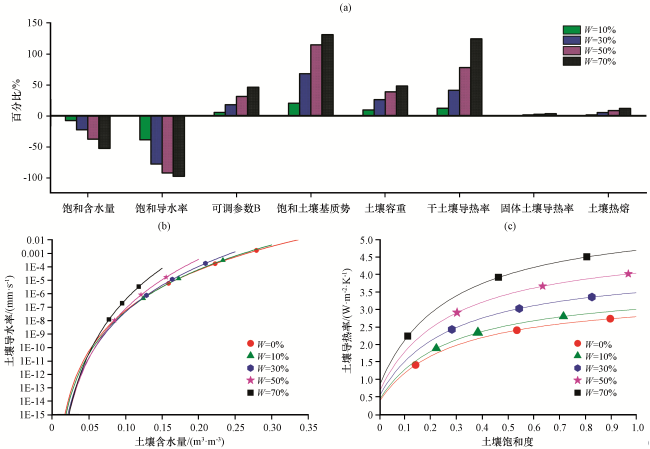
图3 不同砾石含量(W)下土壤各参数比较(a)以及土壤导水率与土壤含水量的关系(b)和土壤导热率与土壤饱和度的关系(c)Fig.3 Comparison of soil parameters under different gravel contents (a), relationship between soil water conductivity and soil water content (b), and the relationship between soil thermal conductivity and soil saturation (c) |
5.2 不同砾石含量对土壤水热输送的影响
表4 2017年12月至2018年11月玛多站新方案模拟的不同砾石含量下土壤水分循环相关因素值Table 4 Values of factors related to soil water cycle with different gravel contents are simulated by new schemes at Maduo Station from December 2017 to November 2018 |
| 砾石含量/% | 渗透 /(mm·d-1) | 地表蒸发 /(mm·d-1) | β因子 /(mm·d-1) | 树冠蒸发 /(mm·d-1) | 树冠蒸腾 /(mm·d-1) | 总水蓄 /(mm·d-1) | 水深/m |
|---|---|---|---|---|---|---|---|
| 0 | 0.0470 | 1.2340 | 0.2501 | 0.0267 | 0.1196 | 3623.5520 | 8.5101 |
| 10 | 0.0508 | 1.2308 | 0.2566 | 0.0268 | 0.1234 | 3635.1770 | 8.5995 |
| 20 | 0.0565 | 1.2266 | 0.2635 | 0.0269 | 0.1286 | 3649.1910 | 8.6485 |
| 30 | 0.0610 | 1.2206 | 0.2724 | 0.0270 | 0.1350 | 3663.7920 | 8.6552 |
| 40 | 0.0658 | 1.2127 | 0.2823 | 0.0272 | 0.1401 | 3677.1830 | 8.6033 |
| 50 | 0.0720 | 1.2053 | 0.2911 | 0.0273 | 0.1433 | 3690.6190 | 8.4390 |
| 60 | 0.0664 | 1.1935 | 0.2917 | 0.0276 | 0.1409 | 3707.9560 | 8.0401 |