

1 引言
2 RegCM模式砾石参数化方案
2.1 区域气候模式原始土壤水热参数化方案介绍
2.2 区域气候模式土壤砾石参数化方案发展
2.2.1 砾石对土壤基质势的影响
2.2.2 砾石对土壤孔隙度的影响
2.2.3 砾石对土壤饱和导水率的影响
2.2.5 砾石对干土壤导热率的影响
2.2.6 砾石对土壤容重的影响
2.2.7 砾石对土壤固态热容的影响
2.2.8 砾石对Kersten数的影响
2.3 区域气候模式砾石资料的建立
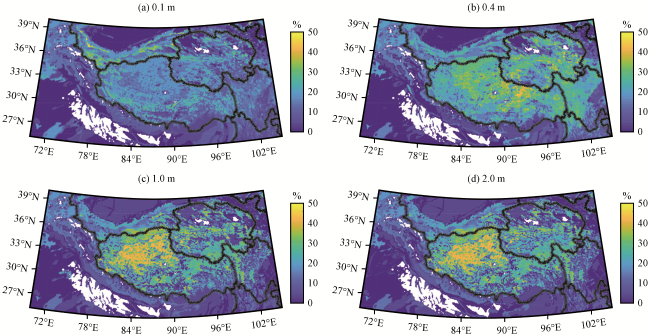
2.4 青藏高原砾石分布特征
3 实验方案、 数据来源和评估方法
3.1 实验参数设置
3.2 参照数据来源
3.3 评估方法
4 砾石参数化方案及其在青藏高原模拟效果评估
4.1 地表温度在高原区域模拟效果的评估
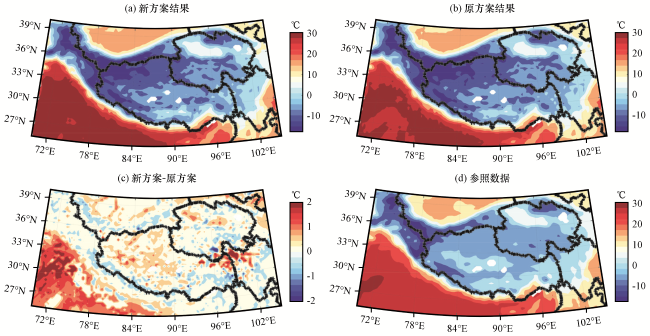
图2 两种方案在青藏高原区域对于地表温度模拟结果的差异Fig.2 Discrepancy between the simulation results of two schemes for the ground temperature over the Qinghai-Xizang Plateau |
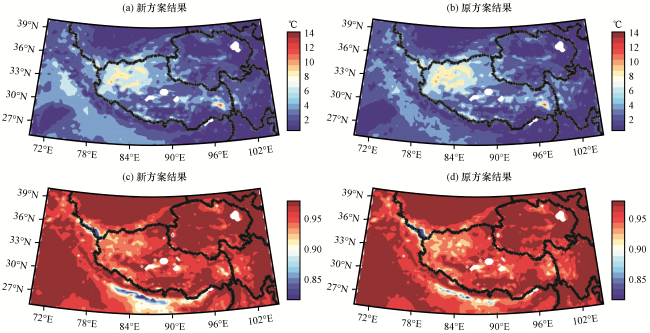
4.2 土壤温度在高原区域模拟效果的评估
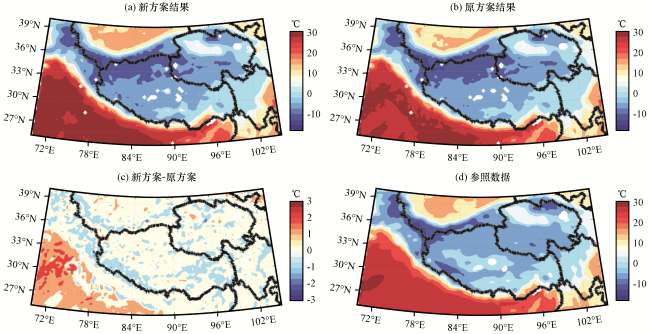
图4 两种方案在青藏高原区域对于浅层土壤温度模拟结果的差异Fig.4 Discrepancy between the simulation results of two schemes for the shallow soil temperature over the Qinghai-Xizang Plateau |
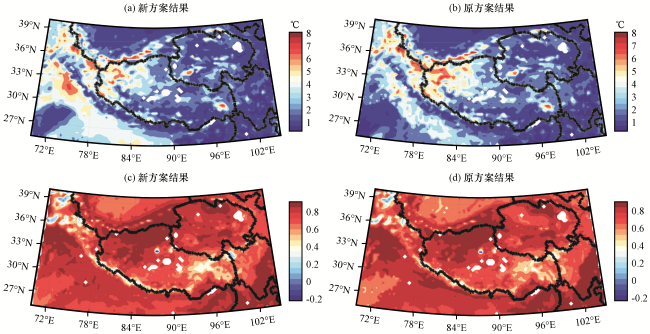
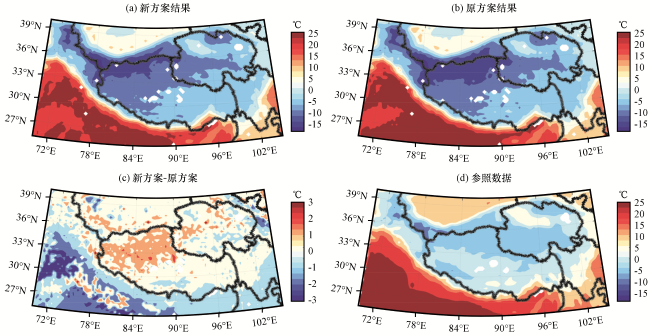
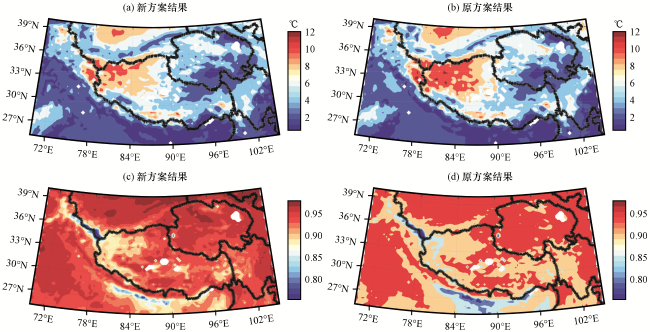
图6 两种方案在青藏高原区域对于深层土壤温度模拟结果的差异Fig.6 Discrepancy between the simulation results of two schemes for the deep soil temperature over the Qinghai-Xizang Plateau |
4.3 土壤体积含水量在高原区域模拟效果的评估
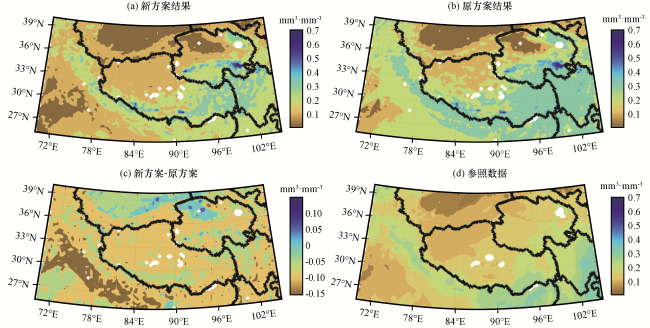
图8 两种方案在青藏高原区域对于浅层土壤体积含水量模拟结果的差异Fig.8 Discrepancy between the simulation results of two schemes for the shallow soil volumetric water content over the Qinghai-Xizang Plateau |
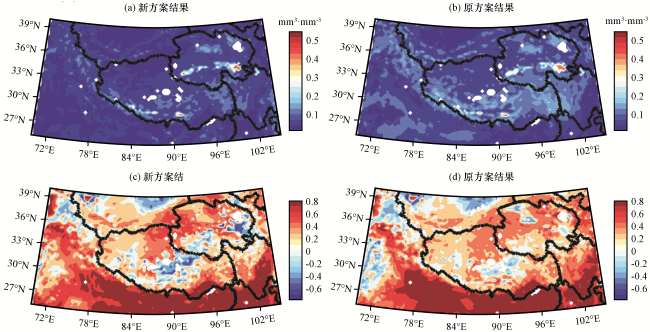
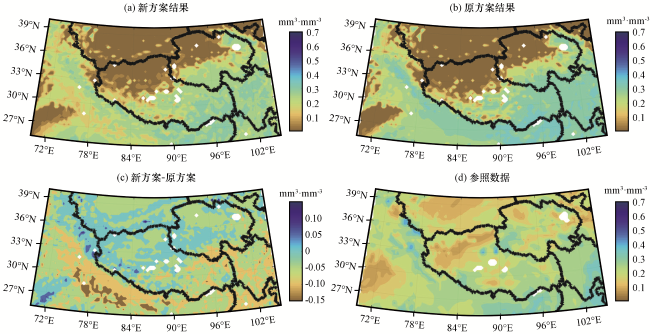
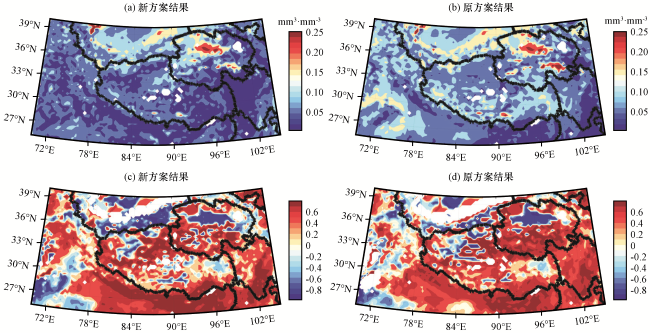
图10 两种方案在青藏高原区域对于深层土壤体积含水量模拟结果的差异Fig.10 Discrepancy between the simulation results of two schemes for the deep soil volumetric water content over the Qinghai-Xizang Plateau |
4.4 各变量的模拟差异随时间的变化情况
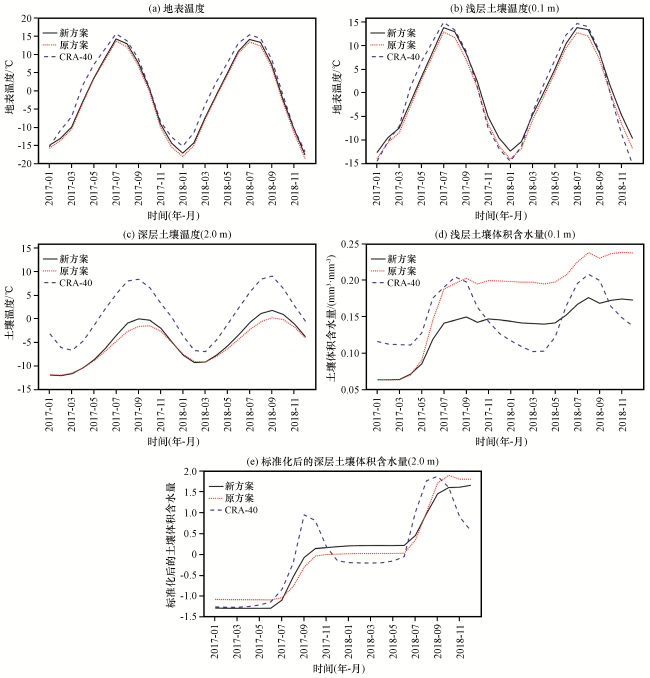


图12 各变量模拟值及参照数据的区域平均值的时间变化.图12(e)为标准化处理后的结果, 其值不代表真实数据, 仅为直观展示对比结果 Fig.12 Temporal variation of regional means with each variable and reference data.Fig.12(e) is the result after the standardization process, the value does not represent the real data, just to visualize the comparison results |
表1 两种方案模拟的地表、土壤温度与土壤含水量的检验结果Table 1 Validation of ground temperature, soil temperature and soil moisture simulated by the two schemes |
| 统计量 | 方案 | 地表温度 | 土壤温度 | 土壤体积含水量 | |||
|---|---|---|---|---|---|---|---|
| 浅层 | 深层 | 浅层 | 深层 | ||||
| MAE | 原方案 | 2.54 ℃ | 1.76 ℃ | 6.50 ℃ | 0.05 mm3·mm-3 | 0.13 mm3·mm-3 | |
| 新方案 | 1.87 ℃ | 1.74 ℃ | 5.86 ℃ | 0.03 mm3·mm-3 | 0.12 mm3·mm-3 | ||
| r | 原方案 | 0.99 | 0.99 | 0.91 | 0.49 | 0.85 | |
| 新方案 | 0.99 | 0.99 | 0.93 | 0.54 | 0.88 | ||