

1 引言
中国幅员辽阔、 地形复杂, 20世纪90年代以来, 由于全球气候变化带来了人口增长、 生态环境恶化等一系列问题。缺乏水资源是制约中国社会经济发展的关键因素之一(李兴宇等, 2008; 王浩等, 2012)。因此, 了解我国空中云水资源状况, 对于科学合理开发空中云水资源、 有效缓解水资源短缺、 改善生态环境、 保证社会经济的可持续发展具有重要的战略意义(刘菊菊等, 2018)。云水含量和水汽含量是空中水资源不可或缺的一部分, 其时空分布特征对于改善区域水资源有着重要的影响。
青藏高原(下称高原)是中国最大、 世界最高的高原, 被称为“世界屋脊”, 不仅是我国长江、 黄河的发源地, 也是亚洲许多大河流的发源地。自20世纪后半叶开始, 高原经历了快速升温的过程, 是最近几十年间全球升温最为显著的区域之一(Jones et al, 1986; Liu et al, 2000; Wang et al, 2012)。高原的水汽输送将影响我国中东部地区甚至整个亚洲的降水情况及水汽的汇合和输送情况, 故高原也被称为我国的“水汽输送中转站”(张新主, 2011)。因此, 有必要对高原的空中云水资源进行深入详细的研究。
国内外已有不少关于高原空中云水资源的研究成果。冯蕾等(2008)利用实测、 再分析资料和EOF分析得到了夏季高原降水的4种分布类型, 并分析了与4种降水分布类型相关的水汽输送及对应的环流背景。王霄等(2009)利用1948 -2007年共60年的NCEP/NCAR 再分析资料得到夏季高原上空是一个明显的“湿地”, 即是一个大气水汽含量高中心, 并总结了三条可进入高原的水汽通道。周长艳等(2009, 2012)对近几十年高原及周边地区的水汽分布、 源地、 水汽输送及其特征进行了相关研究并做了总结, 认为高原的水汽输送受季节影响严重。黄荣辉等(1998)分析了高原夏季降水与邻近地区水汽输送的相关关系, 表明东亚夏季风降水主要是由夏季风带来的水汽平流引起的。段玮等(2015)利用水汽气候诊断方法结合区域地形研究了高原东南侧区域的水汽分布、 输送和辐合辐散特征, 指出高原东南侧地形对水汽辐合辐散的影响具有复杂性和特殊性。徐祥德等(2002)研究夏季高原-季风水汽输送“大三角扇型”影响域特征, 得到大三角区域的水分时空演变、 遥相关特征等是认识中国及东亚旱、 涝异常成因的重要问题。王彬宇等(2014)利用NCEP/NCAR月平均再分析资料和多种分析方法, 对夏季高原各层水汽来源及水汽通量进行了研究, 得到高原的平均流输送与高原的水汽输送具有相同的分布特征, 并分析了夏季高原水汽输送的异常。随着卫星技术的不断发展, 李兴宇等(2008)对中国范围内空中云水资源的分布特征和变化趋势等进行分析指出, 全国平均云水路径(CWP)最高值在6月, 最低值在10月。随着纬度的变化云水含量差异明显, 云水资源在全球变暖背景下呈逐渐增加的趋势。杨大生等(2012)研究表明高原地形和东亚夏季风对月平均云含水量分布有显著影响, 月平均液态水含量分布不均匀, 中纬度中部地区的量值大于南北部地区。刘朝顺等(2006)检验了云液态水总量和水汽之间在降水前后的关系, 对大气水汽总量和云液态水含量的季节分布特征和日变化差异做了分析。
虽然对高原的水汽来源、 分布及其输送和与降水的关系已经做了很多的研究, 但多采用NCEP/NCAR月平均再分析资料。对于云水资源的时空特征研究, 多是基于相对成熟的卫星资料, 如ISCCP和CloudSat数据资料(李兴宇等, 2008; 杨大生等, 2012; 蔡淼, 2013; 杨冰韵等, 2018)。鉴于ERA-Interim再分析资料具有时间尺度更长、 空间分辨率更高、 更均一化的特征, 本文采用1979 -2016年逐月ERA-Interim月平均再分析资料对夏季高原空中水资源的时空特征进行深入分析, 为高原地区水资源的开发和合理利用提供一定的参考。
2 资料来源和研究方法
所用的再分析资料是欧洲天气预报中心(ECMWF)提供的一套高分辨率ERA-Interim再分析资料, 该资料充分利用四维同化系统提高了资料精度, 近几年ERA-Interim数值预报产品的性能已得到普遍认可(潘留杰等, 2013; 白磊等, 2013; 石晓兰等, 2016), 也被用于研究高原及其周围地区夏季水汽输送情况(谢欣汝等, 2018)和云水含量分布情况(刘菊菊等, 2019)。
鉴于本文主要关注高原云水资源, 故选取1979 -2016年逐月平均0.75°×0.75°的ERA-Interim整层大气水汽含量、 东西向水汽输送通量、 南北向水汽输送通量、 水汽输送通量散度、 云液水、 云冰水、 总云量以及高、 中、 低云量等数据。
整层大气水汽含量公式:
东西向水汽输送通量公式:
南北向水汽输送通量公式:
水汽输送通量散度公式:
式中: g为重力加速度; q为各层大气比湿; V为各层大气风速; u为东西风分量; v为南北风分量; pt为积分上界气压, 取为模式顶气压(1 hPa); ps为积分下界气压, 取地面气压。
高原地形轮廓资料来自国家科技基础条件平台-国家地球系统科学数据共享服务平台提供的高原范围与界线数据。另外, 根据高原轮廓线选取27°N -37°N, 76°E -104°E区域作为高原区域范围。
同时, 采用了经验正交函数(EOF)分解和相关分析方法对夏季高原空中云水资源状况进行了分析。EOF分解方法能够把随时间变化的要素场分解为空间函数部分和时间函数两个部分, 是气象上多变量分析中常用方法之一(黄嘉佑, 2016)。相关分析是对两个变量关联性的分析方法, 是天气和气候变化过程成因分析常使用的重要方法(黄嘉佑, 2016)。
3 高原水汽含量的分布特征
3.1 水汽含量的空间分布
从1979 -2016年夏季平均高原整层大气水汽含量分布和整层大气水汽含量变化趋势(图1)可以看出, 夏季高原水汽含量大致呈由东南向西北递减分布[图1(a)], 高原东南部水汽含量最大, 最高可达25 kg·m-2, 中心主要在藏南谷地和横断山脉一带; 高原西北部水汽含量较少, 不超过10 kg·m-2, 柴达木盆地、 祁连山地和青海高原的水汽含量都较低, 在8 kg·m-2以下。为进一步了解高原各层水汽状况, 分别选取600~500 hPa、 500~300 hPa 两个层次计算了水汽含量, 发现这两层高原水汽含量的空间分布形势基本一致, 水汽大值中心均在高原南部, 但500~300 hPa水汽含量明显比600~500 hPa水汽含量偏小, 500~300 hPa水汽含量最大中心仅为5~6 kg·m-2。
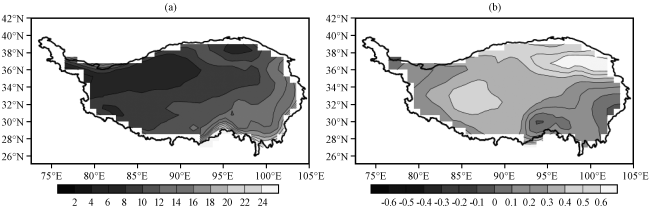
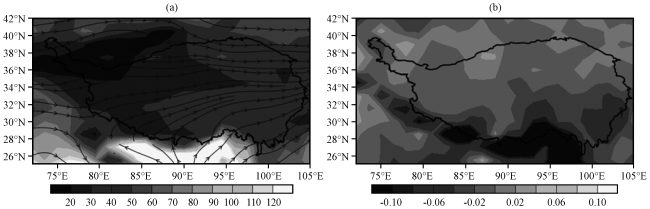
图2 1979 -2016年夏季平均高原整层水汽通量(a, 阴影区表示水汽通量的大小, 流线表示水汽通量的途径, 单位: kg·m-1·s-1)和水汽通量散度(b, 单位: ×10-6 g·m-2·s-1)分布Fig.2 Distribution of water vapor flux (a, the shaded area indicates the water vapor flux, and the stream line indicates the road of water vapor transport, unit: kg·m-1·s-1) and the divergence of water vapor flux (b, unit: ×10-6 g·m-2·s-1) over the Qinghai-Xizang Plateau in summer from 1979 to 2016 |
从图2(a)还可以看出, 夏季整个高原的水汽通量都为正值, 喜马拉雅山边界、 柴达木盆地附近和祁连山边界为水汽通量大值区, 高原东部地区为次大值区, 而昆仑山靠近塔里木盆地附近水汽通量值最小, 西部部分地区及西北部地区为次小值区; 也就是说, 夏季高原东部地区的水汽输送要强于高原西部地区。藏北高原的整层水汽通量较小, 大部分地区都在30 kg·m-1·s-1以下, 水汽输送较弱, 对水汽的转运能力更弱; 藏南谷地的整层水汽通量较大, 最高可达50 kg·m-1·s-1, 水汽输送最强; 柴达木盆地和祁连山地的整层水汽通量也较大, 在30~50 kg·m-1·s-1, 水汽输送能力也较强。川藏高山峡谷区的整层水汽通量梯度也较大, 在10~50 kg·m-1·s-1。
从夏季高原及周边地区整层水汽通量散度分布[图2(b)]可以看出, 夏季整个高原绝大部分地区的整层水汽通量散度为负值, 为水汽辐合区, 净获得水汽, 特别是高原南侧存在连片的水汽辐合区, 最大值可达-0.10×10⁻⁶ g·m-2·s-1以上; 而高原北边界及周边地区的整层水汽通量散度都为正值, 为水汽辐散区, 净失去水汽。可见, 夏季高原地区水汽通量由南到北逐渐由水汽辐合转变为水汽辐散, 这与夏季高原整层水汽通量[图2(a)]是对应的, 夏季西南季风将来自孟加拉湾的水汽输送到高原南侧, 引起高原南部的水汽通量辐合, 而高原中、 北部水汽输送弱于高原南部, 所以高原中北部特别是塔里木盆地地区的水汽通量散度多为负值, 呈弱辐合。
总体而言, 高原南部为获得水汽的地区, 且向北走获得的水汽逐渐减少, 这其实是西风带输送的水汽和孟加拉湾北上的水汽在高原南部汇合, 水汽辐合带主要位于喜马拉雅山-雅鲁藏布江一带; 而高原北部获得的水汽很少, 一方面是由于高原北侧多为干旱地区, 水汽匮乏, 另一方面是因为由孟加拉湾北上的水汽受高原的巨大地形作用而发生了绕流, 这与Wu et al(2012)给出的南亚夏季季风基本结构示意图中显示的高原地区的水汽输送相一致。
为了深入分析夏季高原水汽输送的时空变化特征, 对夏季高原多年平均的水汽场进行了EOF分解(图3), 第1模态(EOF1)和第2模态(EOF2)解释的方差分别为58.3%和15.8%, 两者之和接近75%, 而且两个空间模态型都通过了North检验, 说明前两个模态能够代表夏季高原水汽输送的主要分布类型, 因此下面仅分析EOF前两个特征向量。
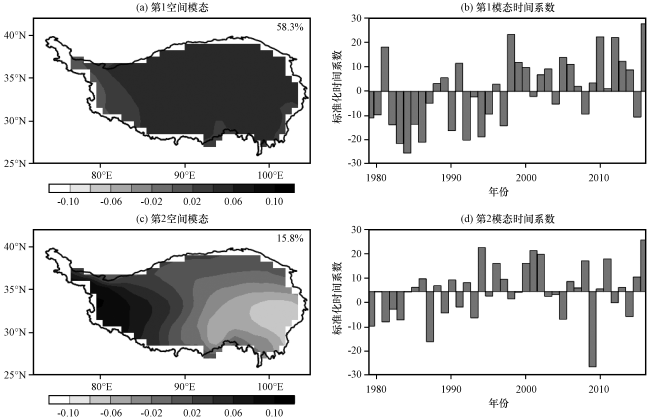
进一步对夏季高原地区水汽通量散度进行EOF分解(图略), 得到第一特征向量(解释方差为22.5%, 通过North检验)的空间分布表现为高原大部分地区水汽辐散, 第二特征向量(解释方差为13.1%, 未通过North检验)的空间分布也表现为以90°E为界的东西不一致, 正好与高原水汽含量的EOF分解前两模态分布型相似。而夏季高原地区整层水汽通量的EOF分解与前两者存在差异, 相同之处是第一特征向量(解释方差49.3%, 通过North检验)的空间分布也呈区一致的水汽通量负值, 即失去水汽, 但第二特征向量(解释方差24.0%, 通过North检验)的空间分布则以南北向不一致为主, 其第三特征向量(解释方差13.1%, 未通过North检验)的空间分布表现出东西向不一致型。
进一步分析高原四个边界的水汽通量收支可知, 东西边界均为向东的水汽输送通量, 且西边界水汽输入量要高于东边界的水汽输出量, 这与夏季大尺度西风带的水汽输送有关; 南北边界均为向北的水汽输送通量, 且南边界水汽通量是北边界的8~10倍, 就绝对值而言, 南边界是四个边界中量值最大的, 这也与上述分析是一致, 高原南部整层水汽含量最高, 存在连片的水汽通量辐合, 并且西南季风将孟加拉湾的暖湿水汽带到高原南部, 因此高原南边界水汽通量收支较其他边界更大。
表1 1979 -2016年夏季高原整层水汽的四种空间分布类型Table 1 Four spatial distribution types of total column water vapor over the Qinghai-Xizang Plateau in summer from 1979 to 2016 |
| 类型 | 个数/个 | 年份 |
|---|---|---|
| 全区偏多型 | 13 | 1981, 1991, 1998, 1999, 2000, 2003, 2005, 2006, 2010, 2012, 2013, 2014, 2016 |
| 全区偏少型 | 12 | 1979, 1982, 1983, 1984, 1985, 1986, 1990, 1992, 1994, 1995, 1997, 2015 |
| 西多东少型 | 4 | 1996, 2001, 2002, 2011 |
| 西少东多型 | 3 | 1987, 1993, 2009 |
进一步分析上面得到的四种空间分布类型对应年份的夏季高原水汽通量的合成分布可知, 四种空间分布类型的高原水汽通量分布与分型结果一致, 表明这四种空间分布类型是夏季高原水汽含量的主要分布型。这与周顺武等(2011)的研究结果基本一致。
选取夏季高原地区整层水汽含量的典型全区偏多型(1981, 1998, 2010, 2012和2016年)和典型全区偏少型(1983, 1984, 1986, 1992和1994年)进行合成分析(图略)表明, 高原中东部是水汽含量差异较大地区, 最大差值中心位于柴达木盆地及其以东地区, 这与柴达木盆地附近的水汽含量气候倾向变化最大相一致。
3.2 水汽含量的时间演变
对高原地区整层大气水汽含量进行区域平均, 选取前面给出的高原主体区域计算多年平均夏季整层大气水汽含量的时间变化和南北向、 东西向的水汽收入及区域水汽净收入的变化(图4)。从图4可以看出, 1979 -2016年高原区域整层大气水汽含量在9.6~12.2 kg·m-2之间, 特别是1998年和2016年出现了12 kg·m-2以上的峰值, 而且整层大气水汽含量呈增加趋势, 平均增加率为0.3 kg·m-2·(10a)-1, 与图1(b)高原大部分地区整层大气水汽含量增加趋势相一致。周长艳等(2009)也指出20世纪90年代至2001年是高原东部及邻近地区大气可降水量偏多的时段, 但限于数据时段仅到2001年, 得到1958 -2001年高原东部及邻近地区夏季大气可降水量呈减少趋势的结论。
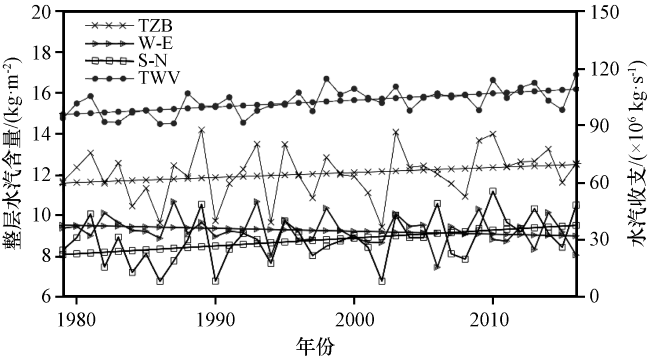
图4 1979 -2016年夏季高原地区区域平均整层大气水汽含量(TWV)、 南北向水汽净收入(S -N)、 东西向水汽净收入(W -E)以及区域水汽净收入(TZB)的时间演变Fig.4 Time evolution of total column water vapor (TWV), meridional net water vapor budget (S-N), zonal net water vapor budget (W-E) and regional net water vapor budget (TZB) on the whole layer over the Qinghai-Xizang Plateau in summer from 1979 to 2016 |
从图4还可以看出, 夏季高原区域南北向水汽收入呈增加趋势, 增加率为0.75×10⁵ kg·s-1·(10a)-1, 东西向水汽收入呈减少趋势, 减少率为-0.5×10⁵ kg·s-1·(10a)-1, 而整个区域水汽净收入在140×106 ~270×106 kg·s-1之间波动, 呈0.1×10⁵ kg·s-1·(10a)-1的弱增加趋势。进一步分析高原区域四个边界的水汽收入情况可知, 高原东边界水汽输出量大于西边界水汽输入量, 两者变化趋势不明显, 这与整个区域东西向水汽净收入呈减少趋势相一致; 高原南边界水汽输入量较大, 平均约为10×106 kg·s-1, 整体变化趋势是减少的, 北边界由北向南的水汽输送也呈减少趋势, 那么高原区域的南北向水汽收入的增加很有可能是高原上整层大气水汽含量的增加造成了南北向输送的增加, 还有待进一步的研究验证。
对高原区域整层大气水汽含量分别与南北向、 东西向水汽收入进行相关分析(图略), 结果表明高原区域整层大气水汽含量与南北向水汽收入有显著的正相关关系, 通过了0.01显著性检验, 表明夏季高原整层大气水汽含量受南北向水汽通量输送的影响更大, 而整层水汽含量的增加可能与整层云水含量的增加有关。
4 高原云水含量的分布特征
4.1 云水含量的空间分布
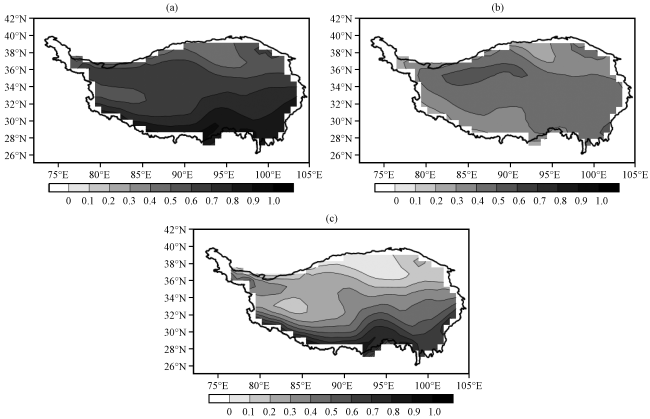
对高原地区整层气柱中水汽含量和水汽通量进行分析后, 下面进一步分析高原地区云中的水资源状况。从1979 -2016年夏季高原总云量、 中云量和低云量的空间分布(图5)可以看出, 受高大地形的影响, 除了高原西部阿里山地和羌塘高寒地区外, 夏季高原总云量呈明显的南多北少分布, 其中高原南部为云量大值区, 高原中部云量也较多, 低值区存在于高原北部柴达木盆地附近地区[图5(a)]; 夏季中云[图5(b)]云量大值区大体上呈西北至东南的走向, 整体云量均在5成以下; 夏季低云[图5(c)]的云量大值区也主要分布在高原南部一带, 从高原中部地区往北云量逐渐减少, 在柴达木盆地地区形成最小值区, 总体呈现出由南至北逐级递减。由图5还可以看出, 夏季高原云量的整体分布与中低云都有密切的关系, 大值区和小值区基本无明显变化, 说明夏季高原上的云主要为中低云, 值得注意的是, 高原南部地区夏季云量主要以低云为主。
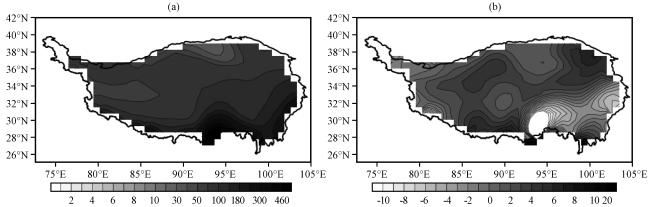
云水含量包括云液水含量和云冰水含量两部分, 云水含量在不同季节分布情况具有明显差异。图6给出了1979 -2016年夏季平均高原地区的云水含量的空间分布。从图6(a)可以看出, 夏季云水含量的大值区在高原偏南地区, 位于藏南至喜马拉雅山南翼和高原东南部一带, 峰值为460 g·m-2左右, 与高原地区的中低云量大值区相对应。由对应的云水含量变化趋势[图6(b)]可知, 夏季高原大部分地区云水含量均在增加, 特别是高原南部喜马拉雅山地区存在一个云水增加的大值中心, 中心值在6 g·m-2·(10a)-1左右, 柴达木盆地东部也有一个中心值可达7 g·m-2·(10a)-1以上的大值区。值得注意的是, 图6(a)中云水含量大值的区域的云水含量变化趋势是减小的, 甚至出现了-10 g·m-2·(10a)-1左右的减小率。也就是说, 高原地区云水含量的增加区域主要是藏北高原, 而藏东南谷地减少趋势明显。
从高原地区夏季云液水、 云冰水的分布(图略)可看出, 与云水含量的分布比较接近, 两者的大值区都位于藏南至喜马拉雅山南部和高原东南部一带; 云冰水量值明显小于云液水量值, 云冰水含量的变化趋势也较云液水偏弱, 而云液水与云水含量的变化趋势基本一致。
从季节来看, 夏季云水含量均要比冬季大; 从地理位置来看, 高原南部云水液量大于云冰水含量, 北部云冰水含量大于云液水含量; 总体呈南多北少、 东多西少分布; 而且变化趋势三者基本也是一致的, 在高原大部分地区呈增加趋势, 高原东南部分地区呈减少趋势。
4.2 云水含量的时间演变
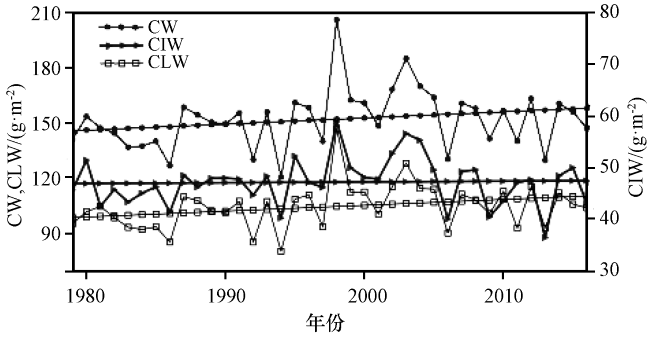
从高原区域平均的整层云水含量和云液水、 云冰水的年际变化(图7)可以看出, 云水含量、 云液水含量和云冰水含量的年际变化整体趋势比较接近, 三者的两两相关系数在0.50~0.92, 均通过了0.01的显著性检验, 同时, 云水含量与云液水含量的变化趋势更为接近, 增加率在1.9 g·m-2·(10a)-1以上。其中1998年为高原区域总云水含量较高的年份, 该年云液水和云水含量也都保持较高的状态, 说明该年份高原降水可能较往年多一点, 也对应高原水汽含量和水汽输送大值, 进一步表明该年高原区域水汽偏多; 而1994年高原区域的总云水含量、 云液水含量和云冰水含量都相对较低, 有可能影响降水, 相比于常年可能较为干旱, EOF分析的结果一致, 下面将进一步分析这两年夏季高原区域云水资源状况。


5 结论和讨论
利用1979 -2016年ERA-Interim再分析月平均资料分析了夏季高原空中水资源的时空特征分布得出了如下结论:
(1) 夏季高原的整层水汽含量呈由东南向西北递减, 数值范围在2~25 kg·m-2之间, 水汽含量大值集中在藏南谷地和横断山脉地区, 而柴达木盆地的水汽含量最少; 1979 -2016年夏季高原整层水汽含量呈增加趋势, 增加率可达0.8 kg·m-2·(10a)-1以上。
(2) 夏季高原的整层水汽通量都为正值, 整体的输送主要以向东输送为主, 南部来自孟加拉湾的水汽由于高原巨大的地形阻挡作用而发生了绕流, 由原来的西南风输送转为了西风输送。
(3) 从夏季高原的整层水汽通量散度可知, 高原绝大部分地区为弱辐合区, 净获得水汽, 只有北边界和西边界的小部分地区为辐散区, 净失去水汽; 这是因为孟加拉湾北上的水汽在高原中南部与西风输送来的水汽辐合, 而后因为高原的地形作用, 使孟加拉湾北上的水汽发生绕流, 到达高原中北部的水汽较少, 又受到强西风输送的水汽影响, 两者在中南部汇合后一起向东输送。这样一来, 高原的中南部就是一个显著的水汽辐合区。
(4) 对夏季高原整层水汽含量进行EOF分析得到, 四个夏季高原整层水汽含量的主要空间分布类型: 全区偏多型、 全区偏少型、 西多东少型、 西少东多型。
(5) 夏季高原地区云量主要以中低云为主。整层云水含量、 云液水含量和云冰水含量大值区都主要集中在喜马拉雅山南翼和高原东南部地区; 南部云液水含量显著高于云冰水含量, 北部反之。从云水含量的季节性变化知, 夏季云水含量总体要比冬季大, 且大值范围主要以高原南部为主, 其余地区云水含量整体偏低。整层云水含量的变化趋势基本一致, 在高原大部分地区呈增加趋势, 东南部分地区呈减少趋势。
(6) 1979 -2016年夏季高原区域平均的整层水汽含量随时间呈波动变化, 有明显的增加趋势, 增加率为0.3 kg·m-2·(10a)-1; 南北向水汽收入呈增加趋势, 增加率为0.75×10⁵ kg·s-1·(10a)-1; 东西向水汽收入呈减少趋势, 减少率为-0.5×10⁵ kg·s-1·(10a)-1; 高原区域水汽净收入呈波动变化, 基本维持稳定。同时, 整层云水含量、 云液水含量和云冰水含量随时间逐渐增加, 前两者增加率在1.9 g·m-2·(10a)-1以上。
在全球变暖背景下, 青藏高原的气候变化一直备受关注, 特别是作为“亚洲水塔”, 高原水资源研究具有重要意义。本文重点关注1979 -2016年夏季高原地区水汽含量、 水汽通量、 水汽通量散度、 云水含量的时空特征分布和变化趋势, 而对高原地区的水汽含量增加、 水汽通量减少的原因及它们之间的相互作用未进行深入探讨; 仅分析了高原地区经向和纬向水汽通量输送, 高原地区对我国中东部地区和西北地区的水汽输送及降水的影响, 以及云水含量与季风的关系及分布特征等还需要进一步的研究。