1 引言
2 资料来源和方法介绍
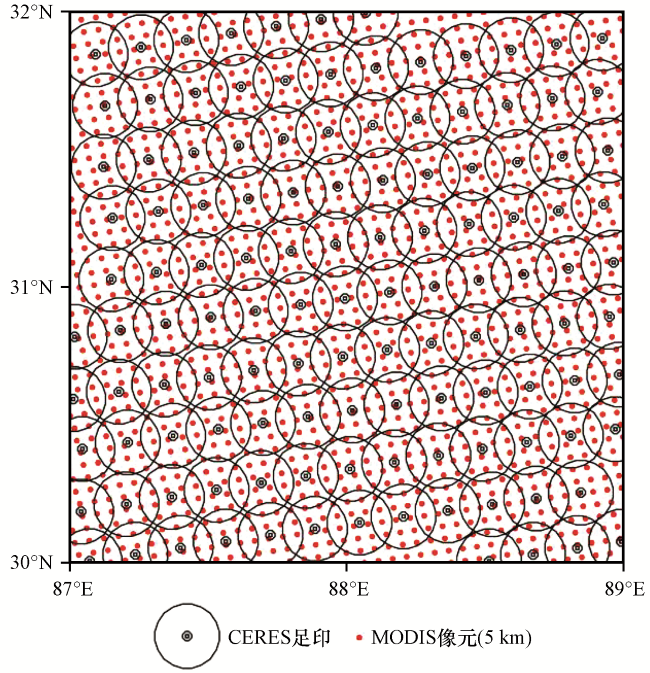
图1 CERES与MODIS的像元分布示意图Fig.1 Schematic diagram of pixel distribution of CERES and MODIS |
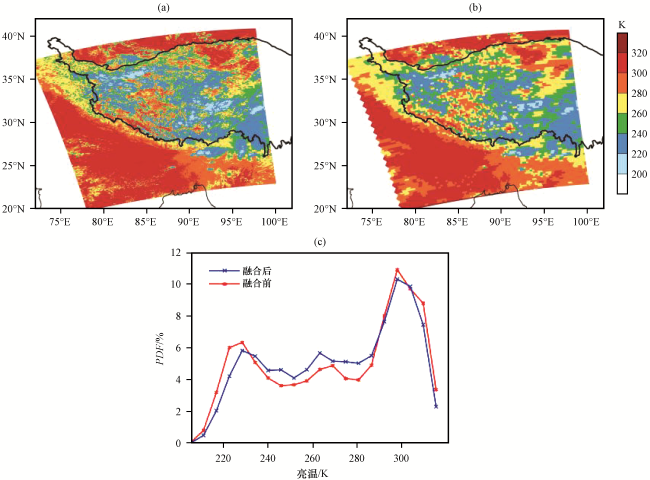
图2 多云个例的MODIS 31通道亮温分布(a)、 CERES像元内多个MODIS像元数据的加权平均融合后的亮温分布(b)及融合前、 后亮温的概率分布函数(c)(a)和(b)中黑色实线范围为高于3000 m等高线的青藏高原区域 Fig.2 The brightness temperature distribution of MODIS 31th channel for cloudy case (a) and the merged brightness temperature distribution for cloudy case (b).The probability distribution function (PDF) of brightness temperature before merge and after merge.The black line in (a) and (b) represent the Qinghai-Xizang Plateau which altitude is higher than 3000 m |
3 结果分析
3.1 多云和少云个例的天气形势
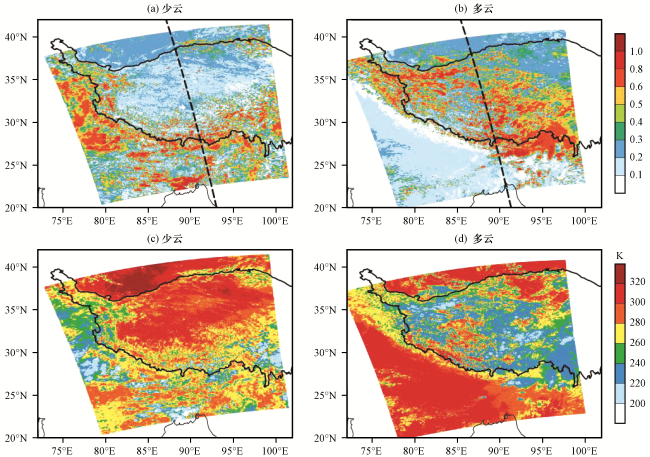
图3 少云和多云个例的MODIS可见光通道反射率(a, b)与热红外通道辐射亮温(c, d)分布(a)和(b)中的虚线代表Cloudsat卫星星下点的轨迹 Fig.3 The distribution of the visible reflectance (a, b) and infrared brightness temperature (c, d) detected by MODIS for cloudless case and cloudy case.The dotted line in (a) and (b) represents the nadir track of the CloudSat |
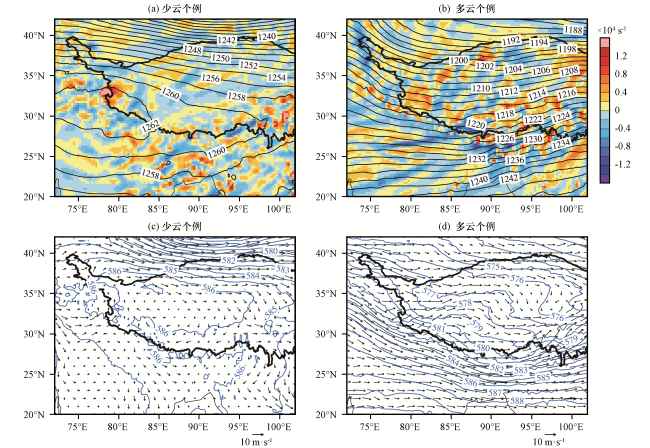
图4 少云个例和多云个例的200 hPa位势高度(等值线, 单位: gpm)和散度(彩色区, 单位: ×104 s-1) (a, b)以及500 hPa位势高度(等值线, 单位: gpm)和风场(矢量, 单位: m·s-1)分布(c, d)Fig.4 200 hPa geopotential height (contour line, unit: gpm) overlapped with divergence (color area, unit: ×104 s-1) and 500 hPa geopotential height (contour line, unit: gpm) overlapped with wind vector (vector, unit: m·s-1) for the cloudless case (a, c) and the cloudy case (b, d) |
3.2 云参数及辐射
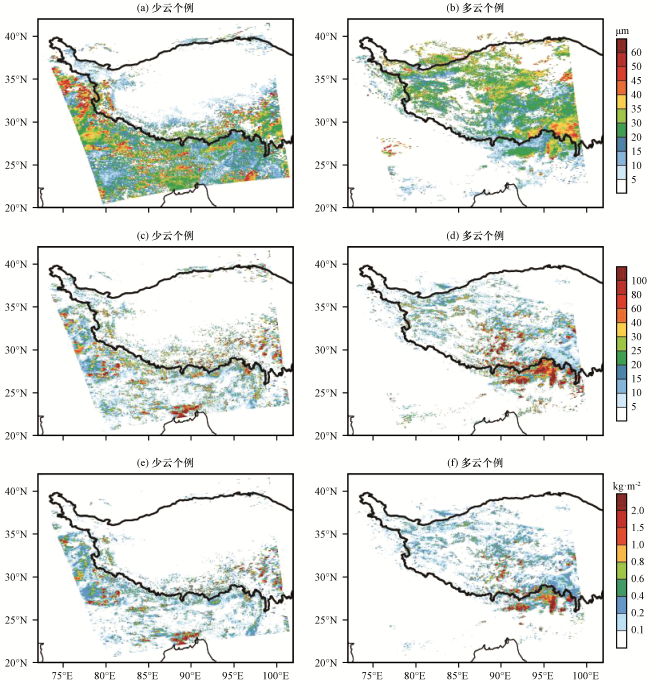
图5 MODIS云参数给出的少云个例和多云个例的云粒子有效半径(a, b)、 云光学厚度(c, d)和云水路径分布(e, f)Fig.5 The distribution of cloud droplet effective radius (a, b), cloud optical depth (c, d) and cloud liquid water path (e, f) issued from the MODIS cloud parameters for the cloudless case and the cloudy case |
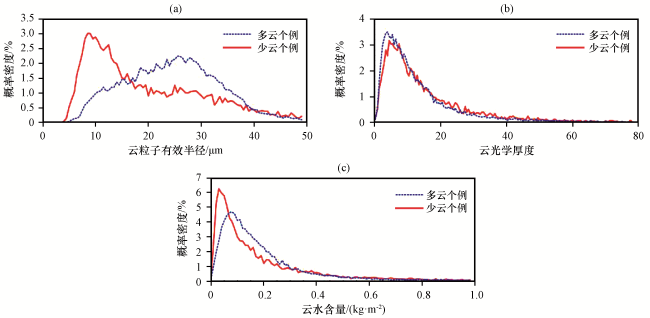
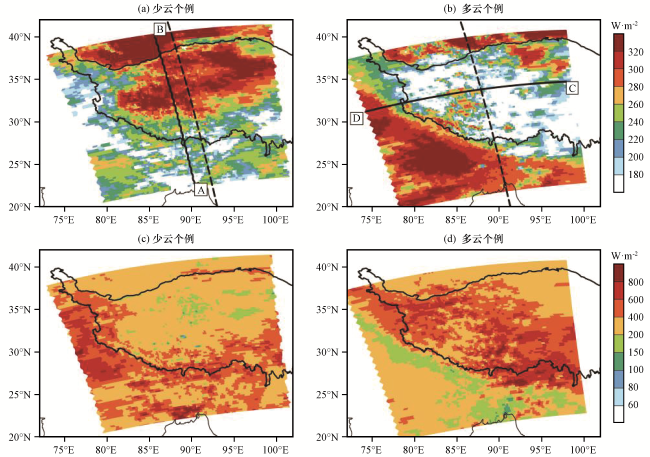
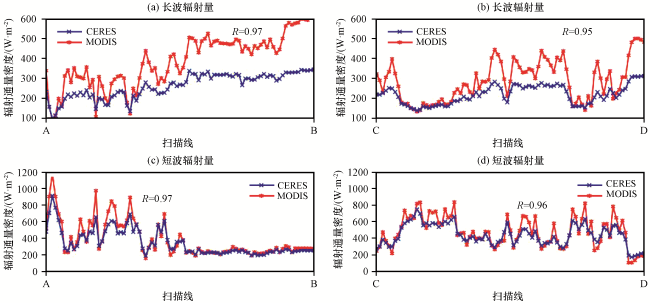
图7 少云个例和多云个例CERES仪器测得的大气顶向上出射的长波辐射(a, b)和短波辐射(c, d)分布实线AB和CD分别是少云个例和多云个例的一条扫描线, 虚线为CloudSat卫星星下点的轨迹 Fig.7 The distribution of the upward emitted longwave radiation (a, b) and shortwave radiation (c, d) at top of atmosphere measured by the CERES instrument in the cloudless case and the cloudy case.The solid line AB and CD representing for a scan line of the CERES, while the dotted line expressing the track of the CloudSat |
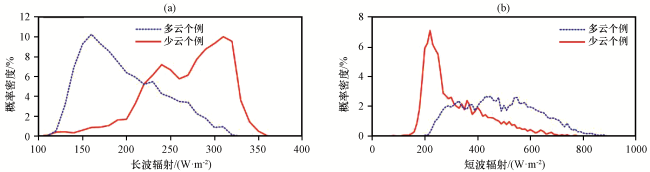
表1 晴空大气时青藏高原与塔里木盆地的地气长波强迫、 地表发射辐射和平均海拔Table 1 The earth and atmospheric longwave radiation forcing, the emitted radiation from earth surface and mean elevation over the Qinghai-Xizang Plateau and the Tarim Basin in clear sky |
| 地点 | 大气长波辐射强迫/(W·m-2) | 地表发射/(W·m-2) | 平均海拔/km |
|---|---|---|---|
| 青藏高原 | 108.3 | 422 | 4.5 |
| 塔里木盆地 | 200.7 | 558 | 0.8 |
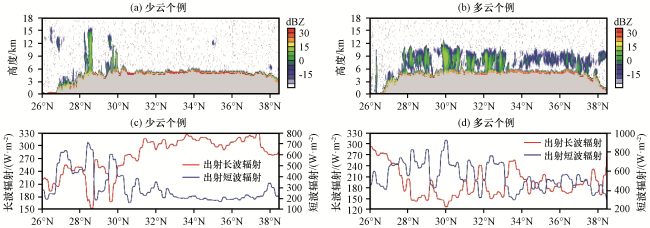
图9 少云个例与多云个例的CPR探测的云回波反射率因子剖面(a, b)及对应CERES探测的大气顶出射长波辐射和短波辐射(c, d)(a)和(b)中灰色部分为地形 Fig.9 The distribution of Radar reflectivity factor detected by the CPR (a, b), and the outgoing longwave radiation and outgoing shortwave radiation at the Cloudsat’s subsatellite point detected by CERES (c, d) for the cloudless case and cloudy case.The gray part in (a) and (b) represents the topography |
表2 多云个例和少云个例中深厚云和浅薄云的辐射强迫Table 2 Radiation forcing of deep clouds and shallow clouds in the cloudy case and the cloudless case |
| 辐射强迫 | 多云个例深厚云 | 多云个例浅薄云 | 少云个例深厚云 |
|---|---|---|---|
| 长波辐射强迫/(W·m-2) | 58.9 | 45.6 | 79.5 |
| 短波辐射强迫/(W·m-2) | -274.0 | -129.7 | -289.0 |
| 瞬时净辐射强迫/(W·m-2) | -215.1 | -84.1 | -209.5 |