Vertical Gradient Changes of Temperature and Precipitation in the Sygera Mountains, Southeastern Qinghai-Xizang Plateau

  • Lun LUO , 1, 2 ,
  • Zeng DAN 3 ,
  • Liping ZHU 1, 4 ,
  • Hongbo ZHANG 5
Expand
  • 1. Key Laboratory of Tibetan Environment Changes and Land Surface Processes / Institute of Tibetan Plateau Research,Chinese Academy of Sciences,Beijing 100101,China
  • 2. South-East Tibetan Plateau Station for Integrated Observation and Research of Alpine Environment,Chinese Academy of Sciences,Nyingchi 860119,Tibet,China
  • 3. Nyingchi Meteorological Administration,Nyingchi 860000,Tibet,China
  • 4. Chinese Academy of Sciences Center for Excellence in Tibetan Plateau Earth Sciences,Beijing 100101,China
  • 5. China Agricultural University,College of Water Resources & Civil Engineering,Beijing 100083,China

Received date: 2019-06-06

  Revised date: 2020-01-21

  Online published: 2021-02-28

Highlights

Investigating the spatiotemporal patterns of temperature lapse rates and precipitation gradients can contribute to a better understanding of the physiological and ecological mechanism controlling the altitudinal zonality of plants and animals in the Sygera Mountains, and can also provide reliable parameters for future hydrological modelling in basins of the region.The regression analysis between air temperature and elevation and between precipitation and elevation is conducted based on the daily air temperature and precipitation (from April to October) observations from 11 meteorological stations in the Sygera Mountains.The results show that: (1) The multiyear average annual air temperature lapse rate of the Sygera Mountains has relatively small interannual variation (from 2013 to 2018) with the averaged lapse rates as 0.71, 0.55 and 0.60 ℃·(100m)-1 for the western, the eastern and the both slopes, respectively.(2) As for seasonal variation, the air temperature lapse rate is relatively steep in winter and spring, and relatively shallow in summer and autumn.As a whole, the air temperature lapse rate of the Sygera Mountains is relatively shallow during the monsoon season (from June to September) under the strong influence of the Indian monsoon, and this is consistent with the findings in other parts of the Tibetan Plateau where similar impacts from the Indian monsoon can be observed.(3) The comparison between slopes shows that the temperature lapse rate of the western slope is always steeper than that of the eastern slope in the same period, which could be linked with the less precipitation of the western slope compared with the eastern slope.(4) The correlation between annual precipitation (from 2013 to 2018) and elevation on the western slope is not statistically significant, whereas the correlation is indeed significant for the eastern slope, with the multiyear average annual precipitation gradient as 10.5 mm·(100m)-1.(5) In terms of the comparison of the precipitation gradients between the monsoon and the non-monsoon periods, the situation is very complex.On the western slope, the precipitation increases with the elevation in the non-monsoon period, but does not show obvious trend with elevation in the monsoon period.On the eastern slope no obvious trends of precipitation with elevation are found in either the monsoon or the non-monsoon periods.There is an elevation band with relatively low precipitation in the middle-elevation area of the Sygera Mountains in both the western (3035~3698 m) and the eastern slopes (3326~3390 m).However, it should be noted that in the high-elevation areas the precipitation consistently increases with elevation for the both periods and the both slopes.

Cite this article

Lun LUO , Zeng DAN , Liping ZHU , Hongbo ZHANG . Vertical Gradient Changes of Temperature and Precipitation in the Sygera Mountains, Southeastern Qinghai-Xizang Plateau[J]. Plateau Meteorology, 2021 , 40(1) : 37 -46 . DOI: 10.7522/j.issn.1000-0534.2019.00123

1 引言

在山地地区, 不同海拔由于水(降水)热(气温)组分的不同, 形成典型的山地垂直带。藏东南色季拉山具有明显的山地垂直带特征: 从山麓至山顶分别为阔叶林、 针阔混交林、 针叶林、 灌木和苔藓。色季拉山植被类型丰富, 树木寿命长(Lu et al, 2015), 林线4390 m是全球森林林线较高的山区之一, 是树木年轮和森林生态研究的热点山区(Wang et al, 2014;Liang et al, 2016;Shen et al, 2018)。
目前关于色季拉山气温和降水垂直梯度的研究较少(Liang et al, 2011), 一些学者对于本区域及其附近的气温和降水垂直梯度变化的研究大多数是基于本区域的巴宜站(原林芝站)和附近的波密站对整个青藏高原气温垂直递减率(江净超等, 2016;Guo et al, 2016;Li et al, 2013;Wang et al, 2001, 2018;Zhang et al, 2018)和降水梯度的研究(Guo et al, 2016)。Liang et al(2011)利用中国科学院藏东南高山环境综合观测研究站(简称“藏东南站”)色季拉山东坡林线气象站与西坡河谷国家基本气象站巴宜站2个站2007 -2009年气象资料推算色季拉气温递减率为0.66 ℃·(100m)-1。在没考虑坡向情况下, 将此结果用来推算未来100年色季拉山东坡巨伞报春分布下限上移的高度(张杰等, 2017), 可能需要更加谨慎。同样由于缺乏降水梯度资料, 在分析色季拉山土壤有机碳等理化性质时, 理想的认为降水随海拔升高而增加(马和平等, 2013)。不仅如此, 色季拉山动物的分布情况(于娜娜等, 2011;杜元宝, 2018), 植物的群落结构(王国严等, 2011)、 生物量(刘新圣等, 2011)和繁殖策略(张杰等, 2017)等可能均受气温和降水垂直梯度特征的影响。
同时, 色季拉山是雅鲁藏布江一级支流帕隆藏布和尼洋河(任梅芳等, 2018)的分水岭, 东坡属于帕隆藏布流域, 西坡属于尼洋河流域。气温递减率和降水梯度还是水文模型研究中的重要参数(Immerzeel et al, 2014;Zhang et al, 2015;Wang et al, 2016)。Zhang et al(2015)在研究藏南卡鲁雄曲的径流模拟时认为, 考虑气温垂直递减率和降水梯度的季节变化, 能够有效地提高模拟精度。
此外, 色季拉山位于青藏高原东南部南缘, 正对雅鲁藏布江水汽通道, 对印度季风的响应敏感(Yang et al, 2009;Yu et al, 2014;姚檀栋等, 2019)。水汽沿着雅鲁藏布江由南向北传输, 在大拐弯处水汽输送方向变为东北至西南输送(高登义等, 1985;张文霞等, 2016;常姝婷等, 2019;刘菊菊等, 2019;胡梦玲等, 2019)。在水汽传输过程中, 色季拉山东坡处于迎风坡, 西坡则位于背风坡。目前不同坡向对色季拉山气温和降水垂直变化的影响也不清楚。因而, 本文基于色季拉山11个气象站点的气温和降水量数据, 探讨色季拉山东坡和西坡气温和降水垂直变化规律, 不仅加深坡向对色季拉山气温和降水垂直梯度变化规律的认识, 也为更好地了解色季拉山动植物分布随高度变化的生理生态特点, 还为未来此区域流域水文模拟提供可靠的数据支持。

2 研究区概况

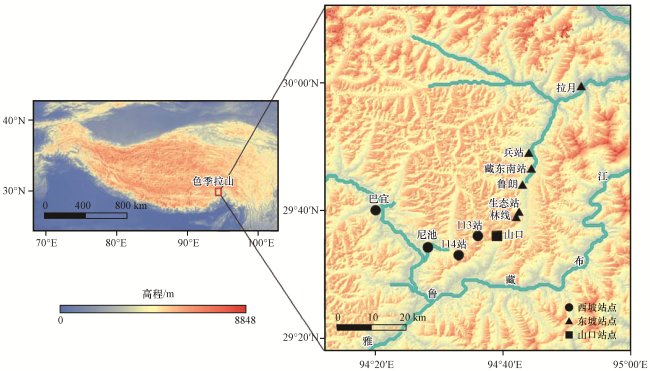
色季拉山位于青藏高原东南部(图1), 地处南迦巴瓦峰西侧, 为尼洋河和帕隆藏布的分水岭, 行政上处于西藏自治区林芝市巴宜区境内(29°10′N -30°15′N, 93°12′E -95°35′E)。色季拉山最高海拔约为5300 m, 呈西南和东北走向, 俗称的西坡即西南坡, 东坡即东北坡。同时, 色季拉山正对雅鲁藏布江水汽通道, 气候主要受印度季风(6 -9月)和西风交互影响(Yang et al, 2009;Yu et al, 2014;姚檀栋等, 2019), 垂直地带性明显。根据位于色季拉山东坡鲁朗河谷的藏东南站(29°26′N, 94°44′E, 海拔3326 m)2007 -2018年气象资料记录显示, 年均气温5.0 ℃, 平均相对湿度73%, 年降水量866 mm, 降水集中在4 -10月, 占年降水的94%。
图1 色季拉山位置和气象站站点空间分布

Fig.1 Study area and the spatial distribution of weather stations

3 数据来源与方法介绍

3.1 数据来源

本研究数据包括西藏自治区林芝市气象局提供的巴宜、 尼池、 114站、 113站、 山口、 生态站、 鲁朗、 兵站和拉月9个站点和藏东南站站本部(图1表1中的藏东南站)和林线2个站点的2013 -2018年气温和降水(4 -10月)日值资料。其中, 拉月(2015年8月建站)气温和降水资料时间段为2016 -2018年。各站的地理信息、 坡向、 多年平均气温、 多年平均降水量(4 -10月)和数据时段等详细信息如表1所示。各站点位置分布图如图1所示, 海拔最高为色季拉山口站4553 m, 海拔最低为拉月站, 海拔2438 m。由于西藏自治区林芝市气象局除巴宜站观测全年降水量外, 其他8个站点均只观测每年4 -10月降水量。为了便于数据标准化分析, 因此这11个站点的数据均选择4-10月的降水日值资料。
表1 色季拉山11个站点详细信息

Table 1 Detailed information of the 11 stations in Sygera Mountains

站点 经度 纬度 海拔/m 坡向 多年平均 气温/℃ 4 -10月多年平均 降水量/mm 数据时段
巴宜 94.33°E 29.67°N 2992 西坡 9.5 711.8 2013 -2018年
尼池 94.47°E 29.57°N 3035 西坡 9.4 666.2 2013 -2018年
114站 94.55°E 29.55°N 3698 西坡 4.5 648.9 2013 -2018年
113站 94.60°E 29.60°N 4160 西坡 1.1 793.9 2013 -2018年
山口 94.65°E 29.60°N 4553 西坡/东坡 -1.3 1056.9 2013 -2018年
林线 94.71°E 29.66°N 4390 东坡 0.3 999.2 2013 -2018年
生态站 94.70°E 29.65°N 3908 东坡 3.4 984.8 2013 -2018年
鲁朗 94.72°E 29.73°N 3390 东坡 5.5 822.3 2013 -2018年
藏东南站 94.74°E 29.76°N 3326 东坡 4.9 841.0 2013 -2018年
兵站 94.73°E 29.82°N 3132 东坡 7.0 910.0 2013 -2018年
拉月 94.87°E 29.99°N 2438 东坡 11.1 844.6 2016 -2018年

多年平均气温和多年平均降水量(4 -10月)为本研究数据时段值

3.2 方法

根据这些站点的地理位置, 按照坡向将这些色季拉山站点分为西坡(南坡)和东坡(北坡)2个自然地理单元进行气温垂直递减率和降水梯度估算, 其中色季拉山口站属于西坡和东坡共有。西坡5个站点(海拔2992~4553 m), 东坡共7个站点(海拔2438~4553 m)。本文所涉及的季风期为印度夏季风影响强烈的6 -9月, 非季风期是指除6 -9月以外的月份(Yang et al, 2009;Yu et al, 2014;姚檀栋等, 2019)。
气温垂直递减率和降水梯度估算根据站点海拔与气温或降水量进行回归分析得到, 回归方程如下(Guo et al, 2016;Zhang et al, 2018):
Y i = a H i + b 0
式中: Y, i表示i站点的气温或降水量;Hi表示对应i站点的海拔;a为斜率, 当Y表示气温, -a即为气温递减率λ;当Y表示降水量, a即降水梯度βb0为纵坐标的截距, 表示海拔为0 m(海平面)时的温度T0或降水量。

4 结果分析

4.1 气温递减率

4.1.1  λ年际变化

藏东南色季拉山(11个站点)、 西坡(5个站点)和东坡(7个站点)2013 -2018年各年平均气温与海拔回归分析结果如表2所示(四舍五入λ保留小数点后两位, T0保留小数点一位, R2小数点后三位)。所有年份年平均气温与海拔回归结果均显示两者表现为极显著(R2>0.950, P<0.01)。
表2 2013 -2018年色季拉山年平均气温与海拔回归分析结果

Table 2 Result from the regression between annual temperature and elevation in Sygera Mountains from 2013 to 2018

年份 色季拉山 西坡 东坡
λ/[℃·(100m)-1] T 0/℃ R2 λ[℃·(100m)-1] T 0/℃ R2 λ[℃·(100m)-1] T 0/℃ R2
2013年 0.63 27.2 0.955 0.71 30.5 0.997 0.53 23.2 0.980
2014年 0.63 27.6 0.954 0.72 31.0 0.998 0.54 23.6 0.977
2015年 0.62 27.1 0.950 0.70 30.5 0.998 0.53 23.2 0.965
2016年 0.59 26.1 0.957 0.69 30.3 1.000 0.55 24.2 0.979
2017年 0.60 26.5 0.959 0.70 30.9 0.999 0.55 24.4 0.983
2018年 0.60 26.1 0.955 0.71 30.8 0.999 0.55 23.9 0.983
平均 0.60 26.3 0.960 0.71 30.7 0.998 0.55 24.3 0.984
2013-2018年色季拉山11个站点各年平均气温递减率(λ)为0.59~0.63 ℃·(100m)-1λ最低值年份为2016年, 最高值为2014年, 2013 -2018年平均λ为0.60 ℃·(100m)-1;西坡各年λ在0.69~0.72 ℃·(100m)-1, 西坡与色季拉山一样, 2016年λ最低, 2014年λ最高, 2013 -2018年多年平均λ为0.71 ℃·(100m)-1;东坡各年λ为0.53~0.55 ℃·(100m)-1, 与色季拉山和西坡不同的是, 2015年λ最低, 2017年λ最高, 2013 -2018年多年平均λ为0.55 ℃·(100m)-1。通过2013 -2018年λ的年际变化可知, 无论是色季拉山整体还是西坡或者东坡观测期内各年间λ相对稳定, 年际变化非常小。
就各年拟合的海平面气温T0而言, 色季拉山、 西皮和东坡2013 -2018年各年年际T0变化均较小, 2013 -2018年多年平均T0分别为26.3, 30.7和24.3 ℃。

4.1.2  λ季节变化

就四季变化而言, 色季拉山2013 -2018年平均气温递减率λ季节变化明显, 主要表现为冬春季高值、 夏秋季低值的特征(图2)。色季拉山、 西坡和东坡λ最高值出现的季节相同, 均为春季, 其值分别为0.64, 0.76和0.60 ℃·(100m)-1。但三者最低值出现的季节略有不同, 色季拉山和东坡λ最低值出现的季节为秋季, 其值分别为0.56和0.51 ℃·(100m)-1, 而色季拉山西坡λ最低值的季节为夏季的0.66 ℃·(100m)-1
图2 2013 -2018年色季拉山多年平均气温递减率季节变化

Fig.2 The seasonal variations of multiyear average annual air temperature lapse rates in Sygera Mountains from 2013 to 2018

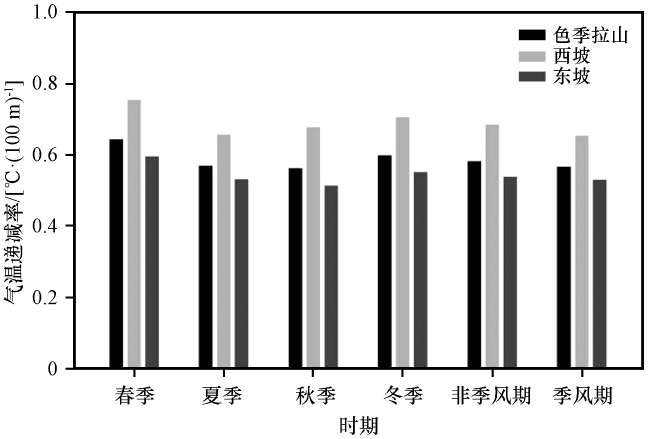
就季风期和非季风期的比较而言。由图2可知, 色季拉山、 西坡和东坡表现一致均为季风期λ均低于非季风期的。

4.1.3  λ月变化

2013 -2018年色季拉山逐月气温递减率λR2变化(图3)显示, 色季拉山、 西坡和东坡各月λ变化明显且变化趋势基本相同。λ相对较高的月份为每年前几个月, 而后逐渐下降, 下半年各月份的λ相对较低[图3(a)]。而各月R2变化明显, 除了2018年5 -7月以外, 整体变化趋势相同, 均显示在每年的11月至次年2月R2相对较低[图3(b)]。
图3 2013 -2018年色季拉山逐月λ (a)和R 2 (b)变化

Fig.3 Monthly variations of λ (a) and R 2 (b) in the Sygera Mountains from 2013 to 2018

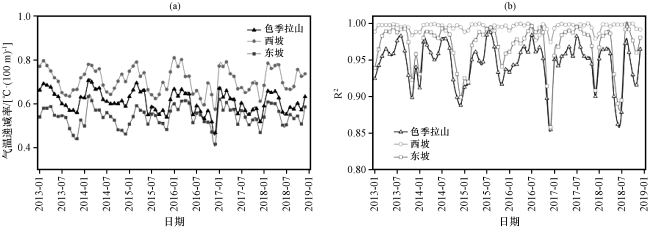
色季拉山、 西坡和东坡λ最高值出现的月份不同, 分别为2014年1月[0.71 ℃·(100m)-1]、 2016年1月[0.81 ℃·(100m)-1]和 2014年2月[0.61 ℃·(100m)-1], 而三者λ最低的月均是2016年12月, 其值分别为0.47, 0.58和0.42 ℃·(100m)-1
在各年年内的λ变幅中, 色季拉山、 西坡和东坡年内月λ最高的年份均是2016年, 最低的均为2018年。色季拉山2016年和2018年年内月λ变化幅度分别为0.20和0.11 ℃·(100m)-1;西坡2016年和2018年分别为0.23和0.12 ℃·(100m)-1;东坡则为0.20和0.10 ℃·(100m)-1
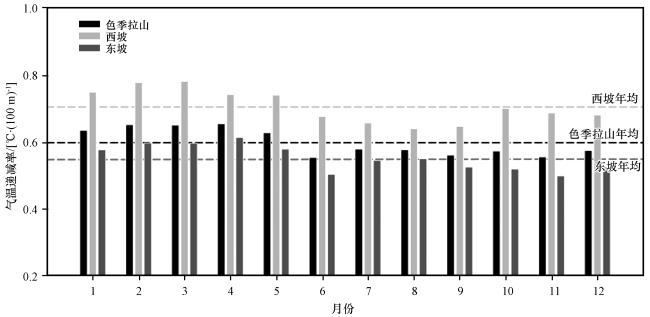
为了更方便了解色季拉山气温递减率的各月变化, 本文计算了2013 -2018年色季拉山、 西坡和东坡平均月均气温递减率(图4), 整体而言色季拉山、 西坡和东坡在上半年λ变化趋势基本一致, 均从1月开始增加, 西坡在3月达到最一年的最高值[0.78 ℃·(100m)-1], 而色季拉山和东坡在4月达到一年中最高值[色季拉山为0.66 ℃·(100m)-1, 西坡为0.61 ℃·(100m)-1], 而后一直到6月λ均处于下降趋势。色季拉山6月λ最低值, 7月以后变化不明显;西坡则是在6月的基础上一直下降, 至8月达到最低值, 而后又缓慢上升。东坡6月后又缓慢上升, 8月开始下降至11月达到一年的最低值, 12月稍微升高。
图4 2013 -2018年色季拉山多年平均月均气温递减率

Fig.4 The multiyear average monthly air temperature lapse rates of Sygera Mountains from 2013 to 2018

4.2 降水梯度

表3为色季拉山2013 -2018年4 -10月降水量与海拔回归分析结果。色季拉山11个站点, 仅2017年4 -10月降水量总量与海拔有显著变化(95%置信度), β为17.1 mm·(100m)-1;西坡中也仅2018年4 -10月降水量总量与海拔通过显著性检验, β为16.9 mm·(100m)-1R2=0.90, P<0.05);东坡中除2016年外, 4 -10月降水量总量与海拔均通过显著性水平检验, 2013 -2018年平均β为10.5 mm·(100m)-1R2=0.69, P<0.05)。
表3 色季拉山2013 -20184-10月降水量与海拔回归分析

Table 3 Year-to-year regression analysis of precipitation (from April to October) and altitude on Sygera Mountain from 2013 to 2018

年份 色季拉山 西坡 东坡
β/[mm· (100m)-1] R2 P β/[mm· (100m)-1] R2 P β/[mm· (100m)-1] R2 P
2013 16.6 0.35 >0.05 19.7 0.46 >0.05 15.6 0.86 <0.01*
2014 10.9 0.18 >0.05 13.9 0.39 >0.05 7.8 0.67 <0.05*
2015 12.8 0.27 >0.05 12.7 0.29 >0.05 15.0 0.80 <0.05*
2016 13.2 0.34 >0.05 25.2 0.76 >0.05 12.1 0.47 >0.05
2017 17.1 0.37 <0.05* 28.4 0.71 >0.05 15.5 0.68 <0.05*
2018 8.6 0.29 >0.05 16.9 0.90 <0.05* 5.1 0.57 <0.05*
平均 11.0 0.29 >0.05 19.5 0.64 >0.05 10.5 0.72 <0.05*

*号表示通过显著性水平检验

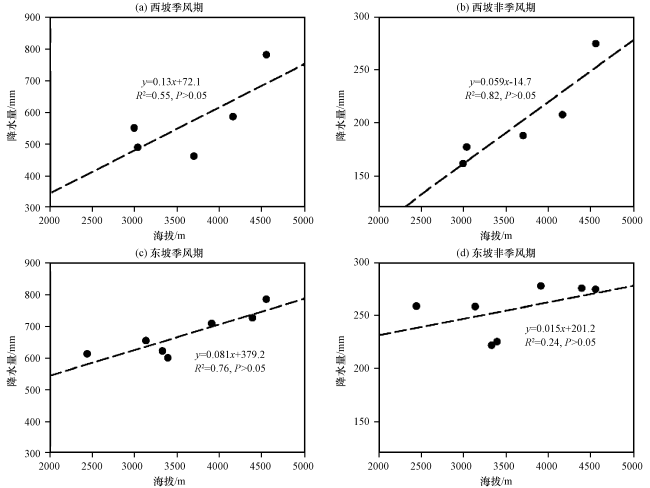
图5展示的是色季拉山西坡和东坡季风期(6 -9月)和非季风期(4 -5月, 10月)降水量与海拔的回归结果, 西坡非季风期、 东坡的季风期通过显著性检验, 降水梯度分别为β为5.9 mm·(100m)-1R2=0.82, P<0.05)和8.1 mm·(100m)-1R2=0.76, P<0.05)。
图5 色季拉山西坡(a, b)和东坡(c, d)季风期、 非季风期降水量与海拔回归分析结果

Fig.5 Regression analysis results between precipitation and altitude on the western (a, b) and eastern slope (c, d) of Sygera Mountain in the monsoon and non-monsoon periods

2013 -2018年各月均降水量与海拔的关系的分析显示, 西坡中也仅4月降水量与海拔呈极显著相关, β为1.7 mm·(100m)-1R2=0.93, P<0.01);东坡中7月[2.2 mm·(100m)-1R2=0.83, P<0.01]和8月[3.1 mm·(100m)-1R2=0.95, P<0.01]降水量与海拔呈现极显著变化。

5 讨论

5.1 气温递减率对比

色季拉山11个站点计算出来的2013 -2018年多年平均λ为0.60 ℃·(100m)-1, 略低于Liang et al (2011)利用本研究中巴宜和林线两个站点计算得到的0.66 ℃·(100m)-1。这也与青藏高原已有的结果不同, 色季拉山λ高于Wang et al (2011)利用青藏高原及其周边106个气象站计算得到高原气温递减率为0.48 ℃·(100m)-1, 也高于青藏高原西北部的祁连山葫芦沟流域的0.48 ℃·(100m)-1(卿文武等, 2018)和珠峰南坡的不丹(Kattel et al, 2015), 但低于Zhang et al (2018)利用高原86个气象站计算得到的青藏高原0.73 ℃·(100m)-1, 同样低于高原中部念青唐古拉山0.83~0.89 ℃·(100m)-1(游庆龙等, 2007)和珠峰北坡的0.78 ℃·(100m)-1(秦翔等, 2013)。
λ季节上表现为冬春季高值, 夏秋季低值的特征与青藏高原东南部已有的研究结果一致(Guo et al, 2016;Wang et al, 2018;Katttel et al, 2018), 而与高原西北部表现的春夏季高值, 秋冬季低值的结果不同(孙从建等, 2018;卿文武等, 2018)。
色季拉山、 西坡和东坡2013 -2018年平均月λ基本都在1 -5月高于年均值(图3), 受印度季风期影响的6 -9月处于相对低值, 此结果与同样受印度季风影响的青藏高原东南部地区和喜马拉雅南坡已有的结果一致(刘伟刚等, 2013;Immerzeel et al, 2014;Kattel et al, 2015, 2018;Wang et al, 2018)。
根据上文气温递减率的研究结果, 西坡λ无论是在年尺度、 季节尺度还是月尺度上, 均高于对应时期的东坡λ表2, 图2~4)。这可能与西坡的整体降水量少于东坡有关(表1)。一般来说降水量多的地方越潮湿, 空气在爬升过程中由于凝结释放潜热, 使周围气温增加, 因而气温递减率更低(李巧媛和谢自楚, 2006;刘伟刚等, 2013)。这与喜马拉雅山脉由于南坡湿度比北坡大, 导致λ低于北坡的研究结果相似(刘伟刚等, 2013;Kattel et al, 2013, 2015)。

5.2 降水随海拔变化

降水梯度结果显示, 色季拉山、 西坡和东坡降水海拔的关系复杂。表3中色季拉山、 西坡大多年份以及东坡的2016年降水量与海拔的回归关系不能通过显著性检验。2013 -2018年平均月均值也显示, 大多数月降水量与海拔的回归关系通不过显著性检验。虽然在青藏高原及其周围地区(Guo et al, 2016)的喜马拉雅山南坡(Putkonen, 2004)、 祁连山(Wang et al, 2017)、 天山(刘俊峰等, 2011)和念青唐古拉山南坡(谢健等, 2009)等地已有的研究显示降水高度带以下随海拔增高而降水量增加, 降水高度带以上随海拔增加降水减少。但在天山乌鲁木齐河流域(李开明等, 2018)、 藏北高原(杨梅学等, 1999)、 藏南谷地(鲁春霞等, 2007)、 怒江流域中段(董丹丹等, 2017)以及七一冰川河谷(王宁练等, 2009)和玉龙雪山东坡(辛惠娟等, 2012)等地的研究表明降水量与海拔关系复杂。这是由于在山地地区影响降水的因素不只有海拔, 还与山体的形态、 地形的起伏以及观测点位置等(Houze, 2012)众多因素有关。因而这可能导致色季拉山某些时期的降水梯度不能通过显著性检验。
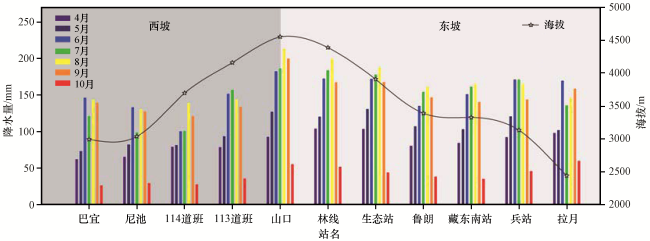
为了更好地分析降水与海拔的关系, 图6展示了6年平均各月降水量随海拔的分布关系, 整体而言西坡的降水量明显少于东坡降水量。色季拉山除10月最大降水站点在拉月以外, 4 -9月降水量最大的降水站点均是山口站, 因而色季拉山最大降水高度高于山口站的海拔4553 m。同时, 本文对比了各站中季风期(6 -9月)降水量与非季风期(4 -5月, 10月)降水量, 发现季风期降水量显著高于非季风期降水量, 各站中季风期降水量占比均在70%以上。
图6 2013 -2018年色季拉山西坡和东坡平均月降水量随海拔分布

Fig.6 Distribution of multiyear average monthly precipitation along with altitude on the western and eastern slope of Sygera Mountains from 2013 to 2018

西坡在季风期显示从巴宜站(2292 m)至114站(3698 m)降水量减少, 114站至山口站降水量增加[图5(a), 图6]。在非季风期, 整体表现为从低海拔的巴宜至山口逐渐增加的趋势[图5(b), 图6], β为5.9 mm·(100m)-1R2=0.82, P<0.05)。而东坡季风期整体表现为先增后减, 再增加的趋势, 降水量最少站点为鲁朗站(3390 m)[图5(c), 图6], 但降水梯度明显;非季风期变现为先减后增的趋势, 降水量最少的站点为藏东南站(3326 m)[图5(d), 图6], 藏东南站以上降水梯度明显, β为4.6 mm·(100m)-1R2=0.79, P<0.05)。这说明色季拉山西坡和东坡在中海拔区域均有一个相对少雨区, 西坡为3035~3698 m, 而东坡为3326~3390 m。就其变化趋势而言, 这与辛惠娟等(2012)研究得出的玉龙雪山东坡存在两个降水带, 即一个是2800~3200 m, 另一个是4800~5000 m的研究结果相似。色季拉山东坡第一个降水带是在兵站所在海拔的3132 m左右, 第二个降水带是超过山口站海拔的4553 m。这也和喜马拉雅山脉南坡的Langtang河上游(1406~4831 m)的降水随海拔表现为先增后减, 再增加的趋势结果一致(Immerzeel et al, 2014)。

6 结论

根据色季拉山11个气象站的气温和降水与海拔关系的分析得到以下主要结论:
(1) 无论是色季拉山整体还是分坡向的西坡和东坡, 色季拉山λ年际变化较小, 2013 -2018年色季拉山、 西坡和东坡平均λ分别为0.60, 0.71和0.55 ℃·(100m)-1
(2) 色季拉山λ季节变化上显示冬春高夏秋低的特点;在受印度季风影响的6 -9月λ是相对的一个低值, 这和青藏高原其他受印度季风影响的地区结果一致。
(3) 无论是在年尺度、 季节尺度还是月尺度上, 西坡λ均高于对应时期的东坡的, 这可能与西坡降水量少于东坡有关。
(4) 2013 -2018年西坡(4 -10月)平均降水总量与海拔非简单的线性关系。西坡季风期降水随海拔变化的关系为先减后增, 而非季风期降水梯度明显。
(5) 2013 -2018年东坡平均降水梯度为10.5 mm·(100m)-1, 季风期降水随海拔的变化为先增后减, 再增加的趋势;非季风期变为先减后增的趋势, 藏东南站以上降水梯度明显。
(6) 色季拉山西坡和东坡都在中海拔区域有相对少雨区, 西坡的少雨区在114站点的3035~3698 m, 东坡的少雨区在3326~3390 m。
本文的研究结果是基于色季拉山为数有限的11个气象站获得, 由于影响气温垂直递减率和降水梯度的因素很多, 色季拉山气象站点中除山口站、 林线站和生态站位于山脊外, 其余站点全部位于山谷地带, 再加上西坡以及高海拔站点数较少, 这些可能会影响本文获得更为真实的气温递减率和降水梯度。未来, 以藏东南站为依托, 适当增加西坡观测站点以及高海拔区域站点, 拟合更为精准的气温递减率和降水梯度。结合相对湿度、 太阳辐射以及风速等分析色季拉山气温递减率与附近探空站的气温递减率的联系与差异的原因。

非常感谢中国科学院青藏高原研究所余武生研究员和两位审稿专家在论文写作中给予的诸多建议和帮助。

Guo X Y, Wang L, Tian L D, 2016.Spatio-temporal variability of vertical gradients of major meteorological observations around the Tibetan Plateau [J].International Journal of Climatology, 36(4): 1901-1916.DOI: 10.1002/joc.4468.

Houze R A, 2012.Orographic effects on precipitating clouds [J].Reviews of Geophysics, 50(1): RG1001.DOI;10.1029/2011RG000365.

Immerzeel W W, Petersen L, Ragettli S, et al, 2014.The importance of observed gradients of air temperature and precipitation for modeling runoff from a glacierized watershed in the Nepalese Himalayas [J].Water Resources Research, 50(3): 2212-2226.

Kattel D B, Yao T D, 2013.Recent temperature trends at mountain stations on the southern slope of the central Himalayas [J].Journal of Earth System Science, 122(1): 215-227.DOI: 10.1007/s12040-012-0257-8.

Kattel D B, Yao T D, Yang W, et al, 2015.Comparison of temperature lapse rates from the northern to the southern slopes of the Himalayas [J].International Journal of Climatology, 35(15): 4431-4443.DOI: 10.1002/joc.4297.

Kattel D B, Yao T D, Panday P K, 2018.Near-surface air temperature lapse rate in a humid mountainous terrain on the southern slopes of the eastern Himalayas [J].Theoretical and Applied Climatology, 132(3/4): 1129-1141.DOI: 10.1007/s00704-017-2153-2.

Liang E Y, Liu B, Zhu L P, et al, 2011.A short note on linkage of climatic records between a river valley and the upper timberline in the Sygera Mountains, southeastern Tibetan Plateau [J].Global Planet Change, 77(1/2): 97-102.

Liang E Y, Wang Y F, Piao S L, et al, 2016.Species interactions slow warming-induced upward shifts of treelines on the Tibetan Plateau [J].Proceedings of the National Academy of Sciences, USA, 113(16): 4380-4385.DOI: 10.1073/pnas.1520582113.

Lu X M, Camarero J J, Wang Y F, et al, 2015.Up to 400-year-old Rhododendron shrubs on the southeastern Tibetan Plateau: Prospects for shrub-based dendrochronology [J].Boreas, 44(4): 760-768.DOI: 10.1111/bor.12122.

Putkonen J K, 2004.Continuous snow and rain data at 500 to 4400 m altitude near Annapurna, Nepal, 1999 -2001 [J].Arctic Antarctic and Alpine Research, 36(2): 244-248.DOI: 10.1657/1523-0430(2004)036[0244: CSARDA]2.0.CO;2.

Shen W, Zhang L, Guo Y, et al, 2018.Causes for treeline stability under climate warming: Evidence from seed and seedling transplant experiments in southeast Tibet [J].Forest Ecology and Management, 408: 45-53.DOI: 10.1016/j.foreco.2017.10.025.

Wang K L, Sun J, Cheng G D, et al, 2011.Effect of Altitude and Latitude on Surface Air Temperature across the Qinghai-Tibet Plateau [J].Journal of Mountain Science, 8(6): 808-816.DOI: 10.1007/s11629-011-1090-2.

Wang L, Chen R S, Song Y X, et al, 2018.Precipitation-altitude relationships on different timescales and at different precipitation magnitudes in the Qilian Mountains [J].Theoretical and Applied Climatology, 134(3/4): 875-884.DOI: 10.1007/s00704-017-2316-1.

Wang L, Sun L T, Shrestha M, et al, 2016.Improving snow process modeling with satellite-based estimation of near-surface-air-temperature lapse rate [J].Journal of Geophysical Research: Atmospheres, 121(20): 12005-12030.DOI: 10.1002/2016JD025506.

Wang Y F, Pederson N, Ellison A M, et al, 2016.Increased stem density and competition may diminish the positive effects of warming at alpine treeline [J].Ecology, 97(7): 1668-1679.DOI: 10. 1890/15-1264.1.

Wang Y W, Wang L, Li X P, et al, 2018.Temporal and spatial changes in estimated near‐surface air temperature lapse rates on Tibetan Plateau [J].International Journal of Climatology, 38(7): 2907-2921.DOI: 10.1002/joc.5471.

Yang X X, Xu B Q, Yang W, et al, 2009.Study of altitudinal lapse rates of δ 18O in precipitation/river water with seasons on the southeast Tibetan Plateau [J].Chinese Science Bulletin, 54(16): 2742-2750.DOI: 10.1007/s11434-009-0496-5.

Yu W S, Xu B Q, Lai C T, et al, 2014.Influences of relative humidity and Indian monsoon precipitation on leaf water stable isotopes from the southeastern Tibetan Plateau [J].Geophysical Research Letters, 41(21): 7746-7753.DOI: 10.1002/2014GL062004.

Zhang F, Zhang H B, Hagen S C, et al, 2015.Snow cover and runoff modelling in a high mountain catchment with scarce data: Effects of temperature and precipitation parameters [J].Hydrological Processes, 29(1): 52-65.DOI: 10.1002/hyp.10125.

Zhang H B, Zhang F, Zhang G Q, et al, 2018.How accurately can the air temperature lapse rate over the Tibetan Plateau be estimated from MODIS LSTs? [J].Journal of Geophysical Research Atmospheres, 123(D24): 3943-3960.DOI: 10.1002/2017JD028243.

常姝婷, 刘玉芝, 华珊, 等, 2019.全球变暖背景下青藏高原夏季大气中水汽含量的变化特征[J].高原气象, 38(2): 227-236.DOI: 10.7522/j.issn.1000-0534.2018.00080.

董丹丹, 苏鹏程, 孙铭, 等, 2017.青藏高原东南缘复杂地形条件下降水特征分析[J].人民长江, 48(10): 33-39.DOI: 10.16232/j.cnki.1001-4179.2017.10.008.

杜元宝, 2018.中国西南山地啮齿动物群落多样性海拔梯度格局及机制研究[D].北京: 中国科学院大学.

高登义, 邹捍, 王维, 1985.雅鲁藏布江水汽通道对降水的影响[J].山地研究, 3(4): 239-249.

胡梦玲, 游庆龙, 2019.青藏高原南侧经圈环流变化特征及其对降水影响分析[J].高原气象, 38(1): 14-28.DOI: 10.7522/j.issn.1000-0534.2018.00064.

江净超, 刘军志, 秦承志, 等, 2016.中国近地表气温直减率及其季节和类型差异[J].地理科学进展, 35(12): 1538-1548.DOI: 10.18306/dlkxjz.2016.12.010.

李开明, 钟晓菲, 姜烨, 等, 2018.1961-2016年乌鲁木齐河流域气温和降水垂直梯度变化研究[J].冰川冻土, 40(3): 607-615.DOI: 10.7522 /j.issn.1000-0240.2018.0066.

李巧媛, 谢自楚, 2006.高原区气温垂直递减率的分布及其特点分析——以青藏高原及其周边地区为例[J].石河子大学学报(自然科学版), 24(6): 719-723.DOI: 10.3969/j.issn.1007-7383.2006.06.016.

刘菊菊, 游庆龙, 王楠, 2019.青藏高原夏季云水含量及其水汽输送年际异常分析[J].高原气象, 38(3): 449-459.DOI: 10. 7522 /j.issn.1000-0534.2018.00138.

刘俊峰, 陈仁升, 卿文武, 等, 2011.基于TRMM降水数据的山区降水垂直分布特征[J].水科学进展, 22(4): 447-454.DOI: 32.1309.P.20110709.1619.010.

刘伟刚, 张东启, 柳景峰, 等, 2013.喜马拉雅山中段地区气温直减率变化特征[J].干旱气象, 31(2): 240-245.DOI: 10.11755 /j.issn.1006-7639(2013)-02-0240.

刘新圣, 张林, 孔高强, 等, 2011.藏东南色季拉山急尖长苞冷杉林线地带地上生物量随海拔的变化特征[J].山地学报, 29(3): 362-368.DOI: 10.3969/j.issn.1008-2786.2011.03.014.

鲁春霞, 王菱, 谢高地, 等, 2007.青藏高原降水的梯度效应及其空间分布模拟[J].山地学报, 25(6): 655-663.DOI: 10.3969/j.issn.1008-2786.2007.06.003.

马和平, 郭其强, 刘合满, 等, 2013.西藏色季拉山东麓垂直带土壤碳氮分布特征及其影响因素[J].西北农林科技大学学报(自然科学版), 41(1): 91-96.DOI: 10.13207/j.cnki.jnwafu.2013. 01.014.

秦翔, 杨兴国, 李健, 等, 2013.珠穆朗玛峰北坡地区的气温分布及其垂直梯度分析[J].高原气象, 32(1): 1-8.DOI: 10.7522/j.issn.1000-0534.2012.00001.

卿文武, 韩春坛, 刘俊峰, 等, 2018.祁连山葫芦沟流域气温直减率变化特征 [J].兰州大学学报(自然科学版), 54(1): 44-50.DOI: 10.13885/J.ISSN.045-2059.2018.01.008.

任梅芳, 庞博, 徐宗学, 等, 2018.基于随机森林模型的雅鲁藏布江流域气温降尺度研究[J].高原气象, 37(5): 1241-1253.DOI: 10.7522/j.issn.1000-0534.2018.00026.

孙从建, 李伟, 李新功, 等, 2018.青藏高原西北部近地表气温直减率时空分布特征[J].自然资源学报, 33(7): 1270-1282.DOI: 10.31497/zrzyxb.20170669.

王国严, 罗建, 徐阿生, 等, 2011.西藏色季拉山川滇高山栎种群结构与动态[J].林业科学研究, 24(3): 292-299.

王宁练, 贺健桥, 蒋熹, 等, 2009.祁连山中段北坡最大降水高度带观测与研究[J].冰川冻土, 31(3): 395-403.

谢健, 刘景时, 杜明远, 等, 2009.拉萨河流域高山水热分布观测结果分析[J].地理科学进展, 28(2): 223-230.DOI: 10.11820/dlkxjz.2009.02.009.

辛惠娟, 何元庆, 李宗省, 等, 2012.玉龙雪山东坡气温和降水梯度年内变化特征[J].地球科学(中国地质大学学报), 37(增刊): 188-194.DOI: 10.3799/dqkx.2012.s1.019.

杨梅学, 姚檀栋, Ueno K, 等, 2000.1998年夏季(7, 8月)藏北降水的某些特征分析[J].资源科学, 22(6): 43-46.

姚檀栋, 余武生, 邬光剑, 等, 2019.青藏高原及周边地区近期冰川状态失常与灾变风险[J].科学通报, 64(27): 2770-2782.DOI: 10.1360/TB-2019-0246.

游庆龙, 康世昌, 田克明, 等, 2007.青藏高原念青唐古拉峰地区气候特征初步分析[J].山地学报, 25(4): 497-504.DOI: 10. 3969/j.issn.1008-2786.2007.04.017.

于娜娜, 徐正会, 张成林, 等, 2011.藏东南色季拉山蚂蚁物种的分布格局[J].北京林业大学学报, 33(5): 75-80.DOI: 10. 13332/j.1000-1522.2011.05.002.

张杰, 蒋显锋, 陈玲玲, 等, 2017.巨伞钟报春繁殖策略随海拔梯度的变异[J].西北植物学报, 37(7): 1404-1413.DOI: 10.7606/j.issn.1000-4025.2017.07.1404.

张文霞, 张丽霞, 周天军, 2016.雅鲁藏布江流域夏季降水的年际变化及其原因[J].大气科学, 40(5): 965-980.DOI: 10.3878/j.issn.1006-9895.1512.15205.

Outlines

/