1 引言
2 资料选取与方法介绍
2.1 资料选取
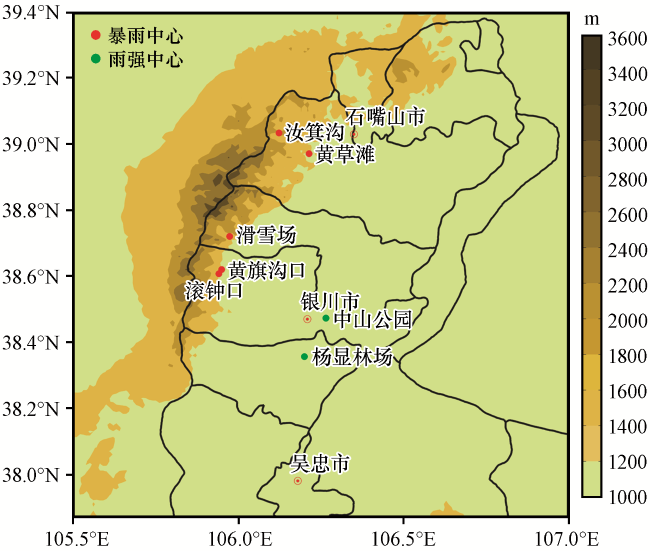
图1 贺兰山东麓地形与极端暴雨中心分布阴影为海拔(单位: m) Fig.1 Distribution of topography and the extreme rain-storm center along the Eastern Helan Mountain.The shadow refers to the altitude (unit: m) |
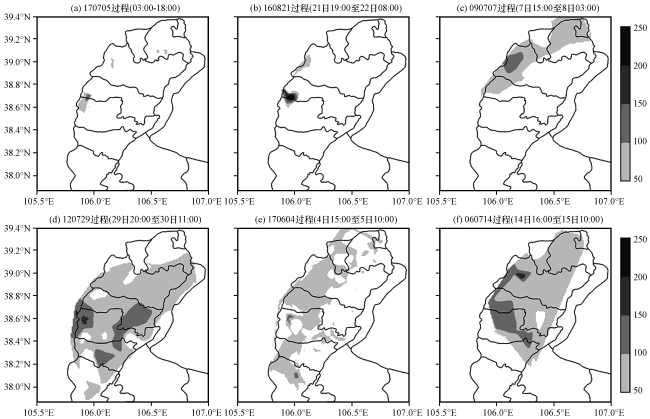
图2 贺兰山东麓极端暴雨线型(上)和非线型(下)对流系统过程的降水分布(阴影为过程雨量≥50 mm)Fig.2 Precipitation distribution of linear (up) and nonlinear (down) convection process the extreme rainstorm along the Eastern Helan Mountain.The shadow is the accumulated precipitation more than 50 mm |
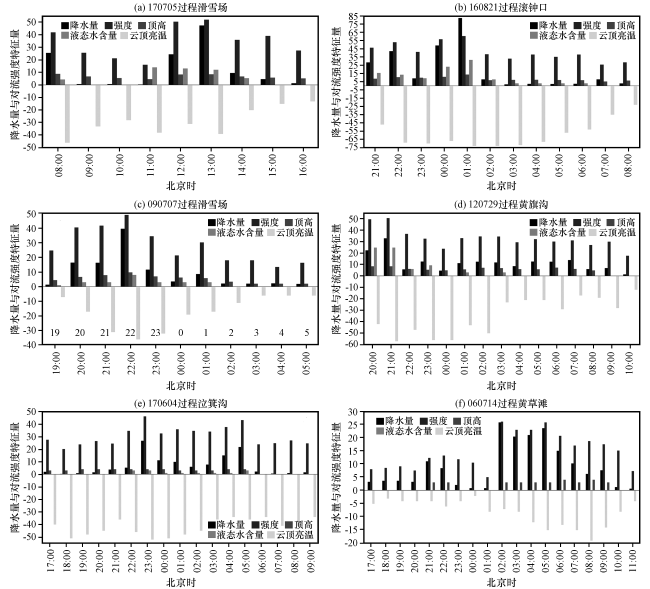
图3 暴雨中心逐时降水量(单位: mm)与对流强度特征量[回波强度(单位: dBZ)、顶高(单位: km)、液态水含量[单位: (g·kg-1)]以及TBB(单位: ℃)的时间演变Fig.3 Evolution of hourly rainfall (unit: mm) and characteristic quantity of convective intensity [echo intensity (unit: dBZ),cloud top height (unit: km),liquid water (unit: g·kg-1),TBB (unit: ℃)] of the rainstorm center |
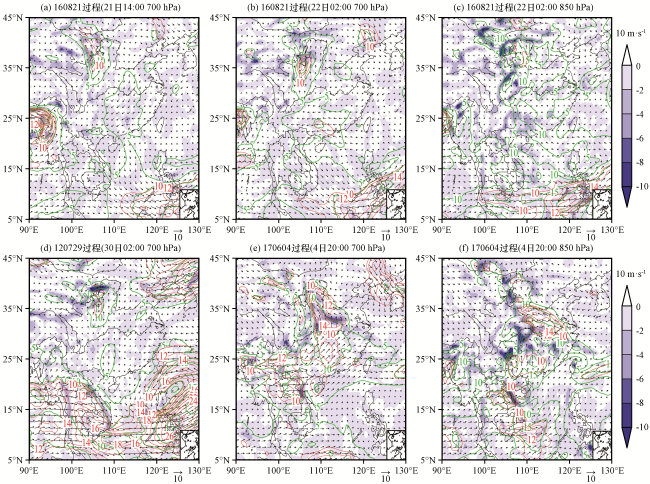
图4 深对流系统(a~d)和混合对流系统(e~f)过程的低层水汽输送阴影为水汽通量散度(单位: ×10-5 g·cm-3·hPa-1·s-1), 绿色实线为水汽通量(单位: ×10-3 g·cm-1·hPa-1·s-1), 红色实线为低空急流, 风速(矢量)≥10 m·s-1 Fig.4 Low-level vapour transport in the rainstorm dominated by deep(a~d) and mixed(e~f) convection system.The shallow is the divergence of moisture flux(unit: ×10-5 g·cm-3·hPa-1·s-1), green line represents moisture flux (unit: ×10-3 g·cm-1·hPa-1·s-1), red line marks low-level jet, wind speed (vector) is more than or equal to 10 m·s-1 |
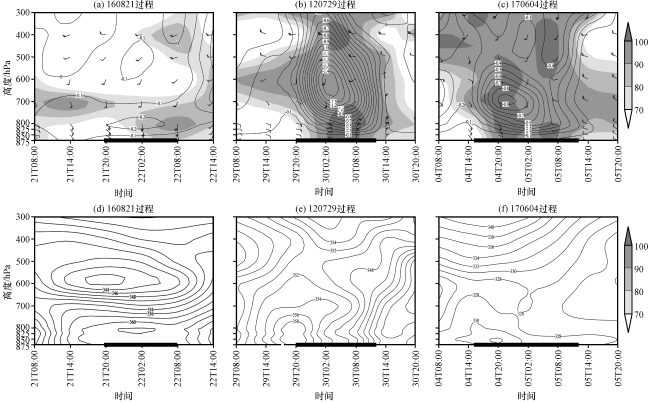
图5 银川(38.47°E、 106.2°N)上空的风矢量(风羽, 单位: m·s-1)、 上升运动(虚线, 单位: hPa·s-1)、 相对湿度(阴影≥70%, 单位: %)(上)、 假相当位温(下, 黑实线, 单位: K)的时-空剖面■ 为强降雨时段 Fig.5 Time-height section of Yinchuan station (38.47°E 106.2°N) about wind vector (barb, units: m·s-1), ascending motion (the dashed line, units: hPa·s-1), relative humility (the shaded means relative humility more than 70%, units: %)(up), and potential pesudoequivalent temperature (down, black solid line, units: K. ■ means strongest rainfall period |
2.2 极端暴雨过程标准
表1 2006 -2017年贺兰山东麓地区极端暴雨天气过程Table 1 Extreme rainstorms in the Eastern Region of Helan Mountain from 2006 to 2017 |
| 过程分类 | 主要降水时段 | 持续 时间/h | 区域平均 雨量/mm | 大暴雨 测站数 | 短时强降水 测站数 | 最大累计 雨量/mm | 最大雨强 /(mm·h-1) | |
|---|---|---|---|---|---|---|---|---|
| 线型 对流系统 | 深对流系统 | 2017年7月5日03:00-18:00 | 16 | 12.1 | 1 | 13 | 滑雪场114.4 | 47.4 |
| 2016年8月21日19:00至22日08:00 | 14 | 9.6 | 5 | 26 | 滑雪场241.7 | 82.5 | ||
| 2009年7月7日15:00至8日03:00 | 13 | 21.5 | 1 | 8 | 汝箕沟107.6 | 39.6 | ||
| 非线性 对流系统 | 深对流系统 | 2012年7月29日20:00至30日11:00 | 16 | 58.8 | 14 | 22 | 滚钟口174.3 | *47.7 |
| 混合对流 系统 | 2017年6月4日15:00至5日10:00 | 20 | 39.7 | 3 | 5 | 黄旗沟116.5 | 26.7 | |
| 2006年7月14日16:00至15日10:00 | 19 | 76.6 | 8 | 16 | 黄草滩168.2 | *33.3 | ||
所有降水统计包含整个研究区域所有测站; *表示累计降雨中心与最大雨强测站不一致 |
2.3 极端暴雨过程分类
3 两类极端暴雨过程的主要中尺度特征
表2 强降水发生前、 过程中对流参数和云顶高度变化与暴雨中心最强降雨时段的雷达回波和TBBTable 2 Convective parameters and cloud top height before and during the occurrence of heavy precipitation, echo intensity and TBB of the rainstorm center during the strongest rainfall period |
| 过程分类 | 极端暴雨 过程 | 对流参数变化 | 特殊温度层 高度km | 暴雨中心对应雷达 回波和TBB | ||||||||||||
|---|---|---|---|---|---|---|---|---|---|---|---|---|---|---|---|---|
| 过程前 | 过程中 | |||||||||||||||
| CAPE /(J·kg-1) | CIN /(J·kg-1) | K指数/℃ | CAPE /(J·kg-1) | CIN /(J·kg-1) | K指数 /℃ | LFC /hPa | 0 ℃ | -20 ℃ | 强度 /dBZ | 顶高 /km | 强回波 高度/km | 液态水 含量 /(g·kg-1) | TBB /℃ | |||
| 线型 对流 系统 | 深对流 系统 | 170705过程 | 430.4 | 447.4 | 30.3 | 1104.7 | 215.1 | 39.1 | 611 | 4.7~5.1 | 8~8.1 | 58 | 11 | 5.5(45 dBZ) | 28 | -46 |
| 160821过程 | 3.6 | 148.7 | 35.9 | 536 | 18.7 | 43 | 678 | 5.6~6.0 | 9.0~9.2 | 63 | 16 | 7(50 dBZ) | 38 | -73 | ||
| 090707过程 | 13.3 | 200.3 | 35 | 398.6 | 81 | 39 | 711 | 5.2~5.3 | 8.5~8.8 | 58 | 10 | 5.5(40 dBZ) | 13 | -36 | ||
| 非线型 对流 系统 | 深对流 系统 | 120729过程 | 201.5 | 235 | 34.9 | 278.6 | 159.3 | 41.9 | 612 | 5.2~5.4 | 8.5~8.9 | 58 | 9 | 5.5(40 dBZ) | 25 | -57 |
| 混合对流 系统 | 170604过程 | 30.6 | 348 | 23.5 | 37.4 | 1.6 | 30.1 | 854 | 4.2~4.9 | 7.4~7.6 | 48 | 5 | 3(35 dBZ) | 1.5 | -52 | |
| 060714过程 | 32.9 | 205.2 | 32 | 60.3 | 2.2 | 40 | 844 | 5.3~6.0 | 9~9.1 | 38 | 5 | 3(30 dBZ) | 1.5 | -19 | ||
3.1 降水分布特点
3.2 触发极端暴雨的环境场特征
3.2.1 水汽输送
3.2.2 大气不稳定
3.2.3 抬升触发机制
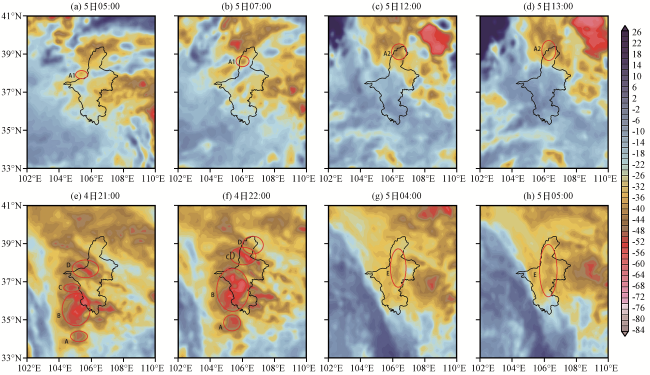
3.3 暴雨中尺度系统的发生与发展
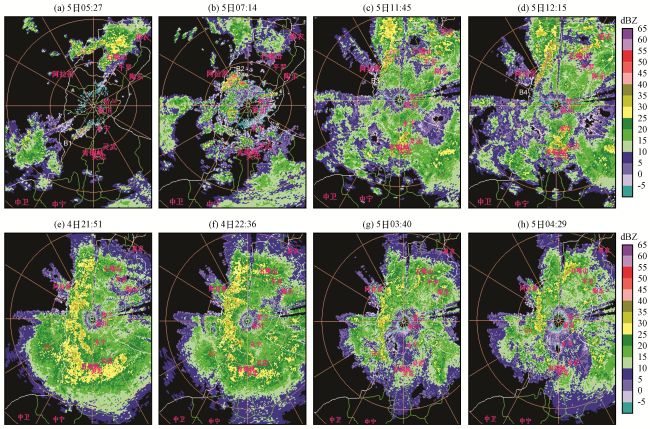
图7 170705过程(a~d)和170604过程(e~h)贺兰山东麓极端暴雨过程的雷达(2.4°仰角)回波强度(单位: dBZ)演变B1-B4为对流系统 Fig.7 Radar 2.4° inflectivity evolution of the 170705 (a~d) and 170604 (e~h) extreme rainstorm in the Eastern Region of Helan Mountain.Unit: dBZ.B1-B4 represents the convective system |
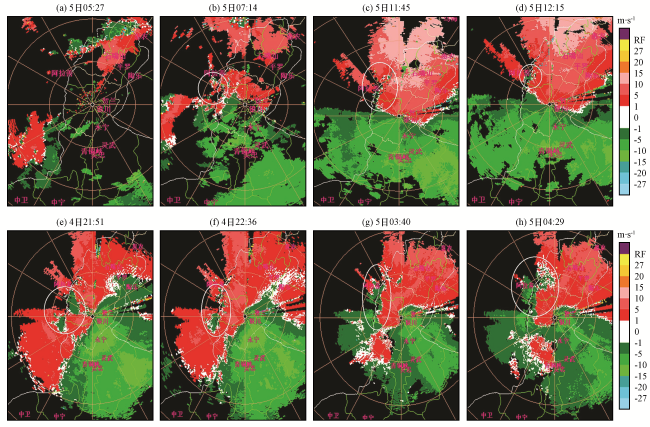
图8 170705过程(a~d)和170604过程(e~h)贺兰山东麓极端暴雨过程的雷达(2.4º仰角)回波速度(单位: m·s-1)演变白色圆圈为气旋式辐合或中尺度辐合线 Fig.8 Radar 2.4°velocity evolution of the 170705 (a~d) and 170604 (e~h) extreme rainstorm in the Eastern Region of Helan Mountain.Unit: m·s-1.White circle represents the cyclonic convergence or mesoscale convergence line |