
1 引言
2 数据来源与研究方法
2.1 数据来源
2.1.1 模式数据
表1 15个CMIP5气候模式的基本信息Table 1 Information of 15 CMIP5 climate models |
| 编号 | 模式 | 模式机构 | 国家 | 网格数 |
|---|---|---|---|---|
| 1 | ACCESS1-0 | CSIRO-BOM | 澳大利亚 | 192×145 |
| 2 | CanESM2 | CCCma | 加拿大 | 128×64 |
| 3 | CNRM-CM5 | CNRM-CERFACS | 法国 | 256×128 |
| 4 | CSIRO-Mk3-6-0 | CSIRO-QCCCE | 澳大利亚 | 192×96 |
| 5 | GFDL-CM3 | NOAA-GFDL | 美国 | 144×90 |
| 6 | GFDL-ESM2G | NOAA-GFDL | 美国 | 144×90 |
| 7 | GFDL-ESM2M | NOAA-GFDL | 美国 | 144×90 |
| 8 | INM-CM4 | INM | 俄罗斯 | 180×120 |
| 9 | IPSL-CM5A-LR | IPSL | 法国 | 96×96 |
| 10 | IPSL-CM5A-MR | IPSL | 法国 | 144×143 |
| 11 | MIROC5 | MIROC | 日本 | 256×128 |
| 12 | MIROC-ESM | MIROC | 日本 | 128×64 |
| 13 | MPI-ESM-LR | MPI-M | 德国 | 192×96 |
| 14 | MPI-ESM-MR | MPI-M | 德国 | 192×96 |
| 15 | MRI-CGCM3 | MRI | 日本 | 320×160 |
NEX-GDDP各模式网格数均为1440×720 |
2.1.2 观测资料
2.2 方法介绍
2.2.1 数据预处理
2.2.2 模拟能力评价方法
(1) 模式对逐日值的模拟能力
(2) 模式对年/季平均值/总量和极端值的模拟能力
2.2.3 偏差校正方法
2.2.4 模式数据偏差校正
3 结果分析
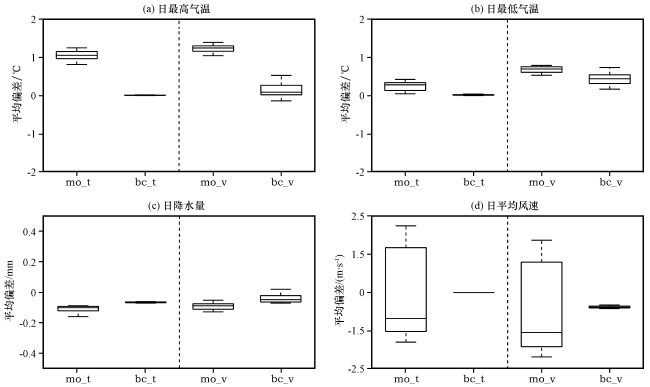
3.1 历史时期校正前后逐日值模拟能力
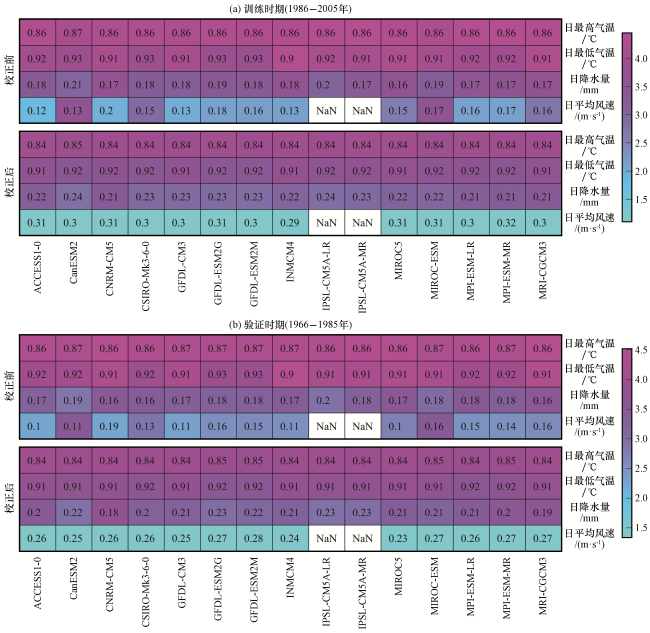
图1 在青藏高原地区, 历史训练(a)和验证(b)模式数据和CN05.1逐日值的皮尔逊相关系数和均方根误差数字表示相关系数; 渐变色表示均方根误差; IPSL-CM5A-LR和IPSL-CM5A-MR的日平均风速未参与评估 Fig.1 Pearson’s correlation coefficients and root mean square errors of daily values of models and CN05.1 in Qinghai-Xizang Plateau during the historical training (a) and validation (b) set.The numbers represent the Pearson’s correlation coefficients.The shading colors represent the root mean square errors.Daily mean near-surface wind speed of IPSL-CM5A-LR and IPSL-CM5A-MR are excluded |
3.2 历史时期校正前后年/季特征值空间分布的模拟能力
3.2.1 平均值/总量
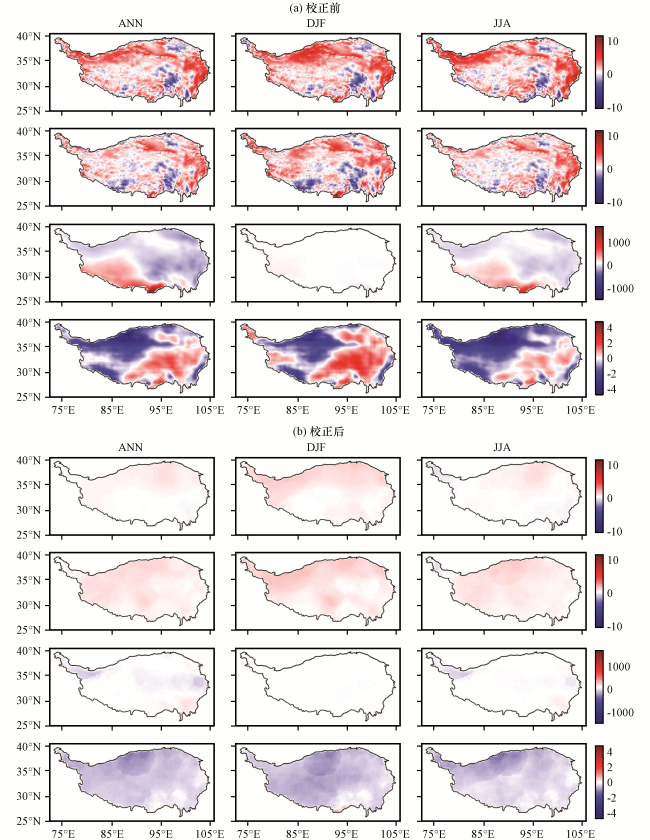
图3 1966 -1985年青藏高原地区模式和CN05.1年/季平均值/总量的差值分布第1~4行分别为最高气温(单位: ℃)、 最低气温(单位: ℃)、 降水量(单位: mm)和平均风速(单位: m·s-1) Fig.3 Differences between the annual/seasonal mean/total values of models and CN05.1 in Qinghai-Xizang Plateau from 1966 to 1985.Line 1~4 denote maximum (minimum) air temperature (unit: ℃), precipitation (unit: mm) and mean wind speed (unit: m·s-1), respectively |
3.2.2 极端值
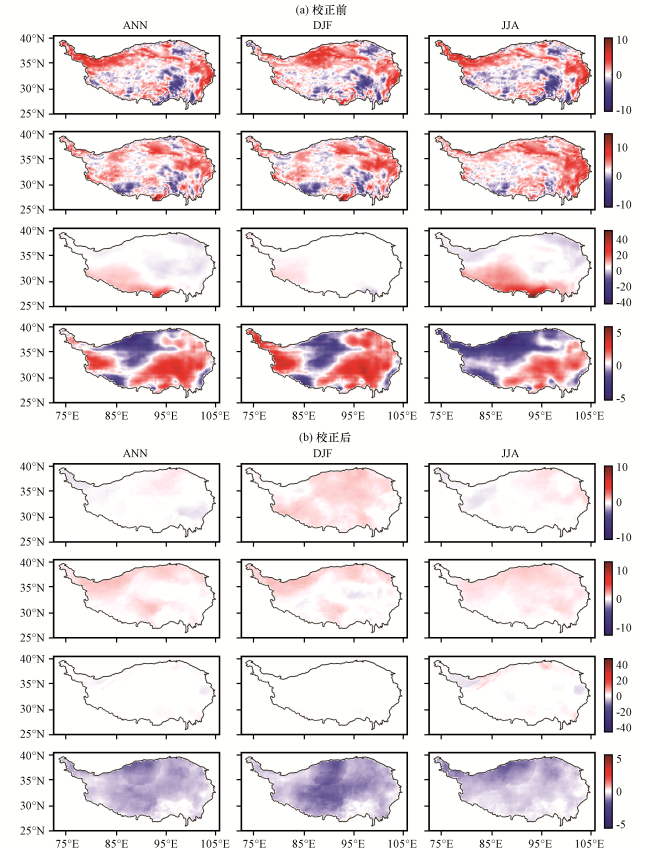
图4 1966 -1985年青藏高原地区模式和CN05.1年/季极端阈值的差值分布第1~4行分别为极端高温(单位: ℃)、 极端低温(单位: ℃)、 极端降水(单位: mm)和极端风速(单位: m·s-1) Fig.4 Differences between annual/seasonal extreme values of models and CN05.1 in Qinghai-Xizang Plateau from 1966 to 1985.Line 1~4 denote extreme maximum, minimum air temperature (unit: ℃), extreme precipitation (unit: mm) and extreme wind speed (unit: m·s-1), respectively |
3.3 校正对未来时期预估结果的影响
3.3.1 平均值/总量
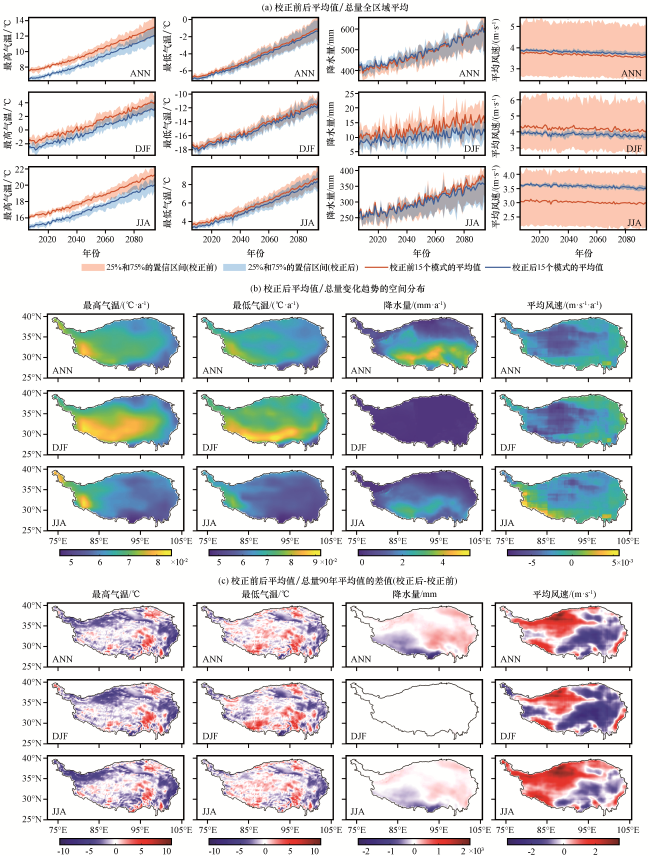
图5 在RCP8.5情景下, 青藏高原地区2006 -2095年校正前后模式平均值/总量的全区域平均(a), 校正后模式的趋势空间分布(b)和校正前后模式的差异场(c)Fig.5 The regional average (a), the trend distribution (b) and the differences (c) between annual/seasonal mean/total values of models before and after correction in Qinghai-Xizang Plateau from 2006 to 2095 under the RCP8.5 scenario |
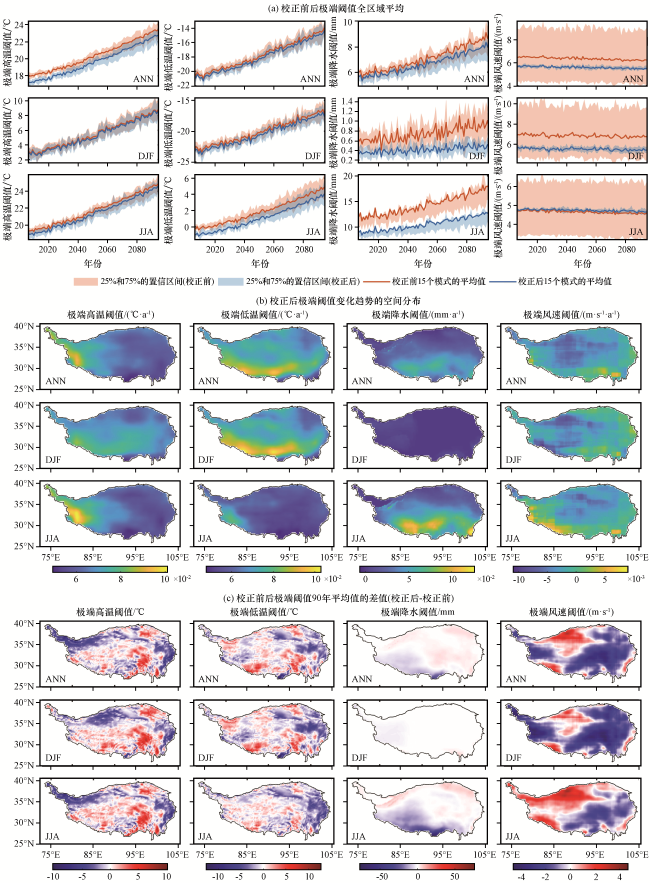
3.3.2 极端值
图6 在RCP8.5情景下, 青藏高原地区2006 -2095年校正前后模式极端阈值的全区域平均(a), 校正后模式的趋势空间分布(b)和校正前后模式的差异场(c)Fig.6 The regional average (a), the trend distribution (b) and the differences (c) between annual/seasonal extreme values of models before and after correction in Qinghai-Xizang Plateau from 2006 to 2095 under the RCP8.5 scenario |