

1 引言
2 资料来源与方法介绍
2.1 资料来源
2.2 方法介绍
3 结果与分析
3.1 我国华北干旱的变化形势
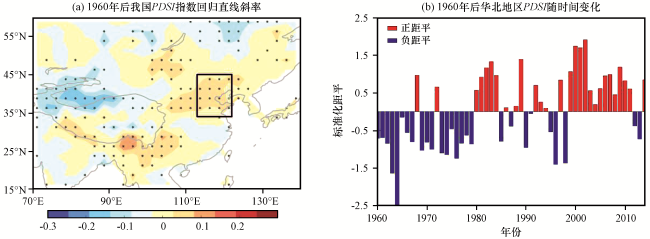
图1 1961 -2014年7 -8月中国大陆PDSI的增长趋势的空间分布(a)和华北地区PDSI指数随时间的变化(b)打点区域通过90%显著性检验 Fig.1 Spatial distribution of PDSI growth trend in China mainland (a) and the change of PDSI index with time in North China (b) in July and August during 1961 -2014.Dotted area has passed the significance test at 90% |
3.2 亚非急流入口区的位置变化特征及其与华北干旱的联系
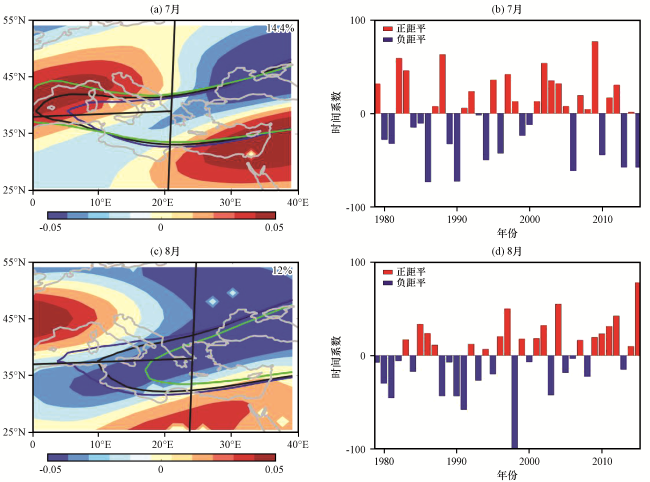
图2 1979 -2015年7月和8月200 hPa U分量的EOF第三模态空间分布(左)及其时间系数(右)(a)和(c)中黑线、 蓝线、 绿线分别为1979 -2015年、 1979 -1997年、 1997 -2015年的亚非急流20 m·s-1的平均位置 Fig.2 The third EOF mode spatial distribution of the 200 hPa U component (left) and its time coefficient (right) in July and August from 1979 to 2015.The black, blue and green lines are the average position of the Asian-African Subtropical Jet at 20 m·s-1 during 1979 -2015, 1979 -1997 and 1997 -2015, respectively |
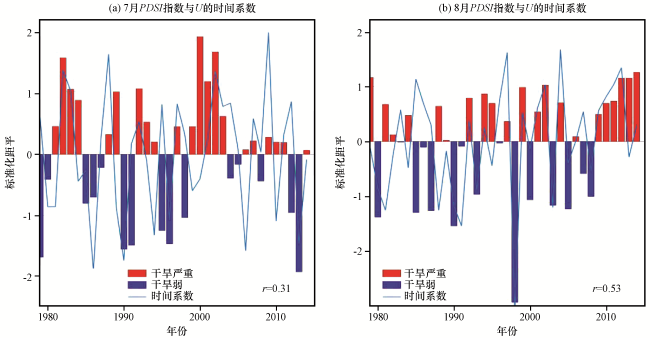
3.3 T-N波作用通量对环流形势的影响
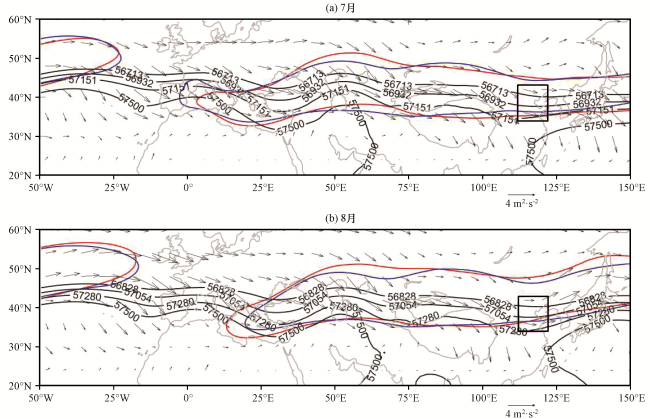
图4 1979 -2015年500 hPa高度场(等值线, 单位: ×10-1 m2·s2)与1979 -2015年200 hPa T-N波作用通量(矢量, 单位: m2·s-2)红线、 蓝线分别为1979 -1997年、 1997 -2015年20 m·s -1平均西风位置 Fig.4 The 500 hPa height field (contour, unit: ×10-1m2·s2) and the 200 hPa T-N wave flux (vector, unit: m2·s-2) in July and August from 1979 to 2015.The red line and the blue line are respectively the average position of 20 m·s-1 of the subtropical westerly jet from 1979 to 1997 and from 1997 to 2015 |
3.4 亚非急流入口区北抬对沿急流波活动的影响
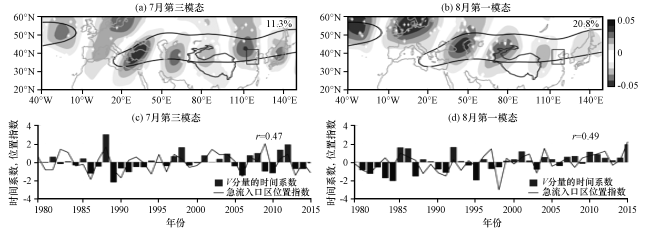
图5 1979 -2015年7月和8月200 hPa V分量EOF第一模态和第三模态的空间分布(a, b)及其时间系数和急流入口区位置指数(c, d)(a)和(b)中黑色线为20 m·s-1西风急流位置 Fig.5 The first and third EOF spatial mode at 200 hPa V component (a, b), the time coefficient and the location index at the entrance of the jet stream (c, d) in July and August of 1979 -2015.The black line shows the position of 20 m·s-1 westerly jet |
3.5 波活动对高度场、 风场、 水汽的影响
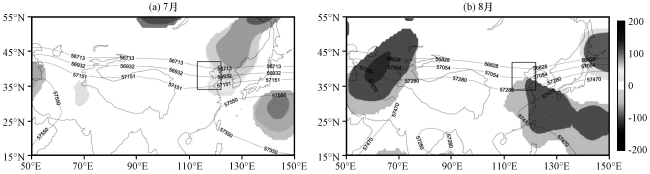
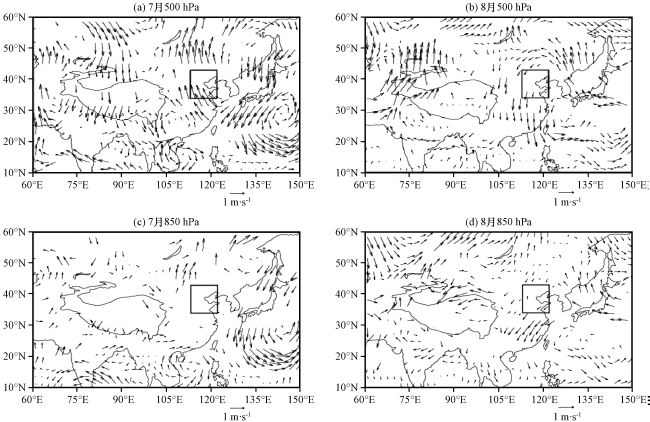
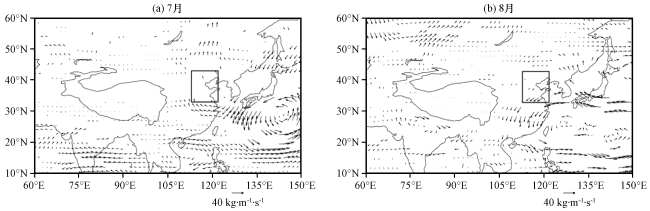
3.6 动能由大西洋上急流出口区向亚非急流的入口区的频散
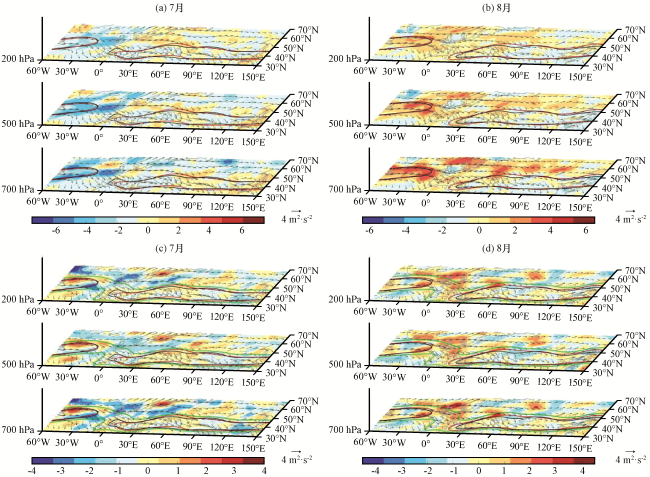


图9 1979 -2015年7月和8月动能的气候态(a, b)及其变化趋势(c, d)(彩色区, 单位: ×10-5 m2·s-2)矢量为T-N波作用通量, 红线和黑线分别为1979 -1997年、 1997 -2015年20 m·s-1平均西风位置 Fig.9 Climatic state (color area) of kinetic energy (a, b) and the trend of energy change (c, d) in July and August from 1979 to 2015.Unit: ×10-5 m2·s-2.Vector is T-N wave flux, The red line and the black line are respectively the average position of 20 m·s-1 of the subtropical westerly jet from 1979 to 1997 and from 1997 to 2015 |