
1 引言
2 数据来源与方法介绍
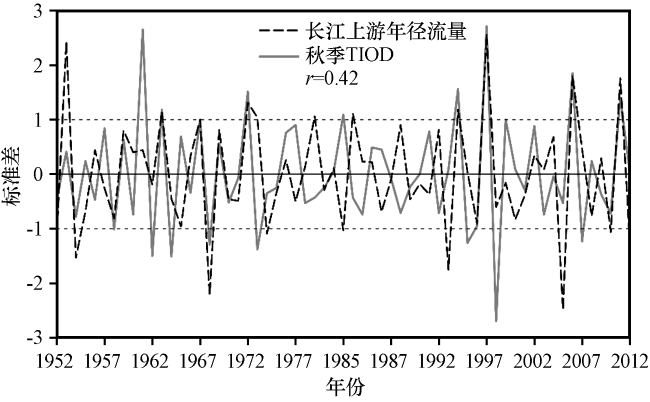
3 长江上游年径流量的振荡特征及其与秋季TIOD的变化关系
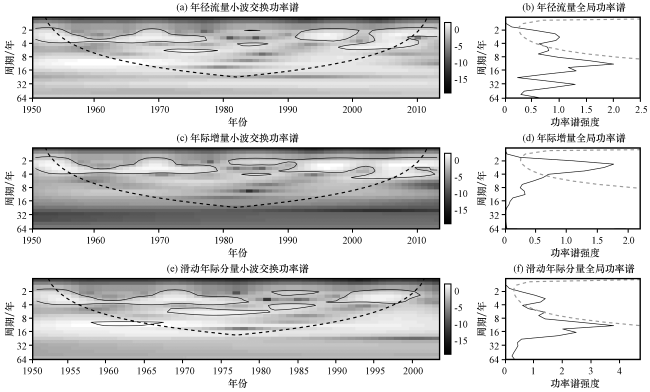
图2 长江上游宜昌站标准化年径流量、 年际增量和滑动年际分量的小波交换功率谱(左)和全局功率谱(右)分布左列图中, 黑色实线内的阴影部分表示通过95%信度显著性的红噪声标准谱检验区域, 虚点线表示影响锥曲线(COI), 在该曲线以外的功率谱受边界效应影响而不予考虑; 右列图中的实(虚)线表示小波全局功率谱(95%显著性水平的标准谱) Fig.2 Morlet wavelet power spectrum (left) and global wavelet spectrum (right) of standard annual runoff, incremental runoff and sliding interannual component of runoff in the Upper Yangtze River from 1952 to 2013.In the left column diagram, the shaded area inside the black solid line indicate red noise standard spectrum passing the 95% confidence level, and the dotted line indicates COI (cone of influence), the area outside which would not be considered for boundary effect.In the right column diagram, solid (dotted) line indicates global wavelet spectrum (standard spectrum passed 95% significance level), the abscissa is for spectrum value and the ordinate is for period |
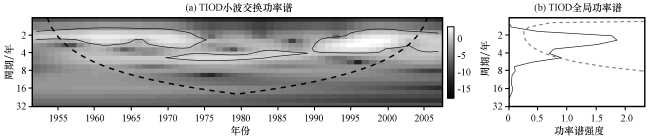
图4 1952 -2013年秋季TIOD标准化年际增量的小波交换功率谱(a)和全局功率谱(b)分布图(a)中黑色实线内的阴影部分表示通过95%信度显著性的红噪声标准谱检验区域, 虚点线表示影响锥曲线(COI), 在该曲线以外的功率谱受边界效应影响而不予考虑; 图(b)中的实(虚)线表示小波全局功率谱(95%显著性水平的标准谱) Fig.4 The Morlet wavelet power spectrum (a) and global wavelet spectrum (b) of standard annual increment of TIOD in autumns from 1952 to 2013.In Fig.4(a), the shaded area inside the black solid line indicate red noise standard spectrum passing the 95% confidence level, and the dotted line indicates COI (cone of influence), the area outside which would not be considered for boundary effect.In Fig.4(b), solid (dotted) line indicates global wavelet spectrum (standard spectrum passed 95% significance level) |
4 秋季TIOD对长江上游年径流量的影响分析
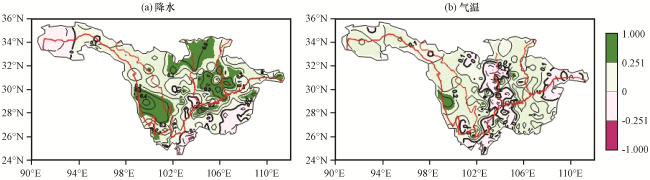
图6 1971 -2012年秋季TIOD年际增量与次年长江上游地区年降水量(a)、 年平均气温(b)年际增量的相关系数场黑色等值线为相关系数值; 彩色阴影(±0.251)表示通过90%显著性水平检验 Fig.6 Correlation coefficient field between the annual increment of autumn TIOD and the annual precipitation (a) and annual average temperature (b) of the following year in the upper reaches of the Yangtze River from 1971 to 2012.The black solid line is the correlation coefficient value, and the color area (±0.251) has passed the 90% confidence significance test |
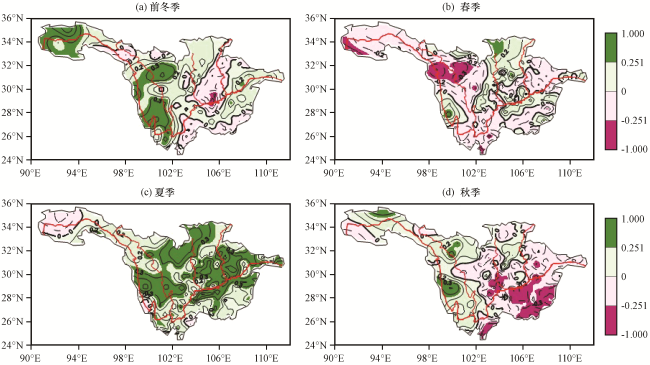
图7 1971 -2012年秋季TIOD年际增量与次年前冬(a)、 春(b)、 夏(c)和秋(d)季长江上游地区降水量年际增量的相关系数场黑色等值线为相关系数值, 彩色阴影(±0.251)为通过90%显著性水平检验 Fig.7 Correlation coefficient field between the annual increment of autumn TIOD and precipitation in pre-winter (a), spring (b), summer (c) and autumn (d) of the following year in the upper reaches of the Yangtze River from 1971 to 2012.The black solid line is the correlation coefficient value, and the color area (±0.251) has passed the 90% confidence significance test |
表1 1971-2013年长江上游年径流量和各季节径流量Table 1 Annual and seasonal runoff of the upper Yangtze River from 1971 to 2013 |
| 时间 | 前冬 | 春季 | 夏季 | 秋季 | 年总量 |
|---|---|---|---|---|---|
| 径流量/m3 | 14301.88 | 22085.02 | 72233.53 | 51191.49 | 159811.9 |
| 所占比例/% | 8.9 | 13.8 | 45.1 | 32.0 | 100 |
5 秋季TIOD对长江上游降水的影响机理分析
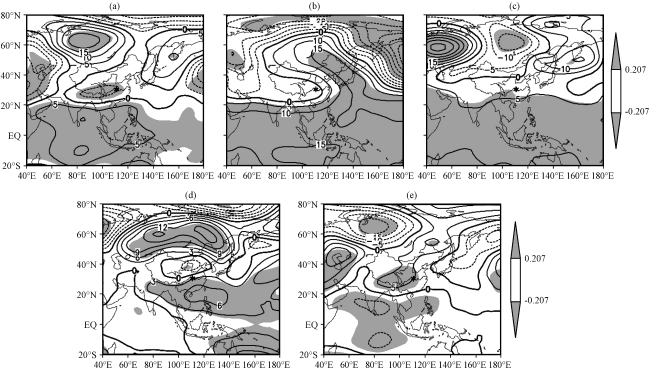
图8 1952 -2013年TIOD秋季年际增量与同期秋季(a)、 次年前冬(b)、 春(c)、 夏(d)和秋季(e)500 hPa高度增量的回归系数场(等值线, 单位: gpm·℃-1)灰色阴影部分表示回归系数通过90%显著性水平检验; 黑色*为宜昌水文站的位置 Fig.8 Regression coefficient field (contour, unit: gpm·℃-1) between annual increment of autumn TIOD and geopotential height over 500 hPa in autumn of the corresponding year (a) and pre-winter (b), spring (c), summer (d) and autumn (e) of the following year from 1952 to 2013.The gray shaded area is for coefficient passing 90% significance test; Black * is the location of Yichang station |
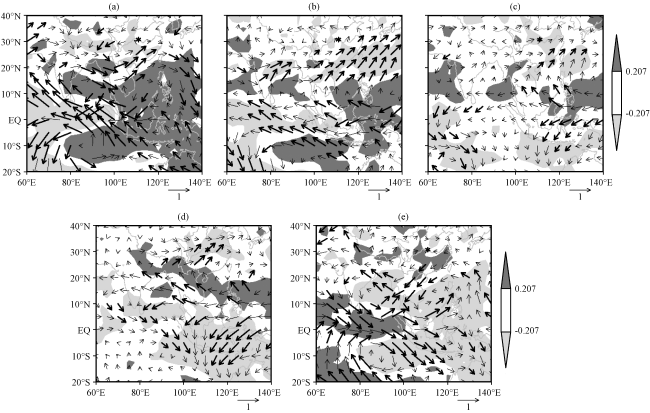
图9 1952 -2013年TIOD秋季年际增量与同期秋季(a)、 次年前冬(b)、 春(c)、 夏(d)和秋季(e)的整层水汽通量(矢量)及水汽通量散度增量(阴影)的相关系数场灰色阴影部分表示通过90%显著性检验的水汽通量散度增量相关系数; 加粗矢量表示通过了90%的显著性水平检验 Fig.9 Regression coefficient field between annual increment of autumn TIOD and water vapor flux (vector) and water vapor flux divergence (the shaded)of the whole layer in autumn of the corresponding year (a) pre-winter (b), spring (c), summer (d) and autumn (e) in the following year from 1952 to 2013.The gray shaded area indicates water vapor flux divergence regression coefficient passing 90% significance test; Solid vector indicate the water vapor flux regression coefficient passing 90% significance test |
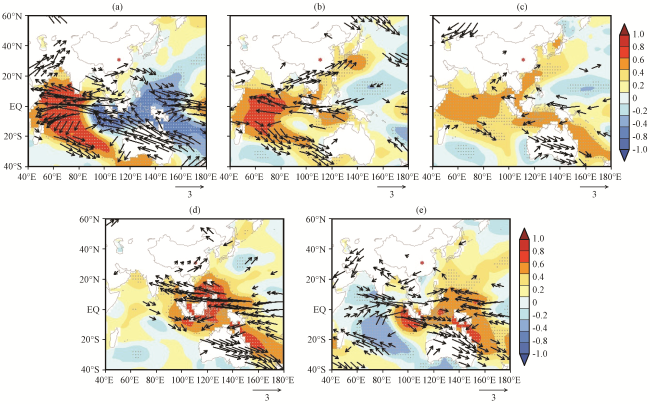
图10 1952 -2013年秋季TIOD年际增量与同期秋季(a)、 次年前冬(b)、 春(c)、 夏(d)和秋季(e)的海温(彩色区, 单位: ℃)、 700 hPa风场增量(矢量, 单位: m·s-1·℃-1)的回归系数场矢量700 hPa风场增量回归系数均通过了90%显著性检验; 灰点表示通过90%显著性检验的海温增量回归系数; 红点为宜昌水文站的位置 Fig.10 Regression coefficient field between annual increment of autumn TIOD and Geopotential Height over Sea Surface Temperature (SST) (color area, unit: ℃) and wind field over 700 hPa (vector, unit: m·s-1·℃-1) in autumn of the corresponding year (a) and pre-winter (b), spring (c), summer (d) and autumn (e) of the following year from 1952 to 2013.Vector indicates regression coefficient value of wind passing 90%significant test; The grey dotted indicates SST passing 90% significance test; Red spot is the location of Yichang hydrological station |
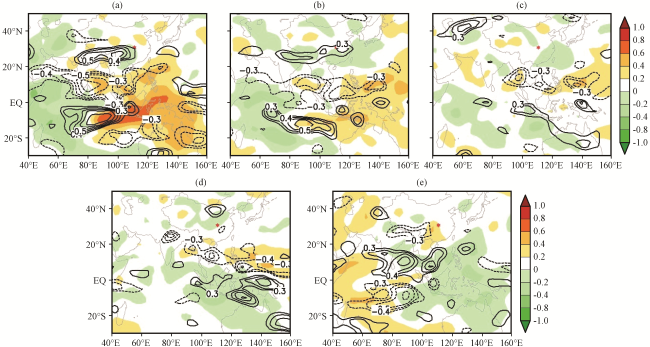
图11 1952 -2013年秋季TIOD年际增量与同期秋季(a)、次年前冬(b)、春(c)、夏(d)和秋季(e)的500 hPa垂直速度(彩色区)和涡度(等值线)的相关系数相关系数都通过了90%显著性水平检验 Fig.11 Correlation coefficient field between annual increment of autumn TIOD and vertical wind speed (color area) and vorticity (contour) over 500 hPa in autumn of the corresponding year (a) and pre-winter (b), spring (c), summer (d) and autumn (e) of the following year from 1952 to 2013. Correlation coefficient value of vorticity and vertical wind speed have passed the 90% significant test |
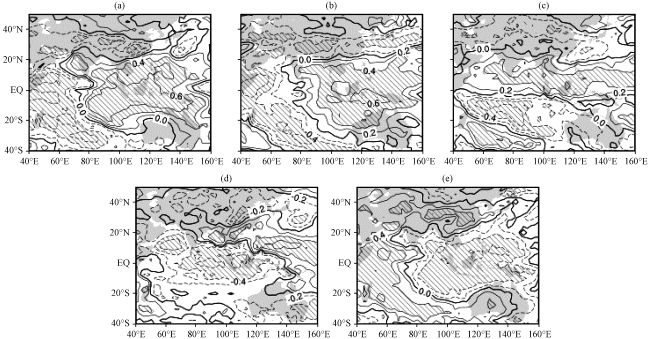
图12 1952 -2013年秋季TIOD年际增量与同期秋季(a)、 次年前冬(b)、 春(c)、 夏(d)和秋季(e)的对外长波辐射(OLR)的相关系数(等值线)斜线区为通过90%显著性性检验的相关区 Fig.12 Correlation coefficient field (contour) between annual increment of autumn TIOD and outgoing long-wave radiation (OLR) in autumn of the corresponding year (a) and pre-winter (b), spring (c), summer (d) and autumn (e) of the following year from 1952 to 2013.The oblique area is for correlation coefficient passing 90% significant test |
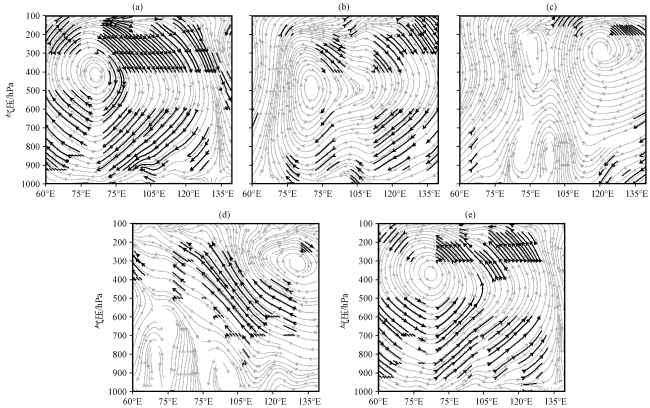
图13 1952 -2013年秋季TIOD年际增量与同期秋季(a)、 次年前冬(b)、 春(c)、 夏(d)和秋季(e)的区域(20°S -20°N)平均纬向风和垂直风速的相关系数黑色加粗流线表示通过90%显著性检验的风矢量相关系数 Fig.13 Correlation coefficient field between annual increment of autumn TIOD and regional mean zonal and vertical wind speed over the region of 20°S -20°N in autumn of the corresponding year (a) and pre-winter (b), spring (c), summer (d) and autumn (e) of the following year from 1952 to 2013.Black bold stream lines indicate correlation coefficient value of wind passing 90% significant test |