
1 引言
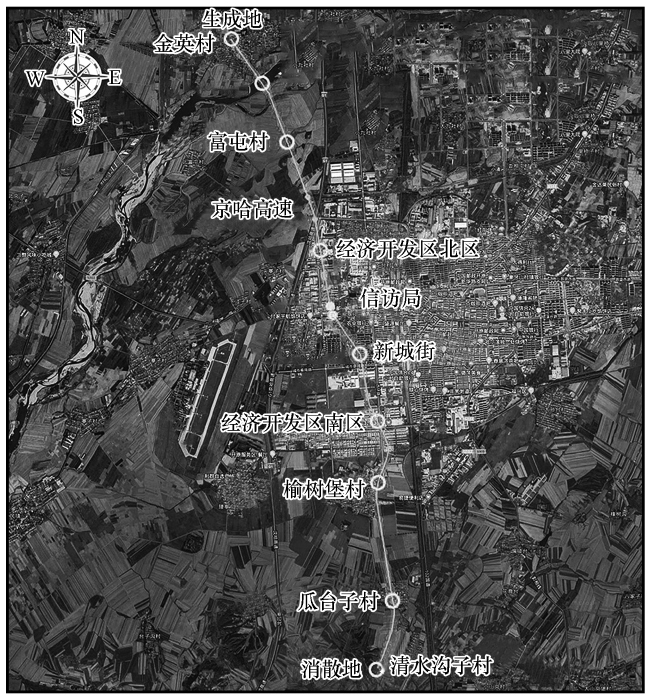
2 天气实况及资料处理方法
3 天气背景分析
3.1 环流背景及天气形势配置
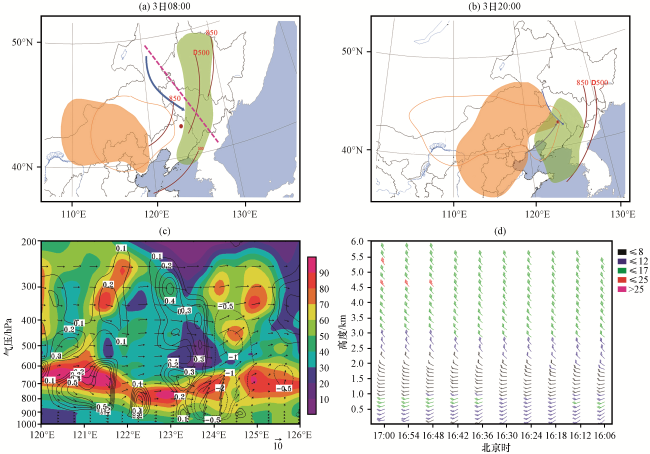
图2 2019年7月3日天气形势及对流条件(a, b)、 垂直剖面(c)及风廓线雷达观测(d)(a)和(b)由实况探空资料绘制, 桔色实线为代表T 850-500≥28 ℃区域, 绿色阴影表示850 hPa比湿≥8 g·kg-1区域, 桔色阴影表示500 hPa T-Td≥20 ℃区域, 蓝色箭头表示500 hPa急流, 灰色箭头表示925 hPa急流; (c)为14:00沿图(a)中粉色虚线作的剖面, 由NCEP再分析资料绘制, 图中填色为相对湿度(单位: %), 等值线为垂直速度ω (单位: Pa·s-1), 风场为沿剖面径向风与-10·ω的合成风(矢量, 单位: m·s-1); (d)为沈阳风廓线雷达观测(单位: m·s-1) Fig.2 Synoptic situation and enbironmental conditions(a, b)、 spatial section(c) and time-height wind profiles(d).Fig.2(a) and (b) are based on atmospheric sounding data, the orange solid line represents the T 850-500 ≥28 ℃ area, the green shade indicates the 850 hPa specific humidity ≥ 8 g·kg-1 area, the orange shade indicates the 500 hPa T-Td ≥20 ℃ area; The blue arrow indicates the 500 hPa jet, and the gray arrow indicates 925 hPa jet.Fig.2(c) is spatial section along the pink dotted line in Fig.2(a), and based on the NCEP reanalysis data, relative humidity(color, unit: %), vertical speed (contour, unit: Pa·s-1), radial wind (vctor,unit: m·s-1); Fig.2(d) is the time-height wind profiles from Shenyang wind profiler from 16:00 to 17:00 (unit: m·s-1) |
3.2 环境参数特征及其变化分析
3.2.1 温湿参量
3.2.2 动力参量
3.2.3 超低空急流的形成及对风暴发展的作用
4 龙卷风暴特征及成因分析
4.1 干线与雷暴出流作用下龙卷风暴的形成
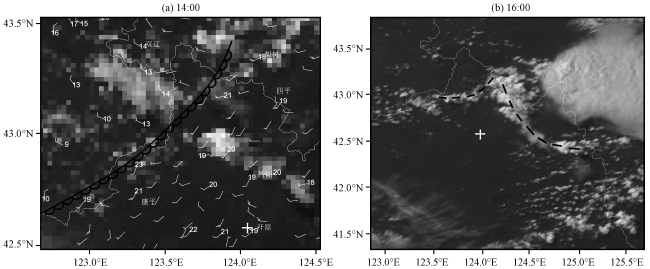
图3 2019年7月3日FY-4A可见光云图(a)中数字和风羽分别为地面自动站观测露点温度(单位: ℃)和风场(单位: m·s-1), 圆弧线为干线; (b)中虚线为地面辐合线, “+”为标注龙卷发生位置 Fig.3 FY-4A visible light cloud image on 3 July 2019.In Fig.3(a), the data and the barb are respectively the dew point temperature (unit: ℃) and wind field (unit: m·s-1) observed by the ground automatic station, the arc line is the trunk line; In Fig.3(b), The dotted line is the ground convergence line, "+" marks the location of the tornado |
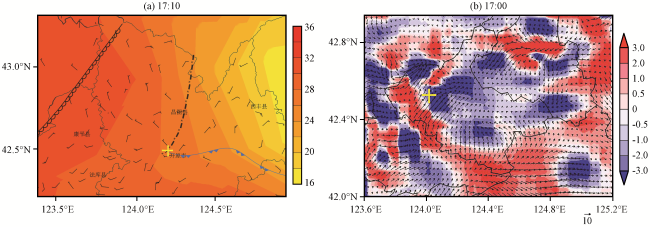
图4 2019年7月3日地面自动站观测温度(填色, 单位: ℃)和风场(风羽, 单位: m·s-1)(a)与多源气象数据格点实况融合产品地面风场(矢量, 单位: m·s-1)和散度场(彩色区, 单位: ×10-4 s-1)(b)(a)中黑色圆弧线为干线, 黑色点划线为地面辐合线, 蓝色线为伪冷锋; (b)中“+”为龙卷发生位置 Fig.4 Observed temperature (color area, unit: ℃) and wind field (barb, unit: m·s-1) at the ground automatic station (a), and the surface wind (vector, unit: m·s-1) and divergence field (color area, unit: ×10-4 s-1) of the product of live fusion with multi-source meteorological data grid field (b) on 3 July 2019.In Fig.4(a), the black arc line is the dry line, the black dotted line is the ground convergence line, and the blue line is the pseudo cold front; In Fig.4(b), the "+" is the location of the tornado |
4.2 超级单体龙卷风暴特征
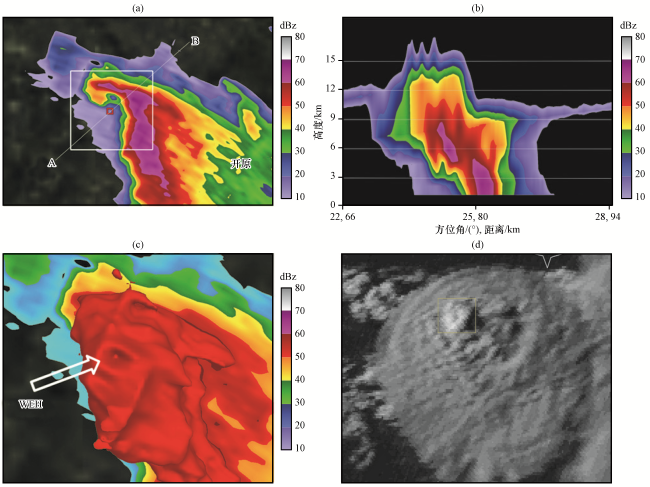
图5 2019年7月3日沈阳雷达反射率因子(a~c)与17:30 FY-4A高分辨率可见光云图(d)(a)为17:29雷达0.5°仰角反射率因子, 红色小方框对应图5(c)中WEH位置; (b)为沿图5(a)中直线A-B的垂直剖面; (c)为(a)中红色小方框区域内的俯视图 Fig.5 Shenyang radar reflectivity factor (a~c) and 17:30 FY-4A high-resolution visible light cloud image (d) on 3 July 2019.Fig.5 (a) is the 17:29 radar reflectivity factor of 0.5° elevation angle, the small red box corresponds to the WEH position in Fig.5 (c); Fig.5 (b) is the vertical section along the line AB in Fig.5 (a); Fig.5 (c) is the top view image of the small red box area |
4.3 龙卷形成机理探究
4.3.1 中气旋形成及演变特征
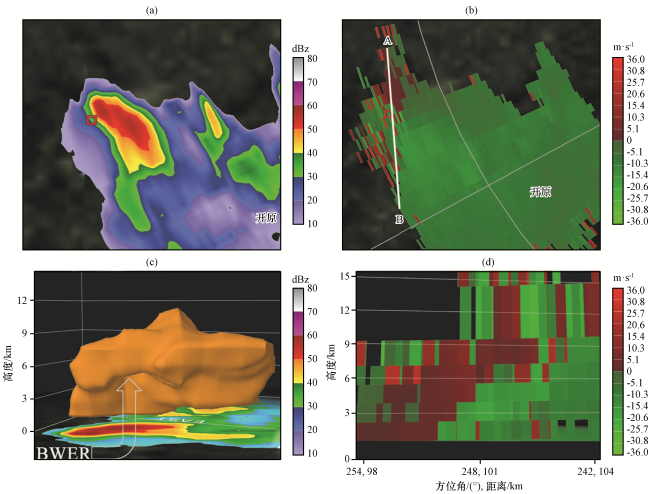
图6 2019年7月3日17:18辽源雷达0.5°仰角反射率因子(a)和45 dBz以上回波反射率因子三维立体图(c)和0.5°仰角径向速度(b)及其沿直线AB的垂直剖面图(d)(a)、 (b)中红色小方框对应(c)中BWER的位置 Fig.6 The reflectivity factor of 0.5° elevation angle (a) and the three-dimensional view of the echo reflectivity factor above 45 dBz (c), and the radial velocity of 0.5° elevation angle (b) with the vertical section along the line AB (d) at 17:18 on 3 July 2019.The red box in Fig.6(a) and (b) corresponds to the position of BWER in Fig.6(c) |