

1 引言
表1 5个CMIP6模式的简介Table 1 Basic information of 5 GCMs from CMIP6 |
| 模式名称 | 所属国家、 研究中心 | 原始分辨率/(°) | 降尺度后分辨率/(°) |
|---|---|---|---|
| CanESM5 | 加拿大气候模拟与分析中心 | ~2.8×2.8 | 0.5×0.5 |
| CNRM-ESM2-1 | 法国国家科学实验中心 | 2.5×1.2676 | 0.5×0.5 |
| IPSL-CM6A-LR | 法国Pierre-Simon 物理学研究所 | 2.5×1.2676 | 0.5×0.5 |
| MIROC6 | 日本海洋地球科学与技术局、 大气海洋研究所和国家环境变化研究所 | 1.4063×1.4 | 0.5×0.5 |
| MRI-ESM2-0 | 德国普朗克气象研究所 | ~1.125×1.12 | 0.5×0.5 |
表2 SSP-RCP情景介绍Table 2 Basic information of SSP-RCPs for CMIP6 |
| 情景名称 | 强迫类别 | SSP(社会经济情景) | 2100年人为辐射强迫(气候情景)/(W·m-2) |
|---|---|---|---|
| SSP1-1.9 | 非常低强迫情景 | SSP1(可持续发展路径) | 1.9 |
| SSP1-2.6 | 低强迫情景 | SSP1(可持续发展路径) | 2.6 |
| SSP2-4.5 | 中等强迫情景 | SSP2(中间路径) | 4.5 |
| SSP3-7.0 | 中等至高强迫情景 | SSP3(区域竞争路径) | 7.0 |
| SSP4-3.4 | 低强迫情景 | SSP4(不均衡路径) | 3.4 |
| SSP4-6.0 | 中等强迫情景 | SSP4(不均衡路径) | 6.0 |
| SSP5-8.5 | 高强迫情景 | SSP5(传统化石燃料为主的路径) | 8.5 |
2 数据来源与方法介绍
2.1 研究区概况
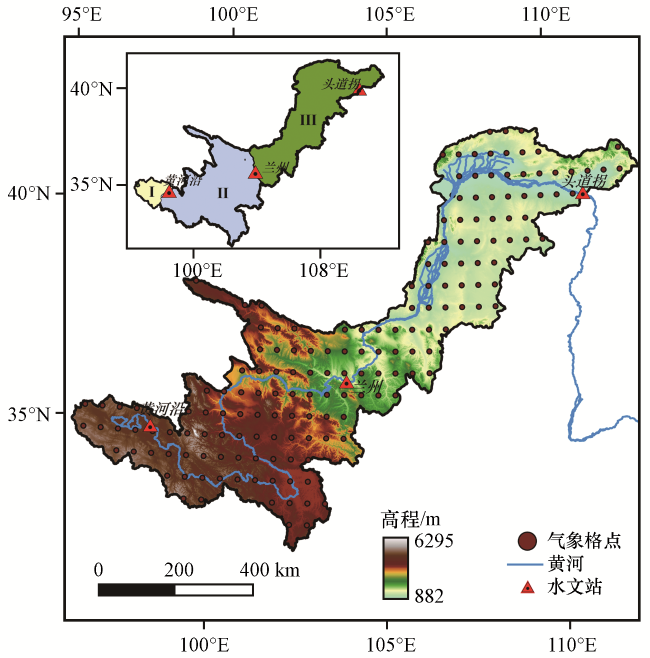
2.2 数据来源
2.3 研究方法
3 研究结果
3.1 模式模拟能力评估
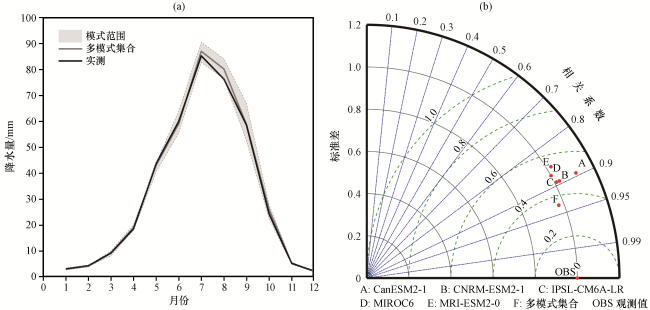
图3 1995 -2014年黄河上游逐月降水观测值与模拟值的逐月变化(a)以及不同气候模式模拟值与观测值的逐月降水泰勒图(b)中黑线代表标准差之比, 绿线代表均方根误差, 蓝线代表相关系数 Fig.3 Monthly variation of observed and simulated precipitation over theUpper Yellow River from 1995 to 2014 (a) and the precipitation Taylor diagram of simulated under different climate models and observed monthly precipitation.The black line represents the ratio of standard deviations, the green line represents the root mean square error, and the blue line represents the correlation coefficient |
3.2 SSP-RCP情景下的预估
3.2.1 年降水量的时空变化
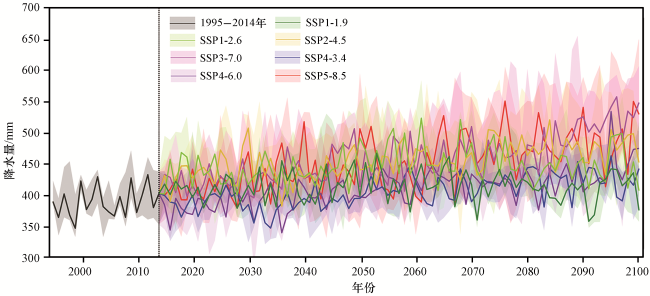
图4 不同SSP-RCP情景下, 1995 -2100年黄河上游年降水量变化实线表示多模式集合平均, 阴影表示多个模式的范围(上限和下限) Fig.4 The mean of muilt-model annual precipitation changes under different SSP RCP scenarios from 1995 to 2100 over the Upper Yellow River.Solid lines represent the multi-model mean.Shadows represent the range (upper and lower limits) of multiple models |
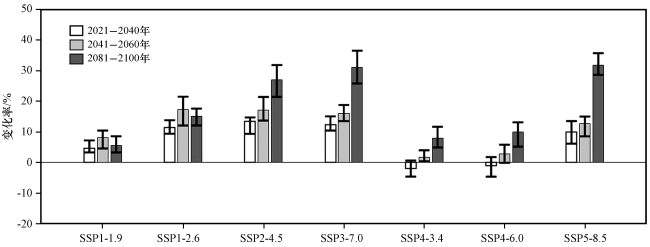
图5 不同SSP-RCP情景下, 21世纪近期、 中期和末期黄河上游年降水相对基准期(1995 -2014年)的变化率柱子代表多模式集合平均, 上、 下限代表模式最大值和最小值 Fig.5 The change rate of annual precipitation in the near, mid- and end 21st century over the Upper Yellow River under the SSP-RCP scenarios relative to the base period (from 1995 to 2014).Bars represent the multi-model mean, The upper and lower limits represent the maximum and minimum values of multiple models |
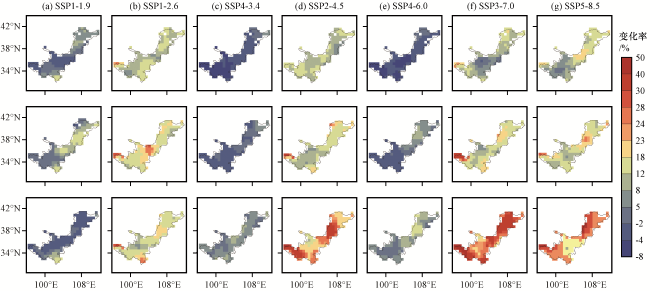
图6 不同SSP-RCP情景下, 2021 -2040年(上), 2041 -2060年(中)和2081 -2100年(下)黄河上游年降水量相对于基准期(1995 -2014年)的空间变化分布Fig.6 Spatial distribution of the annual precipitation under different SSP-RCP scenarios during 2021 -2040 (up), 2041 -2060 (middle) and 2081 -2100 (down) over the Upper Yellow River relative to the base period (1995 -2014) |
3.2.2 季节降水的时空变化
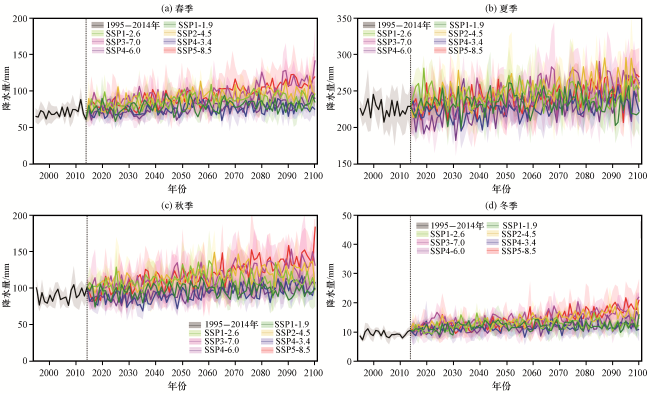
图7 不同SSP-RCP情景下, 1995 -2100年黄河上游季节降水量的变化实线表示多模式集合平均, 阴影表示多个模式的范围(上限和下限) Fig.7 The seasonal precipitation changes under different SSP-RCP scenarios during 1995 -2100 over the Upper Yellow River.Solid lines represent the multi-model mean.Shadows represent the range (upper and lower limits) of multiple models |
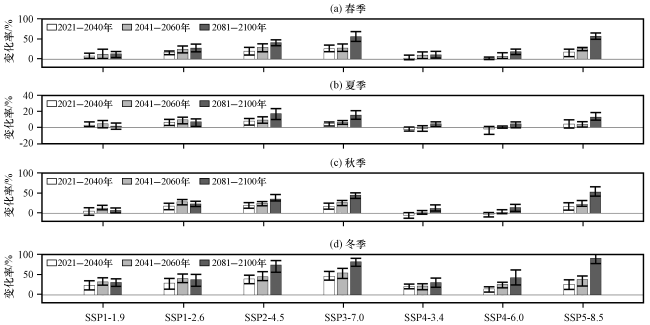
图8 不同SSP-RCP情景下, 黄河上游2021 -2040年, 2041 -2060年和2081 -2100年季节降水量相对基准期(1995 -2014年)的变化柱子代表模式集合平均, 上、 下限代表模式的最大值和最小值 Fig.8 Seasonal precipitation changes over the Upper Yellow River during 2021 -2040, 2041 -2060 and 2081 -2100 relative to the base period (1995 -2014) under different SSP-RCP scenarios.Bars represent the multi-model mean, the upper and lower limits represent the maximum and minimum values of multiple models |
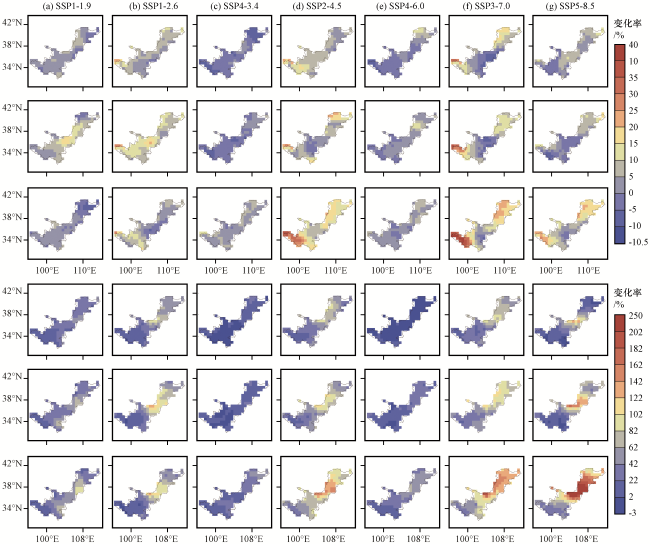


图9 不同SSP-RCP情景下, 黄河上游2021 -2040年(第1行, 第4行), 2041 -2060年(第2行, 第5行)和2081 -2100年(第3行, 第6行)夏季(第1~3行)和冬季(第4~6行)降水量相对基准期(1995 -2014年)变化率的空间分布Fig.9 Spatial variability of precipitation under different SSP-RCP scenarios in summer (rows 1~3) and winter (rows 4~6) during 2021 -2040 (rows 1 and 4), 2041 -2060 (rows 2 and 5) and 2081 -2100 (rows 3 and 6) over the Upper Yellow River relative to the base period (1995 -2014) |