

1 引言
双线偏振多普勒天气雷达通过发射水平和垂直两路电磁波信号, 不仅可以探测到气象目标物基本反射率因子Z、 平均径向速度V及速度谱宽W等信息, 还可以探测到差分反射率Z DR、 差分相移Φ DP、 差分相移率K DP、 相关系数CC等双偏振参数。不同尺寸的冰雹、 不同尺寸的雨滴及非气象目标物等对应不同的双偏振参数特征值, 对这些参数特征值进行分析、 反演, 可以进一步识别降水粒子的形状大小、 空间取向、 相态分布以及降水类型等更为实用的信息(Bigg, 1953; Johnson and Hallett, 1968; Bringi et al, 1996; Hubbert et al, 1998; Picca and Ryzhkov, 2012; Kumjian, 2013a, 2013b; Dawson et al, 2014)。美国双偏振雷达操作课程(Dual-Polarization Radar Operations Course, Version 1109)中指出, 冰雹(包括冰雹与雨滴的混合物)的Z DR值在-2.0~6.0 dB、 CC值在0.80~0.97; 雨滴的Z DR值在0.0~5.0 dB、 CC值>0.97; 地物杂波、 昆虫、 鸟类等非气象目标物的ZDR值范围比冰雹Z DR值范围还要大, 但CC较小, 基本<0.7。
Z DR柱是指1 dB或1.5 dB以上Z DR伸展到环境0 ℃层高度以上的区域, 与上升气流区相对应(美国Dual-Polarization Radar Operations Course)。20世纪80年代, Hall et al(1980, 1984)首先通过双偏振多普勒天气雷达观测到Z DR柱的存在。Illingworth et al(1987)首先对观测到的Z DR柱进行了较为细致的分析, 认为Z DR柱可能包含稀疏的直径>4 mm的雨滴。Caylor and Illingworth(1987)得出的结论是对于异常大的Z DR唯一可靠的假设是大滴的存在, 他们认为超大尺寸的凝结核可以起到这种作用, 并开发了一个模式来验证他们的假设, 模拟出的Z DR值比实际观测值偏大。Tuttle et al(1989)对一次Z DR柱在0 ℃层以上延伸超过3 km的暖云降水风暴分析表明, 25~30 m·s-1的上升气流速度与成熟的Z DR柱密切相关, 上升气流减弱与Z DR柱收缩同时发生。Conway and Zrnic (1993)通过分析一次超级单体风暴Z DR柱形成和冰雹的生长轨迹发现, 融化层之下, Z DR柱由大雨滴组成, 融化层之上Z DR柱包含由过冷却雨滴、 水包膜的冰粒子、 湿的扁球结构和球形结构冰粒组成的混合物。Ryzhkov et al(1994)认为, Z DR柱可识别发展中的对流风暴的冰雹增长区域, 同时还可以用以定位上升气流区。 一些数值模式对ZDR柱模拟研究的共识是, ZDR柱内包含大的雨滴和尺寸较小的湿的冰粒子(Snyder et al, 2010; Ryzhkov et al, 2011; Kumjian et al, 2012)。Kumjian et al(2014)利用希伯来大学云模式(HUCM- Hebrew University Cloud Model)模拟分析了深对流风暴Z DR柱演变, 成熟阶段Z DR柱低层(0 ℃层以下高度)主要是大的雨滴, 0 ℃层之上随着高度的增大, 依次是冻雨滴、 冰雹粒子为主; Z DR柱的高度与上升气流存在正相关关系, Z DR柱的高度可以作为判别风暴强度的指标之一; 强冰雹与Z DR柱的高度存在明显的滞后的正相关, 因此, Z DR柱可作为预警强对流风暴产生冰雹的工具之一。
国内在双偏振天气雷达应用方面也做了大量研究工作, 取得了一些研究成果, 主要集中在数据质量控制(李喆等, 2014; 赵世颖等, 2015; 吴林林等, 2015; 杜牧云等, 2013, 2019; 胡志群等, 2014; 曹杨等, 2016; 马建立等, 2019; 王超等, 2019)、 水凝物分类(刘黎平和钱永甫, 1996; 曹俊武和刘黎平, 2007; 梅垚等, 2018; 杨忠林等, 2019)和强对流风暴的偏振特征(张鸿发等, 2001; 张廷龙等, 2012; 张学泰等, 2017; 张羽等, 2017; 温静, 2017)等领域。对于Z DR柱分析的相关文献较少, 王洪等(2016)以Rayleigh-Gans散射为基本原理, 采用云微物理参数化方案输出量及云降水粒子的统计结果作为输入值, 构造一个S波段双线偏振雷达模拟器, 将数值模式和双线偏振雷达有机地结合起来, 成功模拟出成熟阶段飑线Z DR柱的特征, Z DR柱对应雨水混合比大值中心, 并伴随着约15 m·s-1的上升气流。王洪等(2018)在分析华南一次超级单体风暴时也发现在上升气流区附近存在一条“差分反射率柱”, 宽约5 km, 垂直扩展到6 km高度 (-8 ℃层高度)。
济南双偏振多普勒天气雷达(SA)于2018年底进行业务试运行, 2019年5月10日和8月16日两次较强的强对流过程有完整的观测资料。本文基于济南双偏振雷达资料, 结合地面实况, 对两次强对流过程中的2个长寿命超级单体的风暴参数及Z DR柱演变特征进行了初步分析, 以期在类似强风暴预警业务中有所启示。
2 实况与环境物理量
受低涡切变线影响, 2019年5月10日14:00(北京时, 下同) -21:00, 山东聊城、 济南、 泰安、 济宁与菏泽等地出现雷阵雨天气, 局部出现冰雹和雷暴大风。此次强对流天气过程中出现一长寿命超级单体风暴(下称0510风暴), 移动过程中在聊城的东昌府区和茌平县、 济南长清区和平阴县、 泰安的肥城市等地造成冰雹灾害, 其中平阴县安城和肥城市王瓜店出现直径超过20 mm的大冰雹天气, 3个区域站出现>20 mm·h-1短时强降水, 最大24.2 mm, 出现在平阴县安城炮点区域站, 仅有一站出现大风天气, 18:28出现在安城炮点区域站, 极大风速25.4 m·s-1。
受西风槽影响, 2019年8月16日02:00 -10:00, 山东北部及河北西南部衡水一带出现雷阵雨天气, 局部出现冰雹和雷暴大风。此次强对流天气过程中也出现一长寿命超级单体风暴(下称0816风暴), 移动过程在河北衡水和景县、 德州的陵县和临邑、 济南的济阳区造成冰雹天气, 其中临邑和济阳境内出现直径超过20 mm的大冰雹天气, 5个区域站出现>20 mm·h-1短时强降水, 最大32.4 mm, 出现在临邑县境内, 仅有一站出现8级大风天气, 05:27出现在河北景县境内, 极大风速20 m·s-1。
两次强对流天气章丘和邢台探空资料计算的环境物理量见表1, 5月10日分别用08:00邢台和章丘探空订正到14:00强对流区域, 10日14:00聊城、 东阿、 平阴、 肥城的气温和露点分别是27 ℃和14 ℃、 27 ℃和13 ℃、 26 ℃和11 ℃、 26 ℃和10 ℃, 低层最大比湿指925 hPa或850 hPa两个高度的最大值。可以看出, 5月10日08:00 850 hPa与500 hPa温差(ΔT)较大, 温差超过30 ℃, 具有强的热力不稳定, 0~6 km具有中等强度垂直风切变(Wsr), 但抬升指数(LI)为正, CAPE为0 J·kg-1, 不利于雷暴产生, 订正到午后的LI和CAPE值非常利于雷暴的产生; 20:00与08:00对比表明, 500 hPa风向由西南风转为西偏北风, 风速不大, 相对风暴螺旋度(SRH)由负值转为正值。8月15日20:00 850 hPa与500 hPa温差(ΔT)较大, 温差超过30 ℃, 具有强的热力不稳定, 0~6 km具有中等强度垂直风切变(Wsr), LI在-5 ℃以下, CAPE具有中等强度值, 利于雷暴产生; 08:00与20:00对比表明, 500 hPa西北风风速明显增大, 同时相对风暴螺旋度(SRH)也具有较大值。
表1 两次强对流天气过程中章丘和邢台探空资料计算的环境物理量Table 1 The environmental physical parameters calculated by sounding data of Zhangqiu and Xingtai in two severe convective weather |
| 日期 | 时次 | ΔT/℃ | LI/℃ | CAPE/(J·kg-1) | Wsr/(m·s-1) | 500 hPa风速, 风向 /[m·s-1, (°)] | 低层最大 比湿 /(g·kg-1) | 0 ℃, -10 ℃, -20 ℃层 /km | SRH/(m2·s-2) |
|---|---|---|---|---|---|---|---|---|---|
| 2019-05-10 | 08:00(章丘) | 30 | -8.0~-4.2* | 1200~2460* | 14.7 | 15, 250 | 8 | 2.9, 4.4, 5.9 | -34 |
| 2019-05-10 | 20:00(章丘) | 31 | -0.1 | 0 | 14.2 | 8, 315 | 7 | 3.1, 4.4, 5.8 | 110 |
| 2019-05-10 | 08:00(邢台) | 31 | -7.6~-3.8* | 1100~2430* | 2.3 | 5, 270 | 6 | 2.9, 4.4, 5.9 | -46 |
| 2019-05-10 | 20:00(邢台) | 31 | -2.7 | 420 | 7.1 | 10, 290 | 3.2 | 3.2, 4.6, 6.0 | -2 |
| 2019-08-15 | 20:00(邢台) | 35 | -7.7 | 1869 | 16.8 | 12, 310 | 7 | 4.5, 5.8, 7.6 | 73 |
| 2019-08-16 | 08:00(邢台) | 22 | 2.0 | 240 | 22.5 | 25, 310 | 8 | 4.8, 6.3, 7.4 | 233 |
| 2019-08-15 | 20:00(章丘) | 31 | -5.1 | 960 | 14.3 | 13, 315 | 10 | 4.5, 5.9, 7.4 | -75 |
| 2019-08-16 | 08:00(章丘) | 26 | -0.4 | 70 | 31.7 | 28, 285 | 9 | 4.3, 5.9, 7.6 | 263 |
*表示订正后的LI和CAPE数据 |
3 Z DR柱的识别
3.1 PPI特征
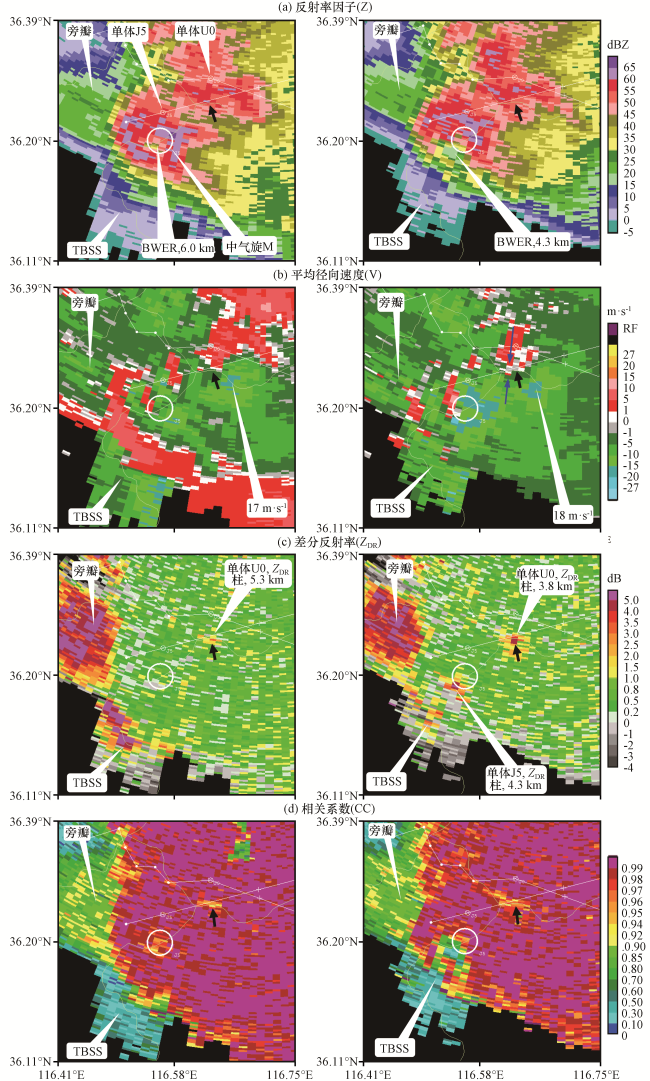
图1 2019年5月10日18:18济南雷达6.0°仰角(左)和4.3°仰角(右)的反射率因子Z(a)、 平均径向速度(b)、 差分反射率(c)和相关系数(d)黑色箭头指示为Z DR柱区; 蓝色箭头表示速度径向辐合 Fig.1 Base reflectivity Z (a), base velocity V (b), differential reflectivity Z DR (c), correlation coefficient CC (d) at 6.0° (left) and 4.3° (right) elevation from Jinan radar at 18:18 on 10 May 2019.The black arrow is Z DR column area, the blue arrow indicates the radial convergence of velocity |
图1(b)是6.0°和4.3°平均径向速度产品, 可以看出, 单体J5南侧白色圆圈处存在明显的气旋性旋转气流, 对应高度分别是6.0和4.3 km; 通过计算可知, 单体J5在1.5°、 2.4°、 3.3°、 4.3°和6.0°仰角上中气旋对应的最大速度差绝对值分别是17、 28.5、 36.5、 31.5和21.5 m·s-1, 最大旋转速度达到18 m·s-1左右, 属于中等强度的中气旋。6.0°和4.3°仰角上单体U0南侧表现为径向速度的辐合(蓝色箭头所示), 对应高度分别是5.3 km和3.8 km, 辐合区径向上最大速度差分别为21 m·s-1和18 m·s-1。因此, 单体J5中层表现为气旋性旋转气流结构, 中气旋达到中等强度, 而单体U0表现为明显的中层径向辐合上升气流结构。
图1(c)是Z DR产品, 6.0°与4.3°仰角对比可知, 单体U0在6.0°与4.3°仰角辐合上升区都存在明显的Z DR大值区, 6.0°仰角上Z DR最大值约2 dB, 对应高度5.3 km, 4.3°仰角同一区域Z DR大值区明显大于上层仰角, 最大值约4.5 dB, 对应高度为3.8 km。单体J5在4.3°仰角白色圆圈的南侧存在明显的Z DR大值区(对应高度4.3 km), 最大值约5 dB, 而6.0°仰角上同一位置上Z DR较小, 基本在-0.5~1.0 dB。由此可知, 环境0 ℃层高度(2.9 km)以上单体J5和U0强上升气流区内存在明显的Z DR大值区, 这种0 ℃层高度以上的Z DR大值区即为Z DR柱。以Z DR≥1.5 dB为阈值, 单体J5的ZDR柱顶部在4.3 km之上6.0 km之下, 取其高度差的一半, 其顶部高度约为5.1 km; 单体U0的ZDR柱顶部在6.0°仰角, 高度约5.3 km。单体J5和U0的Z DR柱顶部介于环境-10 ℃和-20 ℃层高度之间, 分别高出0 ℃层高度约2.2和2.4 km。
图1(d)是CC产品, 结合Z和Z DR产品可以看出, 6.0°仰角单体U0的Z DR≥1.5 dB区域相对应的Z在49~56 dBZ, CC在0.92~0.96, 环境-10 ℃层高度之上ZDR大值区对应强的反射率因子和偏低的CC; 4.3°仰角单体U0的Z DR≥1.5 dB区域相对应的Z在44~56 dBZ, CC在0.92~0.97。6.0°仰角单体J5的 BWER内对应的反射率因子Z在33~43 dBZ, 回波强度较弱, 同时ZDR较小, CC偏低(0.92~0.97); 4.3°仰角单体J5的Z DR≥1.5 dB区域对应的Z在18~46 dBZ, 回波强度较弱, CC较小(0.25~0.93)。
3.2 垂直剖面(VCS)特征
图2是0816风暴强盛阶段济南雷达06:49时次组合反射率(CR)产品和Z、 Z DR、 CC的垂直剖面(VCS)产品图像, 剖面是沿图2(a)中穿过中气旋的白色直线, 剖面产品上的蓝色直线自下而上分别是0 ℃、 -10 ℃和-20 ℃层高度, 图2(e)是放大后的Z、 Z DR、 CC的垂直剖面。从图2中可以看出, 反射率因子剖面上低层有弱回波区, 中层存在有界弱回波区(BWER), -20 ℃层高度以上有强的回波悬垂, 为典型强冰雹云特征[图2(b)]。Z DR剖面图上, 环境0 ℃层以上高度存在明显的Z DR大值区[图2(e)黑色虚线框, 宽度约5 km], 垂直方向上Z DR最强(1.5 dB)处伸展到-10 ℃层高度以上并接近-20 ℃层高度, 达到6.8 km, 对应的反射率因子在50~56 dBZ, CC在0.95~0.965。0 ℃层以上高度Z DR大值区与BWER区域基本对应, 表明Z DR大值区位于强的气旋性旋转上升气流区内。 Z DR柱右侧强反射率因子≥60 dBZ区(黑色折线区域)对应的Z DR较小, 基本在-0.3~0.2 dB, 说明冰雹粒子尺寸平均状态基本呈球形, 对应的CC在0.86~0.985。同时还可以分析出, Z DR柱的上方有明显的强回波悬垂, ≥55 dBZ的强反射率因子顶部达到10 km高度[图2(e)], 也就是说在环境-20 ℃层高度至 -35 ℃层高度之间存在55 dBZ以上的反射率因子, 对应着冰雹粒子形成和增长区域, 而在ZDR柱的右侧较大范围的强反射率因子对应着冰雹下降区域。
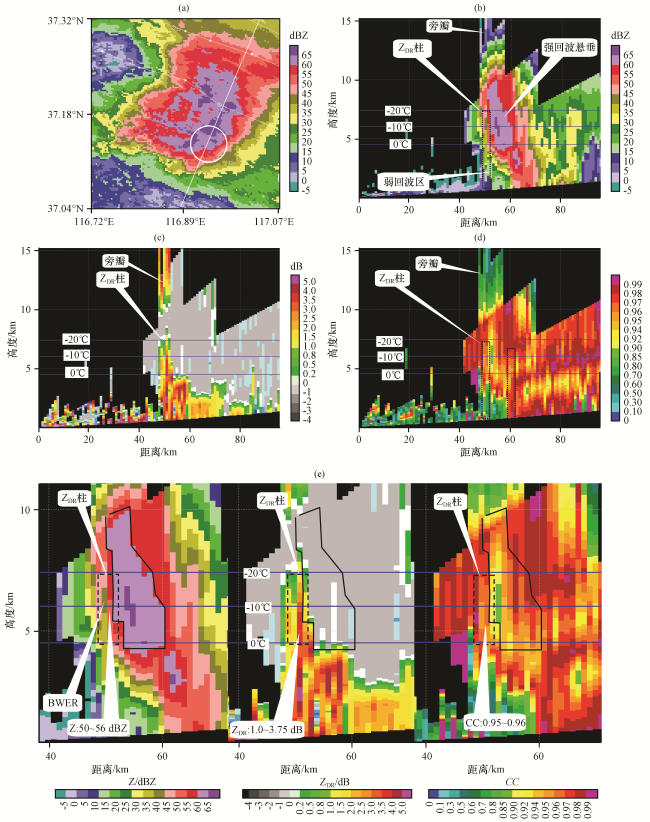
图2 2019年8月16日06:49济南雷达组合反射率(a)和沿(a)中白色直线作的Z剖面(b)、 Z DR剖面(c)、 CC剖面(d)以及放大后的Z、 Z DR和CC剖面合成产品(e)Fig.2 Combined reflectivity (a)and Vertical section of Z(b), Z DR(c), CC(d) along the white line in Fig.2(a), and enlarged composite diagram of Z, Z DR, CC(e) from Jinan radar at 06:49 on 16 August 2019 |
上述PPI和VCS剖面特征分析可知, 两个超级单体风暴0510和0816的Z DR柱都位于有界弱回波区内靠近强回波墙的一侧, 与强的气旋性旋转上升气流相关联, Z DR柱位置与Kumjian and Ryzhkov(2008)及Hubbert et al(2018)所分析的超级单体风暴概念模型中Z DR柱位置基本一致。Z DR柱内Z DR最大值均在3.7 dB以上, 最大可达5 dB。Z DR柱内对应的反射率因子较弱, 基本≤56 dBZ, 同时CC偏低, 基本≤0.97。Brandes et al (1995)和 Loney et al (2002)所做的飞机观测证实, Z DR内存在少量直径>2 mm的雨滴及少许包有水膜的冰雹。Hubbert et al(2018)分析表明, 4 dB左右的Z DR与直径6 mm的雨滴散射特征相当。因此, 0510和0816超级单体风暴内气旋性旋转上升气流可以将少数直径偏大(>2 mm)的扁球形雨滴或水平定向(长轴为水平方向)的湿冰粒带至环境0 ℃层高度之上, 从而导致大的Z DR, 混合相态粒子的存在导致CC偏低。
0510和0816超级单体风暴都出现明显的三体散射(TBSS)或旁瓣回波, 鉴于不是本文讨论的内容, 其双偏振参量特征不予描述。
4 风暴参数演变特征
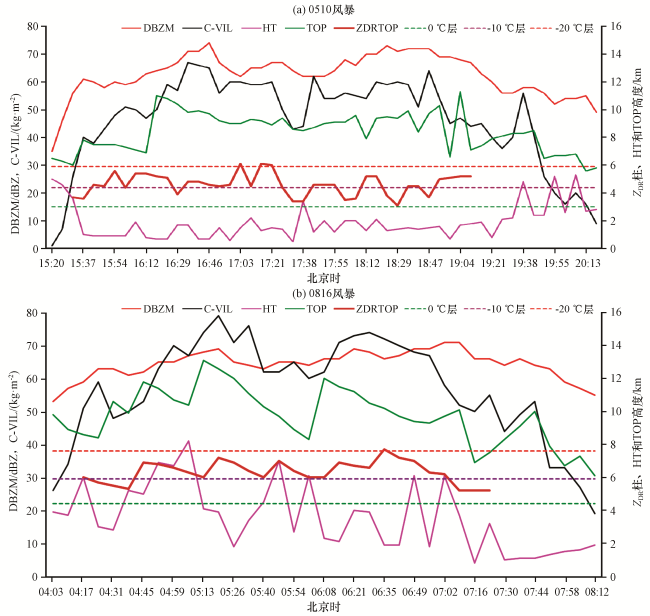
风暴参数包括最大反射率因子(DBZM)及所在高度(HT)、 基于单体的垂直累积液态含水量(C-VIL)、 单体顶部高度(TOP)和ZDR柱高度(ZDRTOP)。DBZM、 HT 、 C-VIL 和TOP这些参数可在风暴结构产品(62号产品)中直接读出, ZDRTOP通过仰角产品对应上升气流区进行确定(见3.1节PPI特征分析)。
4.1 0510风暴演变特征
对流单体15:20生成于聊城市区西部区域, 15:20 -15:54东偏北移动, 15:54 -16:17转向东移动, 16:17之后基本转为东南方向移动, 减弱阶段又转为偏东移动, 20:18消散于泰安市区南部区域, 历时约5 h, 移动距离约150 km, 移动速度约30 km·h-1。期间有一次合并过程, 强对流单体经过黄河移至平阴县境内后, 与其右侧新生快速发展的对流单体合并, 合并之后又有所发展, 在平阴安城及肥城境内产生大冰雹。风暴在18:18 -18:52阶段出现中气旋, 属于超级单体强风暴。Z DR柱在风暴生成2个体扫后(15:32)开始出现, 高度约3.7 km, 对应的DBZM为56 dBZ, 1个体扫之后DBZM达到60 dBZ; 19:10 Z DR柱最后一次出现, 2个体扫之后即19:27风暴减弱(DBZM减小到60 dBZ之下), 12个体扫之后风暴消散, Z DR柱维持阶段其顶高(ZDRTOP)都在0 ℃层高度以上[图3(a)], 最高达可达-20 ℃层高度; ZDRTOP平均4.6 km, 平均高度在-10 ℃层高度之上。Z DR柱持续时间约3.63 h, 期间风暴处于旺盛持续阶段[图3(a)], DBZM基本维持在60 dBZ以上, 风暴参数DBZM、 C-VIL、 HT和TOP平均值分别为65.8 dBZ、 53.2 kg·m-2、 1.4 km和8.9 km; DBZM≥70 dBZ持续时间有10个体扫, 最大达到74 dBZ, 影响范围内聊城市区、 茌平、 东阿、 平阴和肥城都相继出现冰雹天气, 平阴安城和肥城王瓜店出现直径20 mm以上大冰雹。


4.2 0816风暴演变特征
对流单体04:03生成于河北辛集市南部区域, 08:12消散于山东桓台县境内, 基本东偏南方向移动, 历时约4 h, 移动距离约280 km, 移动速度约70 km·h-1。风暴在05:33 -05:54和06:28 -07:02两个阶段出现中气旋, 属于超级单体强风暴。Z DR柱在风暴生成2个体扫后(04:17)开始出现, 高度约6 km, 对应的DBZM为59 dBZ, 1个体扫之后(04:24)DBZM增大到63 dBZ; 07:23 ZDR柱最后一次出现, 4个体扫之后即07:58风暴减弱(DBZM减小到60 dBZ之下), 8个体扫之后风暴消散; ZDRTOP都在0 ℃层高度以上[图3(b)], 最高达可达-20 ℃层高度; ZDRTOP平均6.3 km, 平均高度在-10 ℃层高度之上。Z DR柱持续时间约3.1 h, 期间风暴处于旺盛持续阶段, DBZM基本维持在60 dBZ以上, 风暴参数DBZM、 C-VIL、 HT和TOP平均值分别为65.8 dBZ、 63.6 kg·m-2、 4.1 km和10.2 km, DBZM≥70 dBZ持续时间仅有2个体扫, 德州的临邑和济南的济阳境内出现直径20 mm以上大冰雹天气。
4.3 0510和0816风暴的对比分析
两次风暴生命史超过4 h, 都属于长寿命超级单体风暴, 但短时强降水和大风出现站数较少, 主要是冰雹造成较大气象灾害。Z DR柱持续时间较长, 都超过3 h, 风暴强的反射率因子维持时间也较长, 也都超过3 h, DBZM平均值基本一致, 为65.8 dBZ, 同时都具有较大的C-VIL, 冰雹出现的地点多, 个别地点灾害较重。HT和TOP差别明显, 0510风暴HT和TOP平均值分别是1.4和8.9 km, 0816风暴HT和TOP平均值分别是4.1和10.2 km。TOP的差异也导致C-VIL的差异, 平均差值约10 kg·m-2左右。
移动方向基本一致, 但移动速度差别明显。0510风暴移动速度约30 km·h-1, 0816风暴移动速度约70 km·h-1。风暴移动与引导气流的强弱相关, 0816过程15日20:00上游探空邢台站和下游探空章丘站500 hPa均为西北风, 风速12~13 m·s-1(表1), 16日08:00探空两站的风速增大到25 m·s-1或以上, 风速明显增大, 济南雷达风廓线产品显示04:00 -05:00期间500 hPa高度西北风风速在22~28 m·s-1(图略); 0510过程临近的章丘探空站500 hPa由西南风转为西北风, 20:00风速8 m·s-1, 上游探空邢台站由西风转为西偏北风, 风速由5 m·s-1增大到10 m·s-1 (表1), 济南雷达风廓线产品显示17:00 -18:00期间500 hPa高度西北风风速在10~13 m·s-1(图略), 0510过程引导气流西北风风速较小。0816过程500 hPa引导气流明显较强, 导致0816超级单体风暴移动较快。
Z DR柱基本位于风暴的强上升气流区内, 出现中气旋阶段与中气旋旋转上升气流相对应, 未出现中气旋阶段位于明显的径向辐合区内。Z DR柱高度存在差异, 但与0 ℃层高度的差值不明显。0510风暴Z DR柱顶部平均4.6 km, 略高于-10 ℃层高度, 与0 ℃层高度的差值为1.6 km左右。0816风暴Z DR柱顶部平均6.3 km, 稍高于-10 ℃层高度, 与0 ℃层高度的差值为1.8 km左右。Z DR柱高度的差异决定了风暴HT和TOP的差异, 0816风暴Z DR柱顶部高度较高, 强上升气流的高度也较高, 从而导致其HT和TOP的高度也较高。Z DR柱高度值与风暴反射率因子强度无明显对应关系。
Z DR柱出现之后风暴快速发展, Z DR柱消失后风暴逐渐减弱。两次强风暴都是在Z DR柱出现1个体扫之后反射率因子增大到60 dBZ以上。0510风暴在Z DR柱消失2个体扫之后反射率因子减弱到60 dBZ以下, 又经过10个体扫之后风暴消散; 0816风暴在Z DR柱消失4个体扫之后反射率因子减弱到60 dBZ以下, 又经过4个体扫之后风暴消散。Z DR柱的出现说明风暴内部上升气流的强度增强、 高度增高, 预示着风暴会迅速发展, Z DR柱的消失说明风暴内部上升气流的强度减弱、 高度迅速降低, 强的上升气流主要位于0 ℃层高度以下, 预示着风暴质心将要降低, 风暴强度将要减弱, 但不会迅速减弱消散。
5 结论
(1) 两次强对流过程环境物理量利于组织性强的雷暴的形成。具有强的热力不稳定, 中等强度以上对流有效位能和垂直风切变, 850 hPa与500 hPa温差超过30 ℃, CAPE≥1200 J·kg-1, LI<-4 ℃, 0~6 km垂直风切变大于14 m·s-1。环境零度层高度较低, 利于地面冰雹的出现。
(2) 两次风暴都属于长寿命超级单体风暴, 平均强度差别不明显。0510风暴历时5 h左右, 0816风暴历时4 h左右, ≥60 dBZ反射率因子维持时间都超过3 h, DBZM平均值都是65.8 dBZ左右, 同时都具有较大的C-VIL值, 移动路径上导致多处强冰雹天气。
(3) 两次强风暴移动速度差别明显, 0816风暴移动速度是0510风暴移动速度的2.3倍左右。0816过程500 hPa引导气流风速约22 m·s-1以上, 0510过程500hPa引导气流风速10~13 m·s-1, 0816过程引导气流明显较强, 导致0816超级单体风暴移动较快。
(4) Z DR柱表现为环境0 ℃层高度以上的Z DR大值区(Z DR≥1.5 dB), 位于风暴的强上升气流区内, 对应的反射率因子Z偏弱(最大值在55 dBZ左右), CC值较低, 基本小于0.97。风暴内强上升气流可以将少数直径偏大的扁球形雨滴或少许水平定向的湿冰粒带至环境0 ℃层高度之上, 从而导致大的Z DR, 雨滴、 包有水膜的冰粒子等这种混合相态粒子的存在导致CC偏低。
(5) Z DR柱出现之后风暴快速发展, Z DR柱消失后风暴逐渐减弱。Z DR柱的出现说明风暴内部上升气流的强度增强、 高度增高, 预示着风暴会迅速发展。Z DR柱的消失说明风暴内部强上升气流的强度减弱、 高度迅速降低, 预示着风暴质心将要降低, 风暴强度将要减弱。Z DR的出现及消散对风暴的发展与减弱有明显指示意义。上干冷下暖湿和中等强度以上垂直风切变的环境条件下, Z DR的出现可提前预警冰雹天气。
(6) 两次风暴Z DR柱顶部高度有明显差别, 但与环境0 ℃层高度的差值没有明显差别。0510风暴Z DR柱顶部平均4.6 km, 与0 ℃层高度的差值约1.6 km左右, 0816风暴Z DR柱顶部平均6.3 km, 与0 ℃层高度的差值约1.8 km左右。Z DR顶部高, 强上升气流的高度也高, 也就说明0816风暴的强中心高度和风暴顶高都明显高于0510风暴。