

1 引言
2 资料来源和方法介绍
2.1 资料来源
2.2 方法介绍
2.2.1 两种极端低温事件的界定
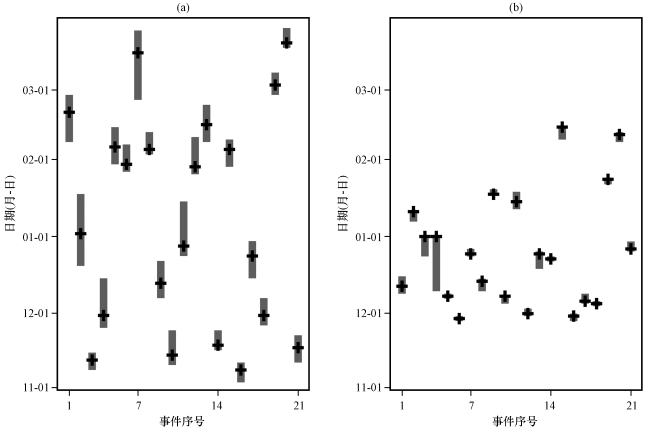
2.2.2 阻塞高压的强度与频率
2.2.3 西伯利亚高压指数
2.2.4 极涡的强度和范围
3 两类极端低温事件的气候特征
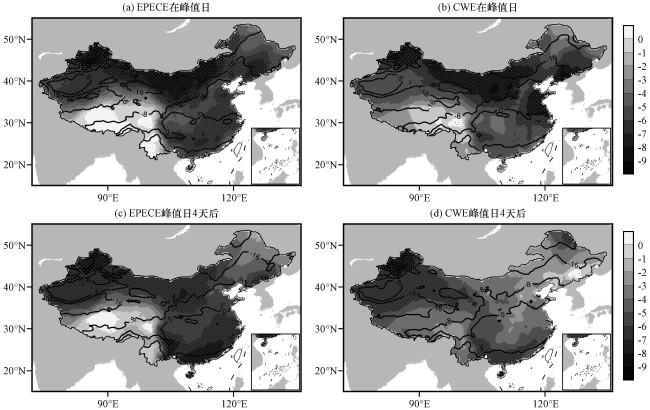
图2 EPECE事件(左)和CWE事件(右)在峰值日及峰值日4天后的气温(等值线, 单位: ℃)和气温距平(阴影, 单位: ℃)分布(采用墨卡托投影)台湾省无数据, 黑色打点区表示通过90%信度检验 Fig.2 The averaged air temperature (contour, unit: ℃) and anomalies (the shaded, unit: ℃) distribution of EPECE (left) and CWE (right) on peak day and 4 days after peak day (using Mercator projection).No data for Taiwan Province, the black dotted regions are statistically significant at the 90% confidence level |
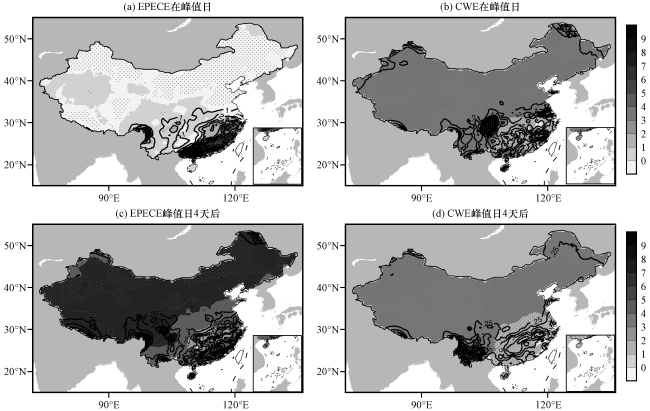
图3 EPECE事件(左)和CWE事件(右)在峰值日及峰值日4天后的降水量(等值线, 单位: mm)和降水量距平(阴影, 单位: mm)分布(采用墨卡托投影)台湾省无数据, 黑色打点区表示通过90%信度检验 Fig.3 The averaged precipitation (contour, unit: mm) and anomalies (the shaded, unit: mm) distribution of EPECE (left) and CWE (right) on peak day and 4 days after peak day (using Mercator projection).No data for Taiwan Province, the black dotted regions are statistically significant at the 90% confidence level |
4 EPECE与CWE形成前后的大气环流形势
4.1 200 hPa的环流形势
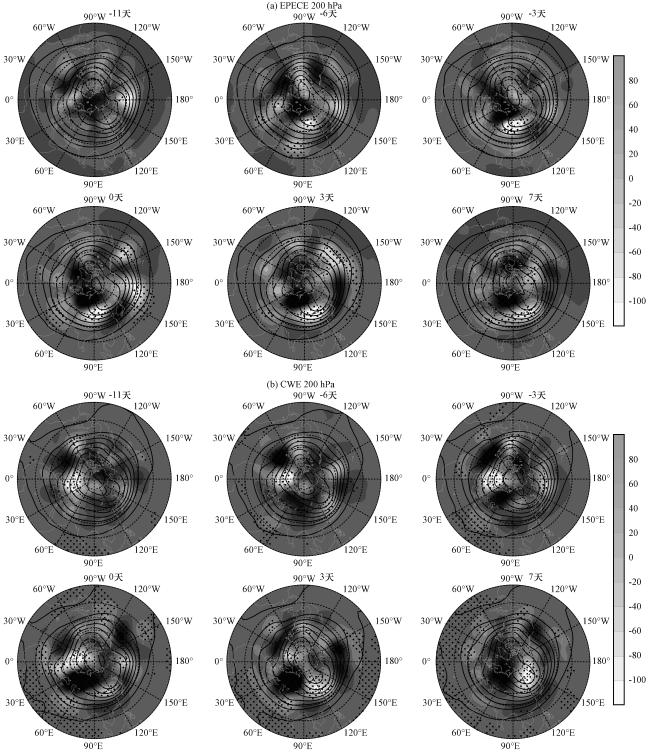
图4 EPECE(a)和CWE(b)-11天到+7天200 hPa位势高度场(等值线, 单位: gpm)和位势高度距平场(阴影, 单位: gpm)黑色打点区表示通过90%信度检验 Fig.4 The averaged 200 hPa geopotential height (contour, unit: gpm) and anomalies (the shaded, unit: gpm) from day -11 to day +7 for the EPECE (a) and the CWE (b).The black dotted regions are statistically significant at the 90% confidence level |
4.2 500 hPa的环流形势
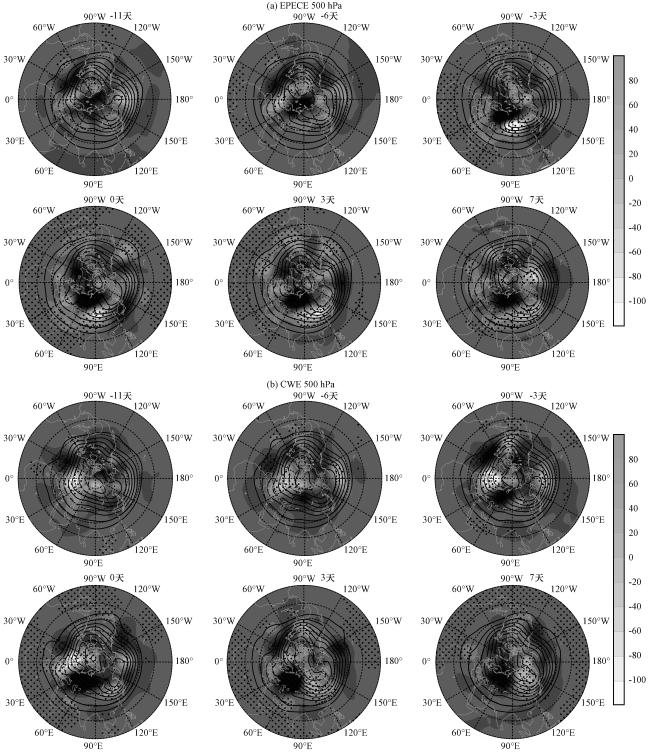
图5 EPECE(a)和CWE(b)-11天到+7天500 hPa位势高度场(等值线, 单位: gpm)和位势高度距平场(阴影, 单位: gpm)黑色打点区表示通过90%信度检验 Fig.5 The averaged 500 hPa geopotential height (contour, unit: gpm) and anomalies (the shaded, unit: gpm) from day -11 to day +7 for the EPECE (a) and the CWE (b).The black dotted regions are statistically significant at the 90% confidence level |
4.3 海平面气压场
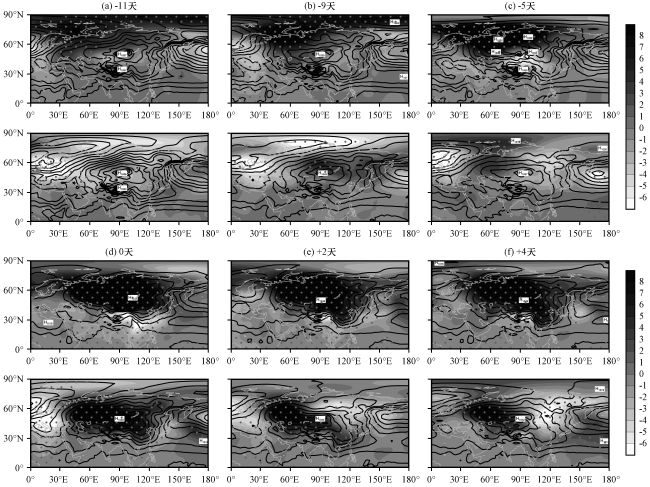
图6 EPECE(上)和CWE(下)-11天到+4天海平面气压场(等值线, 单位: hPa)和海平面气压距平(阴影, 单位: hPa)黑色打点区表示通过90%信度检验 Fig.6 The averaged sea level pressure (contour, unit: hPa) and anomalies (the shaded, unit: hPa) from day -11 to day +4 forthe EPECE (up) and the CWE (down).The black dotted regions are statistically significant at the 90% confidence level |
5 定量化指数分析
5.1 极涡强度指数
5.2 阻塞高压指数特征对比
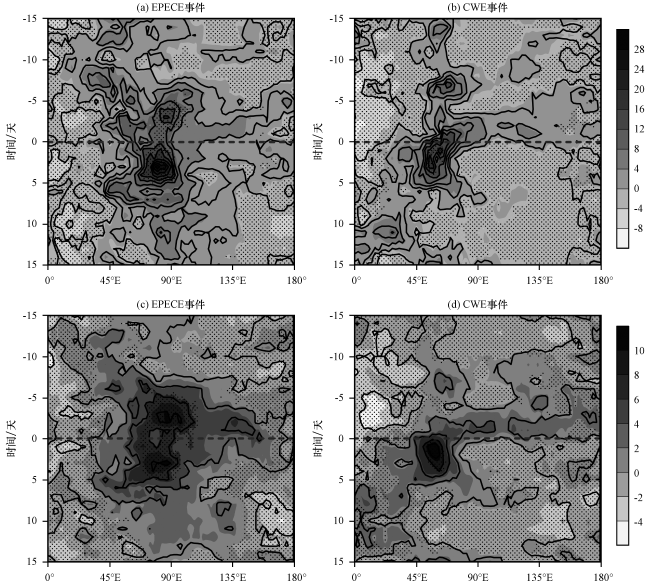
图8 EPECE与CWE阻塞高压强度(等值线)及其距平(阴影)(a, b, 单位: gpm·gpm-1)和瞬时阻塞频率(等值线)及其距平(阴影)(c, d, 单位: %, )的经度-时间分布黑色打点区表示通过90%信度检验 Fig.8 The distribution of the Hovmöller diagrams for EPECE and CWE of the blocking intensity (contour) and anomalies (the shaded) (a, b, unit: gpm·gpm-1), and the blocking frequency (contour) and anomalies (shade)(c, d, unit: %).The black dotted regions are statistically significant at the 90% confidence level |
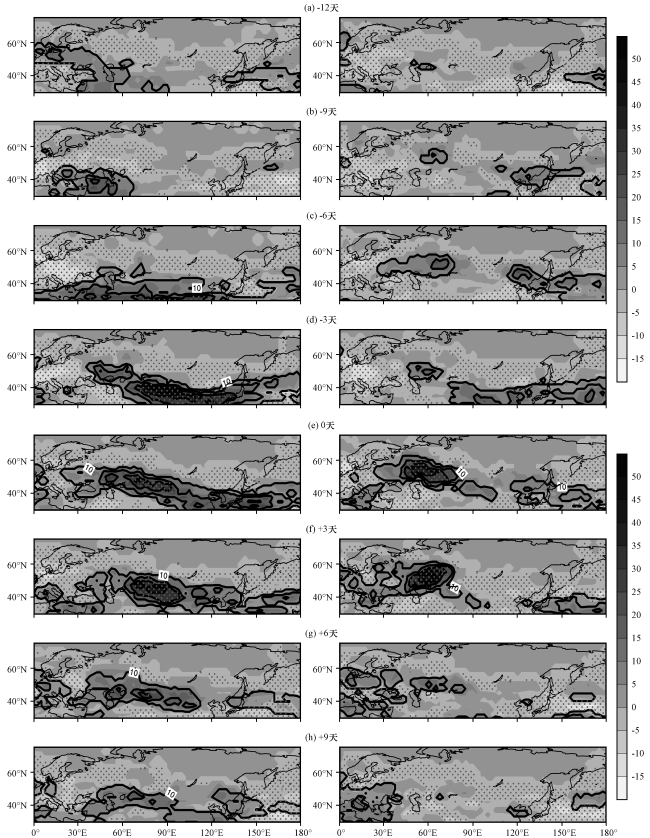
图9 -12天到+9天EPECE(左)与CWE(右)瞬时阻塞频率(等值线)和阻塞频率距平(阴影)分布(单位: %)黑色打点区表示通过90%信度检验 Fig.9 The distribution of blocking frequency (contour) and anomalies (the shaded) for the EPECE (left) and the CWE (right).Unit: %.The black dotted regions are statistically significant at the 90% confidence level |
5.3 西伯利亚高压指数特征对比
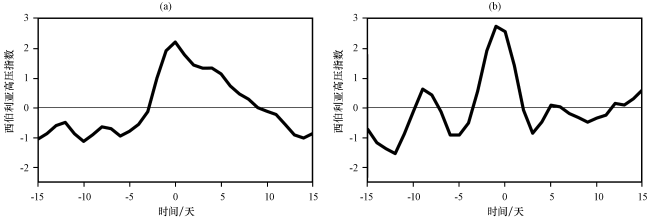
6 主要天气系统的配置
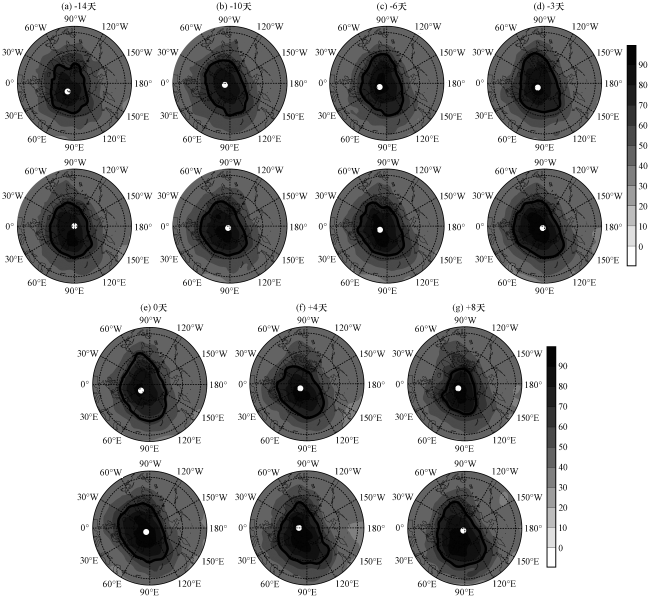
图11 EPECE(上)与CWE(下)在555 K等熵面的PV分布(单位: PVU, 1 PVU=1×10⁻⁶·K·m2·kg-1·s-1)阴影为PV, 黑色粗实线为极涡边缘, 白色点为极涡中心, 最外纬圈为40°N Fig.11 The distribution of PV on 555 K isentropic surface for the EPECE (up) and the CWE (down).(Unit: PVU, 1 PVU=1×10⁻⁶·K·m2·kg-1·s-1 ).The black contour denotes polar vortex edge, the white dot denotes polar vortex center, the outer ring is 40°N |
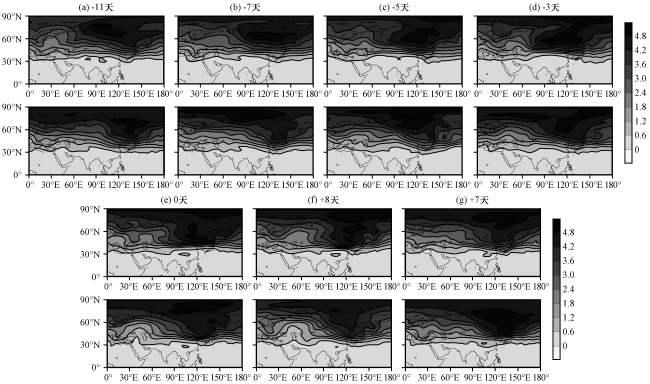


表1 EPECE和CWE两类事件特征对比Table 1 Comparison of characteristics of EPECE and CWE |
| 对比项目 | EPECE事件 | CWE事件 |
|---|---|---|
| 200 hPa高度场特征 | 极涡-11~+7天存在异常。 | 极涡-3~+3天存在异常。 |
| 500 hPa高度场特征 | -11天欧亚中高纬地区出现高压脊, 下游有冷槽, 维持至+7天。 | -3天时欧亚中高纬地区建立高压脊, 维持至+3天。 |
| 海平面气压场特征 | -11天西伯利亚冷高压异常增强, 维持至+7天。 | 第0天时西伯利亚冷高压显著增强, 维持至+4天。 |
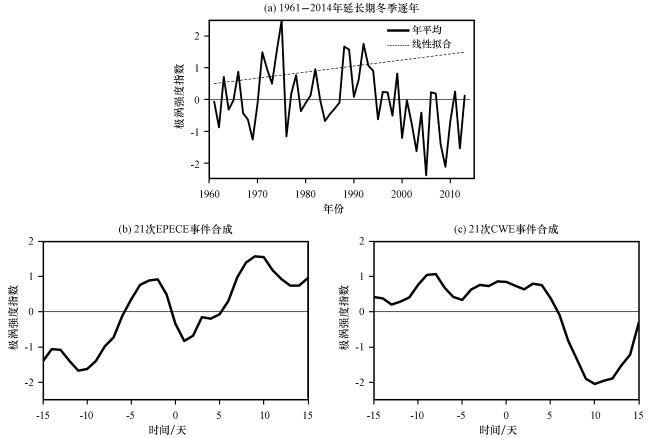
| 标准化PVI指数特征 | 极涡强度从-11~+10天持续增强。 | -15~+5天, 极涡强度无明显变化, 第+5天后急剧下降。 |
| 阻塞指数特征 | -12~+9天, 从乌拉尔山至90°E阿尔泰山脉维持阻塞, 阻塞频率最大超过气候态50%。 | -6~+3天乌拉尔山地区维持阻塞, 阻塞频率最大超过气候态45%。 |
| 西伯利亚高压指数特征 | -5天时显著增强, 在第0天达到最大值2.22后逐渐减小。 | 波动性大, -5天时增强, 第0天达到最大值2.79迅速减小。 |
| 555 K等熵面 | 极涡-10~+8天存在异常, 中心偏向东半球。 | 极涡-3~+8天存在异常, 中心位于极点。 |
| 315 K等熵面 | 第-9~+3天存在AWB, -3天时乌拉尔山有显著PV环流。 | 第0~+3天存在AWB, 第0天乌拉尔山有显著PV环流。 |