

1 引言
暖区暴雨具有降水强度大, 时段集中, 局地突发性强, 对流性强等特点, 极易引发暴雨洪涝灾害, 诱发山洪泥石流滑坡等次生地质灾害。暖区暴雨发生前, 天气尺度扰动的信号通常较弱, 触发机制不明显, 并且生消变化快, 模式预报对暖区暴雨的预报能力有限(张晓美等, 2009)。为了弄清暖区暴雨气候特征和成因, 许多专家开展了大量暖区暴雨的研究工作, 但主要集中在华南地区 (张晓美等, 2009; 陈翔翔等, 2012; 何立富等, 2016)。近年来, 学者们对华南地区以外的暖区暴雨做了统计分析、 分类并建立了概念模型, 陈玥等(2016)在长江中下游地区建立了冷锋型、 暖切变型以及副高边缘型3种暖区暴雨天气概念模型, 汪玲瑶等(2018)给出江南地区暖区暴雨的定义, 并将其分为暖切变型、 冷锋型、 副高型以及强西南急流型四类。同时中小尺度的对流系统是造成暖区暴雨的直接因子(叶朗明和苗峻峰, 2014; 陈云辉等, 2015; 伍志方等, 2018), 因此开展暖区中尺度对流系统的结构和传播研究, 是了解暖区暴雨的关键基础, 随着非常规观测资料的发展, 暖区对流系统的研究也取得了很多重要的结论(陈娟等, 2015)。暖区暴雨的触发条件与传统的暴雨过程相差不大, 常常与边界层内侵入的浅薄冷空气(慕建利等, 2008)、 低层重力波(徐燚等, 2013)、 地形抬升(孙健等, 2002; 王珏等, 2008)、 海陆分布(梁海河等, 2004; 周广强等, 2005)及地面中尺度辐合线(周明飞等, 2014; 刘蕾等, 2016; 王华等, 2019)有关。
相对于明显槽和切变系统影响的暖区暴雨, 弱天气尺度背景下暖区暴雨主要天气形势是高空没有明显槽线或中低层没有明显切变影响, 这类暖区暴雨由于触发机制不清楚和数值预报能力较差等原因, 往往容易忽视, 预报难度较大, 更有研究价值。本文将2008 -2019年4 -9月湖南弱天气尺度背景下暖区暴雨按天气形势分为副高型和强西南急流型, 并选取两例预报难度大、 造成一定影响的个例对比分析, 寻找这两类暖区暴雨预报着眼点建立预报思路。2016年7月17日湘西州古丈县默戎镇突发特大暴雨, 11:00(北京时, 下同) -12:00降水达104.9 mm, 12:05默戎发生特大坡面泥石流, 方量约1万方, 瞬间将周边房屋吞没, 但由于气象预警及时精准, 与省地灾应急中心联动迅速, 政府组织及时转移, 成功避险, 实现人员“零伤亡”, 创造了“默戎奇迹”, 这次气象服务工作受到湖南省防汛抗旱指挥部通报表扬。此次过程突发性大、 局地性强, 暴雨主要发生在副高588 dagpm线控制范围内, 属于副高型暖区暴雨(汪玲瑶等, 2018), 模式预报误差较大, 预报中副高脊线位于湘西北, 较实况偏南, 地面辐合线预报也不明显, 且预报中对17日白天湘西北暴雨漏报, 降水预报从17日夜间开始。2018年4月30日湘东北暴雨发生在槽前南风控制下, 属于强西南急流型暖区暴雨(汪玲瑶等, 2018), 700 hPa切变线位于鄂东北至湘东北, 而预报切变线位于渝东到鄂中, 预报相对实况偏北, 且各家模式降水预报均漏报湘东北暴雨。上述这两例弱天气尺度背景下暖区暴雨模式形势场和降水预报偏差较大, 对预报员有相当大的挑战, 本文将这两例过程进行对比分析, 分析其中尺度特征、 对流系统的动力结构和大气不稳定机制, 寻找这两类弱天气尺度背景下暖区暴雨的预报着眼点, 以便做出更准确的预报, 为防灾减灾提供可靠依据。
2 分类标准与统计特征
2.1 湖南弱天气尺度背景下暖区暴雨标准及分类
湖南弱天气尺度背景下暖区暴雨同时满足三个条件: (1)3个及以上相邻国家基本站08:00至次日08:00的24 h累积降水达到50 mm·d-1日以上; (2)排除热带东风系统影响, 并且高空无明显槽或中低层(700/850 hPa)无明显切变影响; (3)发生在距地面锋面100~300 km的暖区内。
利用2008 -2019年4 -9月常规观测资料、 逐小时自动站降水资料和雷达卫星等非常规资料, 根据以上标准挑选出10例湖南弱天气尺度背景下暖区暴雨, 并按500 hPa影响系统分为两类, 其中强西南急流型7例, 副高型3例。
(1) 强西南急流型: 春季副高主体偏南, 脊线位于20°N以南, 高空槽位置较远或浅槽过境; 中低层存在强盛的西南急流; 边界层多数受925 hPa切变影响, 暴雨区常位于边界层切变附近和急流轴出口区左侧的水汽充沛区域, 在地面辐合线触发下产生暴雨。同时, 戴泽军等(2019)指出边界层西南急流旺盛时, 925 hPa风场切变及水汽辐合大值区与湖南强降水落区位置对应很好, 与本文结论一致。
(2) 副高型: 夏季副高西伸北抬, 控制湖南省大部分地区, 具有明显的热力不稳定层结, 在边界层925 hPa切变或地面辐合线作用下产生暴雨。
文中涉及的地图基于国家测绘地理信息局标准地图服务网站下载的审图号为GS(2019)1697号的中国地图, 湖南省地理信息公共服务平台网站下载的审图号为湘S(2017)51号的湖南省地图制作, 底图无修改。
2.2 时间分布特征
分析2008 -2019年4 -9月湖南弱天气尺度背景下暖区暴雨降水次数的逐月变化[图1(a)]得知, 两类暖区暴雨有明显的季节差异, 强西南急流型均发生在春季, 且4月发生次数最多(4例), 西太平洋副高存在明显的季节变化, 6月中旬前副高脊线位于20°N以南, 对湖南影响较小, 而南支槽春季较活跃, 为湖南地区输送充沛的水汽, 在边界层中尺度系统影响下, 促使暖湿空气抬升, 不稳定能量释放产生暴雨; 副高型暖区暴雨主要发生在7月下旬到8月初, 这是由于7月中旬以后副高第二次西伸北跳, 副高脊线北移至25°N -30°N, 基本控制湖南省, 不稳定能量高, 边界层辐合系统抬升下产生暴雨。
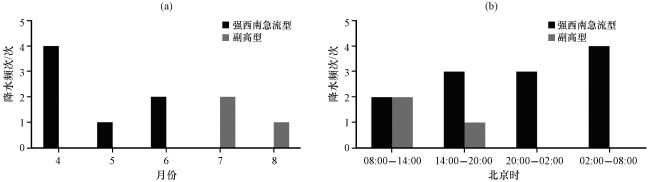
由两类弱天气尺度背景下暖区暴雨降水频次的逐6 h变化[图1(b)]看出, 这两类暖区暴雨共同点: 降水强度大, 发生暴雨或大暴雨的站点强降水往往集中在3 h以内。强西南急流型一天任何时刻均会出现, 持续多个时次, 夜间降水频次增多, 因为低空急流日变化过程中风向顺时针旋转异常形成的辐合场形势, 造成夜间至清晨降水峰值出现(Chen et al, 2010)。副高型的日变化明显, 主要出现在白天, 降水峰值出现在上午(08:00 -11:00), 这与夏季白天地表升温, 形成对流不稳定层结有关。
2.3 空间分布特征
强西南急流型[图2(a)]发生时, 西太平洋副高位置偏南, 低层强西南急流向北推进, 暖区低空急流有利于水汽和能量输送, 同时能反复组织对流活动发生, 最终导致暖区降水强度明显增大(罗建英等, 2009)。强西南急流型降水范围广, 强度大, 多出现在湘南地区, 当西南急流非常强盛, 北推到长江中下游地区时, 也会导致湘北出现暴雨。日降水强度超过80 mm的站点多发生于山区及水汽含量较高的洞庭湖地区。
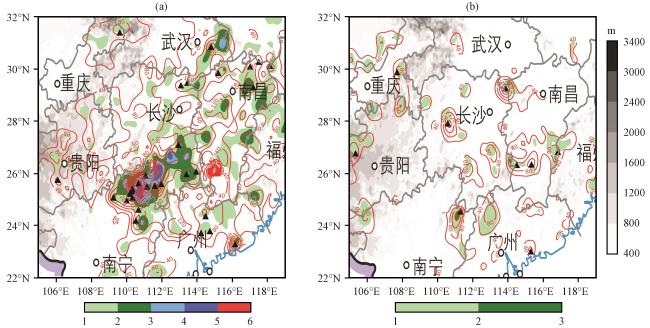
图2 强西南急流型暖区暴雨(a)、 副高型暖区暴雨(b)空间分布彩色填色为日降水量大于30 mm站点降水频次(单位: 次), 黑白填色为地形高度(单位: m), 红色等值线为累积日降水量(40~300 mm), 黑色三角形为日降水量大于80 mm Fig.2 Spatial distribution of warm-sector heavy rainfalls in the type of strong southwest jet (a) and subtropical high under weak synoptic scale background.Color shaded is for the frequency (unit: times) of daily precipitation(≥30 mm); black and white shaded for terrain height (unit: m); red contour for the average daily precipitation (40~300 mm); black triangle for daily precipitation amount (≥80 mm) |
副高型降水[图2(b)]发生在副高内部, 较分散, 在湘西北、 湘北及湘东南地区均有出现, 局地性强, 对流性明显, 小时雨强大。当副高西伸加强时, 湘西地区可能受地形抬升影响出现日雨量超过100 mm的站点。
3 两例不同类型弱天气尺度背景下湖南暖区暴雨个例对比分析
3.1 “4·30”过程预报情况
此次过程主要降水时段为2018年4月30日20:00至5月1日08:00, 预报员16:00之前要发布20:00城镇天气预报, 此时可供参考的资料主要有30日08:00高空资料、 16:00之前的地面观测资料、 卫星云图和雷达资料, 以及30日08:00起报的各家模式预报产品。
2018年4月30日08:00, 500 hPa欧亚高纬为两槽一脊形势, 高空槽位于贝加尔湖南部, 中低纬南支槽位置较远, 位于云南以西, 湖南处于槽前西南气流中, 副高588 dagpm线位于南海; 湖南省700 hPa、 850 hPa均为西南风, 风速8~10 m·s-1, 桂林站风速达14 m·s-1, 地面受热低压控制, 30日白天湘南出现小雨天气。
欧洲中心30日08:00起报的形势场预报资料显示30日20:00 500 hPa南支槽位于云南中部, 湖南处于槽前西南气流中, 副高588 dagpm线北界位于华南沿海, 700 hPa和850 hPa湖南省预报西南风, 风速8~10 m·s-1, 850 hPa湘西北风速弱辐合。各家降水预报全省预报小雨, 其中湘西北部分中到大雨, 均漏报湘东北暴雨。预报员结合实况和数值模式预报, 考虑30日以小雨为主, 湘西局地大雨; 当5月1日高空槽带动切变线东移南压及冷空气南下时预报全省小到中雨, 湘西南、 湘东北部分大雨, 局地暴雨。
4月30日为暖区暴雨, 预报误差大, 数值模式对弱天气背景下暖区暴雨可预报性低。
3.2 “7·17”过程预报情况和重大地质灾害过程的气象服务情况简述
3.2.1 预报情况
此次过程预报时段为2016年7月17日08:00至18日08:00, 值得关注的是17日08:00 -20:00副高控制下湘西北暖区暴雨, 预报员06:00之前要发布08:00城镇天气预报, 此时可供参考的资料主要有16日20:00高空资料、 06:00之前的地面观测资料、 卫星云图和雷达资料, 以及16日20:00起报的其他模式预报产品。
2016年7月16日白天受高空槽东移南压及中低层切变线影响, 湘中偏南地区出现小到中雨, 局地大到暴雨。20:00, 500 hPa 欧亚中高纬为两槽一脊形势, 高空槽东移北收, 位于华北到江淮地区, 副高西伸北抬, 588 dagpm线控制湖南地区, 中低层切变线东北移20:00转西南风, 地面处于低压控制下, 16日夜间降水减弱停止。
欧洲中心16日20:00起报的形势场预报资料显示17日08:00 500 hPa副高588 dagpm线东退至湘中, 湘西北风速弱辐合, 20:00湘北切变线形成, 此时预报降水开始。各家模式降水预报08:00 -20:00全省小到中雨, 主要降水从夜间开始, 17日20:00至18日08:00预报湘中以北部分大雨, 局地暴雨。
总之, 模式对17日夜间至20日高空槽、 副高边缘、 切变线及中低层急流影响下的大尺度降水过程预报较好, 而对副高控制下中尺度系统造成的局地性降水漏报。由于模式形势场和降水预报跟实况均有一定误差, 进一步影响预报员的判断, 最终导致17日白天湘西北漏报。
3.2.2 气象服务情况
“7·17”强降水过程中, 气象部门利用雷达、 卫星和区域自动气象站密切监视雨情和天气变化, 并向防汛责任人和社会公众滚动发布最新气象预报预警信息、 雨量实况、 特别提醒短信和防灾避险提示, 为防汛人员查险避险、 转移民众提供科学依据。尤其是17日10:43和11:43及时发布的两条强降水“特别提醒”短信精准到了受灾最严重的古丈默戎镇, 在默戎镇龙鼻村重大坡面泥石流灾害过程中提前转移人员、 成功避险发挥了极为关键的作用。另外气象部门充分发挥“政府主导, 部门联动, 社会参与”的气象防灾减灾机制, 气象、 水利、 防汛、 国土、 应急、 安监等部门及时预警、 有效联动, 州、 县、 乡、 村四级根据预报预警, 组织有力、 迅速行动, 在泥石流发生前被村干部及时安全转移, 不仅最大程度降低了暴雨灾害损失, 而且避免了重大人员伤亡。
3.3 降水实况对比分析
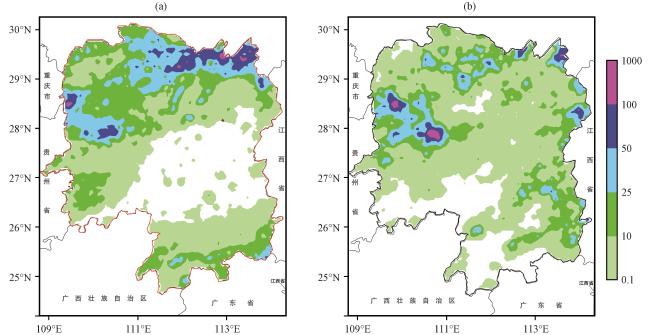
“4·30”过程降水主要位于湘北地区[图3(a)], 据区域自动站统计, 全省共有199个乡镇降水量达暴雨, 27个乡镇达大暴雨, 24 h最大降水量167.6 mm(花垣龙潭), 最强小时降水出现在临湘月山78.1 mm(1日01:00 -02:00)。 “7·17”过程湘西北出现了暴雨天气[图3(b)], 降水时段集中, 小时雨强大, 局地性强, 12 h最大降水量为古丈默戎203.1 mm, 1 h最大降雨量达104.3 mm(17日11:00 -12:00), 据区域自动站统计, 12 h雨量达到50~99.9 mm有96个站, 达到100~199.9 mm有21个站, 2个站超过200 mm。两次暖区暴雨均具有强降雨时段集中, 对流性强的特点, 不同处在于“4·30”过程发生在春季, 冷暖交汇频繁, 在高空槽、 切变线及冷空气南下之前的暖区降水, 降水范围比“7·17”更广, 由大尺度系统辐合抬升造成的, 而“7·17”过程发生在夏季, 处于副高控制下, 热力不稳定能量高, 降水性质类似热对流天气, 降水强度和小时雨量更大, 局地性强。
3.4 天气背景
2018年4月30日20:00[图4(a)], 500 hPa高空槽位于甘东南到渝西北, 湖南受槽前西南气流控制, 副高位于我国东南沿海一带, 副高西北侧偏南气流为我省提供一定水汽条件, 700 hPa切变线位于鄂东北至湘东北, 850 hPa和925 hPa切变线均偏北, 位于渝东南至鄂东北, 湖南省受一致的西南气流控制, 20:00急流未建立, 夜间强降水时段中低层风速均加强达14 m·s-1, 地面受暖低压控制, 地面辐合线呈东北—西南向。此次过程西南急流使低层暖湿条件加强, 湘东北处于切变线南侧的气旋式环流中, 配合动力辐合作用, 使上升运动进一步加强, 湘东北在地面辐合线触发下出现暴雨, 属于强西南急流型暖区暴雨。5月1日随着高空槽带动切变线东移南压, 冷空气夜间影响湖南省, 湘中偏南夜间出现部分暴雨。
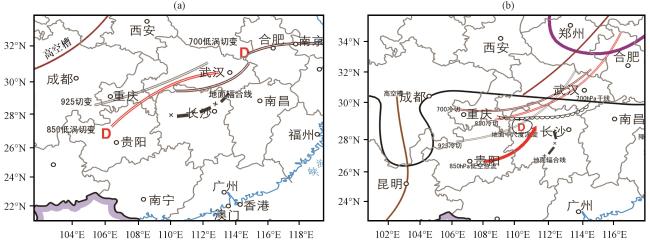
2016年7月17日08:00[图4(b)]588 dagpm线控制全省, 700 hPa湘西北有弱切变、 850/925 hPa切变位于湘西北, 西南急流达12 m·s-1, 湘西北受急流及切变影响, 出现强降水。20:00 588 dagpm线南移, 湘北处于副高边缘, 随着中低层切变线东移南压, 降水东移南压, 湘东北、 湘西南和湘东南受副高边缘和切变线影响局地出现强降水。7月17日白天发生时湘西北处于副高控制下, 属于副高型暖区暴雨, 副高内部具有较高的热力不稳定能量, 中低层弱切变具有一定动力抬升作用, 在700 hPa干线和地面中尺度气旋共同触发下, 局地出现暴雨。
3.5 环境条件分析
3.5.1 水汽条件
两次过程降水区的比湿都达到12 g·kg-1, 达到湖南暴雨需要的水汽条件。“4·30”暴雨过程[图5(a)]水汽通量大值区主要位于湘西南到湘东北地区, 强度达12 g·cm-1·hPa-1·s-1以上, 850 hPa强水汽辐合中心主要位于湘西北和湘东北地区, 与强降雨区的分布吻合, 强度达-2×10⁻⁵ g·(hPa·cm2·s)-1, 并且1日02:00(图略)强降水发生时, 湘东北水汽辐合中心范围变大, 水汽辐合为暴雨区提供充足的水汽条件。“7·17”过程暴雨区水汽通量和水汽辐合较弱, 水汽辐合中心位于暴雨区的南侧, 水汽通量及水汽通量散度中心强度分别达16 g·cm-1·hPa-1·s-1和-4×10⁻⁵ g·(hPa·cm2·s)-1[图5(b)]。沿暴雨区做经向-高度剖面图(图略)分析结果表明, “4·30”过程暴雨区从地面到700 hPa为水汽辐合中心, 水汽辐合中心位于近地层, 强度达-6×10⁻⁵ g·(hPa·cm2·s)-1。“7·17”过程, 暴雨区近地面水汽辐散, 850~950 hPa弱水汽辐合, 水汽辐合大值区位于暴雨区南侧, 最大值位于900 hPa, 达-3×10⁻⁵ g·(hPa·cm2·s)-1。对比分析可知, “4·30”过程水汽输送和辐合比“7·17”过程更强。
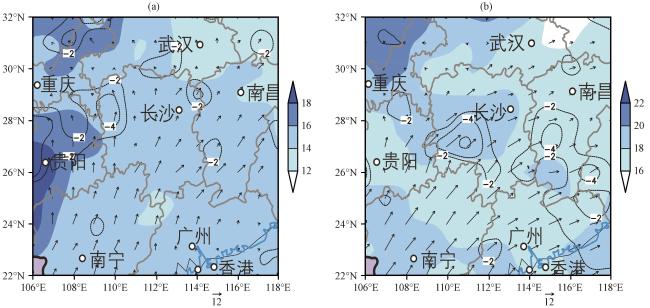
图5 2018年4月30日20:00(a), 2016年7月17日08:00 (b) 850 hPa比湿(阴影, 单位: g·kg-1)、 水汽通量(矢量, 单位: g·cm-1·hPa-1·s-1)和水汽通量散度(等值线, 单位: ×10-5 g·cm-2·hPa-1·s-1)分布Fig.5 Specific humidity (shadow, unit: g·kg-1), water vapor flux (vector, unit: g·cm-1·hPa-1·s-1) and water vapor flux divergence (isoline, unit: ×10-5 g·cm-2·hPa-1·s-1) on 850 hPa at 20:00 on 30 April 2018 (a) and at 08:00 on 17 July 2016 (b) |
3.5.2 动力不稳定
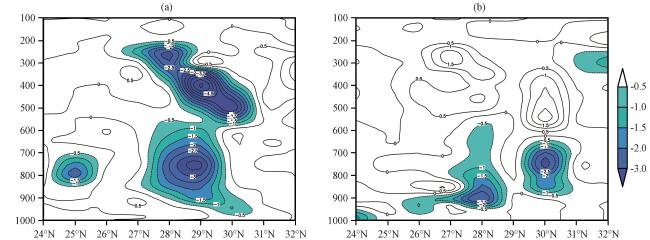
螺旋度不仅考虑了大气旋转的特性, 又考虑了水平和垂直方向的输送作用(岳彩军等, 2011)。不同于CAPE等动力学参数表示潜在不稳定能量, 在相应触发条件才能产生暴雨, 螺旋度可有效表征不稳定能量的释放, 可用于天气预报及分析研究的动力因子(冉令坤和楚艳丽, 2009)。垂直螺旋度是垂直涡度和垂直速度的乘积, 它的大小反映了垂直方向上旋转与沿旋转轴方向运动的强弱程度(岳彩军等, 2011)。
两次过程暴雨发生前垂直螺旋度不明显, 发生时暴雨区垂直螺旋度迅速增大, 很显著。 “4·30”过程[图6(a)]暴雨区上空垂直螺旋度均为负值, 整层垂直螺旋度负值区表示整层气旋性涡度垂直向上输送, 700~800 hPa和400 hPa存在螺旋度负值中心, 中心强度分别为-3.5×10⁻⁵ kg-1·m3·Pa·s-2和 -5.5×10⁻⁵ kg-1·m3·Pa·s-2, 与垂直速度负值中心位置高度一致, 700 hPa切变线造成暴雨区强上升辐合, 导致强降水发生。“7·17”过程[图6(b)]虽然处于副高控制下, 但由于切变线的动力抬升作用, 对副高稳定和副高内部下沉运动有一定影响, 600 hPa高度以下垂直螺旋度的负值区, 表征了气旋性涡度的垂直向上输送, 负值区中心 -2.5×10⁻⁵ kg-1·m3·Pa·s-2, 位于900 hPa高度, 说明该高度强气旋性旋转辐合最强, 主要由近地层中小尺度系统影响造成暴雨, 雨区上空对流层高层垂直螺旋度的正值区代表反气旋性涡度的垂直向上输送。
3.5.3 热力不稳定
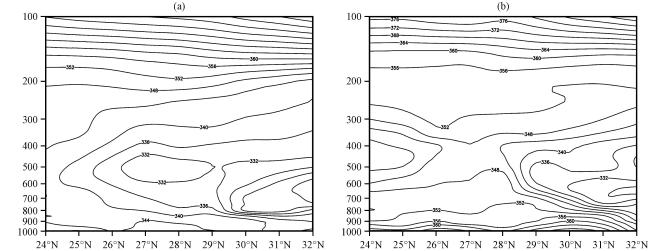
假相当位温反了大气的温湿状况, 应用它的水平和垂直分布可以分析大气中能量分布、 垂直稳定度和大气湿斜压性。两次过程发生前强降雨区θ se均达到了340 K以上(图略), 从而使得低层不稳定能量增大, 并且均出现在假相当位温垂直梯度大的区域。
沿暴雨中心做假相当位温垂直剖面图, 从4月30日20:00沿113°E的剖面图[图7(a)] 发现, 由于地面温度不高, 近地面θ se只有340 K, 但500 hPa存在θ se低值中心, 中心强度达330 K, 随着高度增加而减小, 对流不稳定层结, 配合强上升运动有利暴雨发展。“7·17”过程发生前期[图7(b)], 在暴雨区附近形成θ se密集带, 低层为θ se大值区, 最大θ se达360 K以上, 积聚强不稳定能量, 随着高度增加θ se明显下降, 500 hPa θ se为330 K左右, 强对流不稳定层结有利于对流性天气产生。虽然两次暴雨过程均存在对流不稳定层结, 不同点是“7·17”过程低层热力不稳定能量更大且热力不稳定层结更强。
3.6 中尺度特征
3.6.1 地面中尺度系统
结合雷达天气图分析, 降水对流回波沿地面中尺度辐合系统发生、 发展, 强降水在地面辐合系统影响后明显加强, 地面中尺度辐合系统对暴雨落区和发生时间有较好指示意义。利用地面1h加密资料分析得出, “4·30”过程降水主要位于湘东北地区, 最强降雨时段发生在30日23:00至1日02:00, 1 h最大降雨量达78.1 mm临湘月山(1日01:00 -02:00)。从地面逐时风场[图8(a)]可以看出, 30日20:00, 从湘西到湘东北地区地面有一条东北-西南向β中尺度辐合线生成, 之后该辐合线略向南压, 在湘东北地区维持4 h, 02:00辐合线南压, 降水停止。由此, β中尺度辐合线为此过程强降水的触发机制, 地面中尺度辐合线使地面暖湿气流辐合抬升, 触发对流强烈发展。
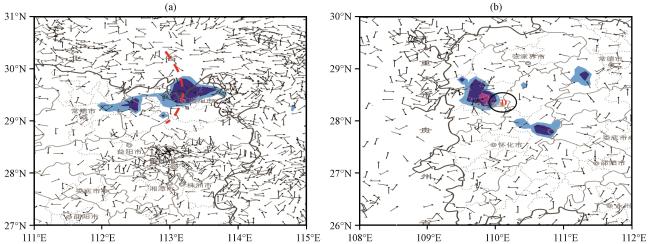
“7·17”过程降水主要位于湘西北地区, 1 h最大降水量为104.3 mm(17日11:00 -12:00), 位于湘西州默戎。从地面逐时风场上可以看出, 09:00湘西州古丈有一γ中尺度气旋生成发展, 10:00维持, 11:00[图8(b)]往东移到古丈东侧, 此时正是默戎最强降水时段, 12:00, 该γ尺度气旋逐渐减弱并向东北方向移动, 造成湘东北降水加强。对应雷达反射率因子图分析, 积状云降水回波在中尺度气旋附近生成发展, 回波强度达42 dBz, 位于1.8~2 km高度, 具有明显的低质心高反射率因子核, 持续了10个体扫, 致使默戎小时降水量达104.3 mm, 因此湘西州古丈γ尺度气旋为默戎强降水的触发机制。结合地形可知, 默戎处于低洼地带并且右侧傍山, 该处有西南风风速辐合再加上地形抬升作用, 对降水有增幅作用。
3.6.2 中尺度对流云团分析
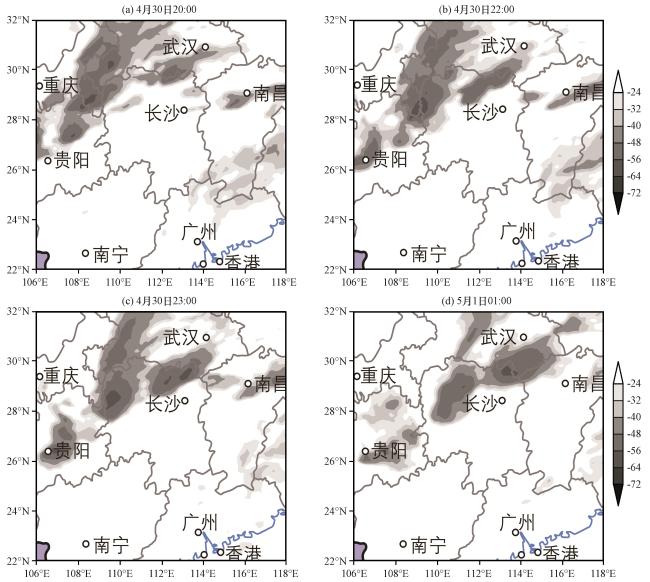
4月30日18:00, 重庆东部对流云团中南侧与北侧各发展出两个较强的对流单体, 其黑体亮温约-52 ℃, 19:00北侧对流云团迅速减弱消亡, 南侧的对流云团则进一步增强并逐渐东移进入湖南西北部地区, 亮温增强至-58 ℃, 此时湘西北区域站点出现20~30 mm·h-1。20:00[图9(a)], 该对流云团移入湖南西北部, 云团涡旋结构较为紧密, 20:00 -24:00随低空西南暖湿气流增强, 该对流云团进一步发展, 云团中心TBB绝对值达最大, 为 -64 ℃, 22:00[图9(b)], 该对流云团右前方新生一对流云团, 其亮温达-52 ℃, 说明该云团在生成初期发展较为强烈, 此时湘北雨强逐渐增大, 23:00[图9(c)], 两个对流云团发展至旺盛阶段, 位置上略有东移, 暖云覆盖湘西北及湘北大部分地区。5月1日01:00[图9(d)], 两个对流云团结构逐渐松散, 强度明显减弱, 至03:00对流云团消亡, 西部对流云团在湘西北呆3 h向东移, 东部对流云团移动缓慢, 在湘东北停留6~7 h, 因此造成湘东北降水强度更大。
从2016年7月17日 卫星黑体亮温TBB演变图(图10)中可以看出, 2016年7月17日08:00湘西中南部M βCS逐渐发展加强, 中心TBB达到-62 ℃, 湘西州中南部开始产生降水, 最大小时降雨量19.4 mm(07:00 -08:00古丈山枣)。随后贵州东北部的M βCS加强向东移动, 带动湘西中南部对流云团发展, 11:00贵州东移的M βCS和湘西缓慢东移的M βCS合并强烈发展, 主体稳定维持在湘西中南部, 这个时段整个湘西中部雨势加强, 小时最大雨强达到48.8 mm(09:00 -10:00古丈岩槽河水库)。12:00位于吉首和古丈之间的对流云团发展到最强(TBB≤-72 ℃), 此时是此次降水最强时段, 最强小时雨强达到104.9 mm(11:00 -12:00古丈默戎)。14:00 M αCS分裂为两个TBB值≤-72 ℃的M βCS, 随后向东北方向移动, 造成湘西南、 湘东北强降水; 15:00 -18:00湘东南有一M βCS迅速发展并与江西东南部M βCS合并为M αCS, 中心TBB≤-72 ℃, 造成湘东南地区大范围的短时强降雨, 郴州安仁县大源水库14:00 -15:00雨量达45.1 mm; 同时东移至湘东北的对流云团强烈发展为α尺度云团, 造成岳阳地区强降水, 岳阳华容县三封寺镇15:00 -16:00雨强达85 mm。18:00 -20:00位于湘东北和湘东南的对流云团逐渐减弱并移出湖南省, 强降水过程基本结束。
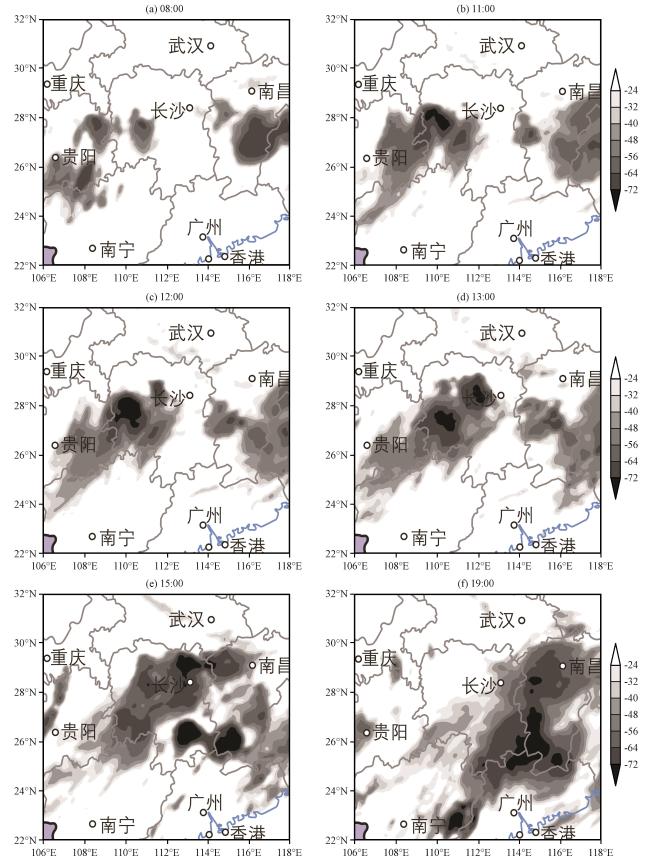
总体而言, “7·17”过程对流云团发展更强盛, 中心强度和影响范围均强于“4·30”过程, 因此小时雨强更大。同时, 云顶亮温特征显示, 最强小时雨强与TBB最低值出现的时段有较好的匹配, 且强降水出现在对流云团移动方向左前方TBB梯度较大的区域, 该区域是也是未来冷云盖的扩展方向。
3.7 雷达回波分析
雷达基本反射率因子表明, “4·30”过程暴雨发生前, 分散的积层混合性降水回波在湘北地区发展, 22:16回波带开始成片, 回波带的西南部不断有新的回波补充, 回波的面积进一步扩大, 23:44大于45 dBz回波发展成东西的带状分布, 回波带的移动方向和带状回波的夹角明显偏小, 出现了明显的列车效应。“7·17”过程11:00, 吉首北部古丈西南部强回波生成发展, 最强回波中心为45 dBz, 为积状云降水回波, 且一直维持在吉首北部古丈西南部之间, 11:36此时默戎上方回波强度为42 dBz, 默戎最强分钟降水达到3.5 mm。11:47强回波块东移出默戎, 降水强度减弱, 中尺度积云对流单体在默戎停留造成短时暴雨。对暴雨中心的对流单体做剖面分析, 强降雨期间默戎上空有40 dBz以上的高反射率因子核心, 且高度位于2 km左右, 属于低质心高效率降水回波, 持续了10个体扫。此次默戎的短时强降水是准静止中尺度对流系统影响造成的。
“4·30”过程径向速度图表现出明显的辐合特征(负速度的面积大于正速度的面积), 有利的辐合特征有利于强降水的继续维持。“7·17”过程11:36径向速度剖面图显示, 默戎上空附近有一中气旋, 从底部(2 km)一直向上扩展到6 km左右, 由于距离较远(距离雷达96 km左右), 最低仰角(0.5°)到了超级单体距离处已经接近2 km高, 回波演变显示中气旋逐渐向下延伸, 弱中气旋表明对流有组织性, 不会很快消散, 并且气流辐合有利水汽辐合, 加强上升运动和降水发展(唐明晖等, 2012)。
从“4·30”过程强降水时段的速度方位显示风廓线(简称VWP)(图11)中可以看出, “4·30”过程1日00:12以前, VWP显示, 0.6 km以上为西南风, 0.6 km以下为东南风, 随高度增加由东南风顺转为西南风, 表现为暖平流特征; 中低层西南风速达到了12~16 m·s-1, 且扩展到了6 km, 水汽输送非常旺盛。00:12开始, 底层有偏北风的侵入, 说明地面辐合线影响着湘东北地区并逐渐南压, 但仅维持了不到3 h, 02:48底层又转为东南风, 此时地面辐合线减弱消失。在底层的风由东南风转为东北风又转为东南风的阶段, 为对流发展最旺盛的阶段, 也是降水强度最集中的阶段, 意味着地面辐合线影响触发湘东北短时强降水。
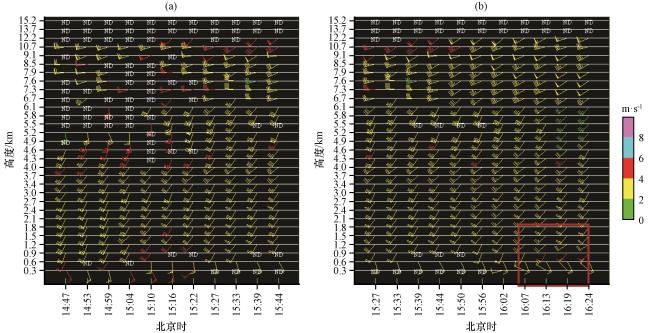
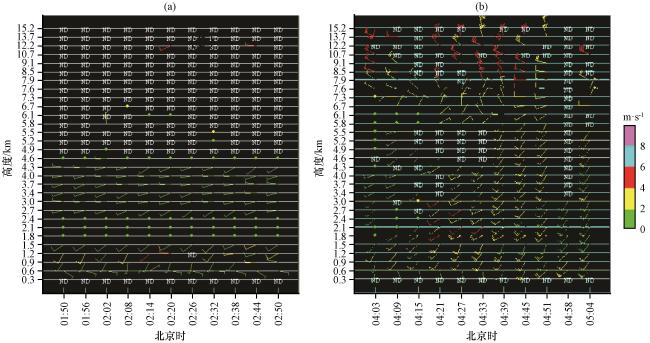


两次暴雨均为低质心高效率的降水回波造成, “4·30”过程出现明显的列车效应, 而“7·17”过程暴雨强回波的面积更大, 且回波移动缓慢, 主要表现为停滞型回波; “4·30”过程为明显的风速辐合, “7·17”过程出现中气旋; “4·30”过程西南急流旺盛, 水汽条件更强, 造成强降水范围更广, 底层的风由东南风转为东北风, 说明地面辐合线触发湘东北短时强降水; “7·17”过程局地性强降水发生在非西南急流背景下, 西南风明显偏弱。
3.8 预报失败原因分析
这两例弱天气尺度背景下暖区暴雨短期是预报失败的, 主要原因有三个, 首先模式预报是有偏差的, 对暴雨有所漏报, 会影响预报员的判断。其次, 预报员更多关注大尺度影响下的暴雨, 对弱天气尺度背景下暖区暴雨是忽视的, 暴雨预报是滞后的。最后, 预报员不清楚弱天气尺度背景下暖区暴雨的触发机制, 导致预报时没有关注低层中尺度系统。
4 预报着眼点探讨
通过2008 -2019年湖南弱天气尺度暖区暴雨的统计分析和两例不同类型预报难度大且造成一定影响的个例对比分析, 总结湖南弱天气尺度暖区暴雨的预报着眼点, 为今后暖区暴雨的预报提供参考:
(1) 强西南急流型暖区暴雨预报: 当高空处于一致南风下, 即使20:00没有达到急流标准, 夜间暖湿气流增强导致降水加强。从天气系统角度, 暴雨落区与低空急流、 地面中尺度系统位置有关, 暴雨落区位于低空急流左侧的气旋式辐合区和地面辐合线附近。低空急流与暴雨有正反馈作用, 同时加强, 地面辐合线在暴雨发生前2~3 h生成, 地面辐合线的维持与暴雨持续发展密切有关, 随着辐合线减弱南压, 降水结束。从物理量角度, 低层水汽辐合强度与范围决定降水强度及范围, 并且水汽条件有2~3 h提前量, 水汽持续供应也与暴雨持续有关, 水汽辐散时降水结束; 垂直螺旋度大值区与暴雨区匹配很好, 且螺旋度对降水开始有2~3 h提前量, 螺旋度最强时, 降水最强。春季热力因子也有作用, 但不是关键因子。
(2) 副高型暖区暴雨预报: 中低层切变线会破坏副高稳定性结构, 导致副高东退, 切变线附近辐合上升运动, 出现降水, 但暴雨发生与地面中尺度气旋、 干线或地面辐合线等触发条件有关。从天气系统来看, 暴雨落区与低层切变线、 700 hPa干线和地面中尺度系统位置密切相关, 而低层切变线、 700 hPa干线和地面中尺度系统对暴雨发生有2~3 h提前量。从物理量角度, 水汽条件与暴雨落区对应不好, 指示意义不大; 低层螺旋度与暴雨区匹配较好, 对暴雨开始有2~3 h提前量; 另外热力不稳定层结越强, 小时雨强越强。
5 结论与讨论
本文将2008 -2019年4 -9月湖南弱天气尺度背景下暖区暴雨按天气形势分为强西南急流型和副高型, 并选取两例预报难度大、 造成一定影响的个例对比分析, 最终寻找这两类暖区暴雨预报着眼点供预报员参考, 得到以下结论:
(1) 湖南弱天气尺度背景下暖区暴雨依据500 hPa影响系统分为两类: 一类为强西南急流型, 500 hPa高空槽位置较远或短波槽影响, 湖南省处于高空槽前西南气流中, 中低层西南暖湿气流旺盛, 切变线不明显, 暴雨区常位于边界层切变附近和急流轴出口区左侧的水汽充沛区域, 在地面辐合线触发下产生暴雨; 另一类是副高型, 500 hPa副高西伸北抬, 控制湖南省大部分地区, 具有明显的热力不稳定层结, 在边界层925 hPa切变或地面辐合线作用下产生暴雨。
(2) 从两类暖区暴雨季节特征来看, 强西南急流型主要发生在春季, 南支槽为湖南地区输送充沛的水汽, 在边界层中尺度系统影响下, 促使暖湿空气抬升, 不稳定能量释放产生暴雨; 副高型暖区暴雨发生在7月下旬到8月初, 副高基本控制湖南省, 不稳定能量高, 边界层辐合系统抬升下产生暴雨。从两类暖区暴雨日变化特征来看, 强西南急流型一天任何时刻均会出现, 持续多个时次, 夜间降水频次增多。副高型的日变化明显, 主要出现在白天, 降水峰值出现在上午(08:00 -11:00)。两类暖区暴雨的空间分布表现为: 强西南急流型降水范围广, 强度大, 多出现在湘南地区, 当西南急流非常强盛, 北推到长江中下游地区时, 也会导致湘北出现暴雨。副高型降水发生在副高内部, 较分散, 在湘西北、 湘北及湘东南地区均有出现, 局地性强, 对流性明显, 小时雨强大。
(3) “4·30”过程和“7·17”过程分别属于强西南急流型和副高型暖区暴雨。这两次过程存在一定相似性和差异, 相同点: 地面均为热低压控制, 地面中尺度系统均为这两次弱天气尺度强迫下暖区暴雨的主要触发机制。当天气尺度系统作用不明显时, 我们要关注中小尺度天气系统的作用。所不同的是: 高空500 hPa影响系统不同, “4·30”过程处于槽前偏南气流控制下, “7·17”过程为副高控制下; “4·30”过程中低层没有明显的切变线影响, “7·17”过程中低层弱切变线影响; “4·30”过程比“7·17”过程低层风速更强盛。
(4) 从环境场条件对比分析表明, “7·17”过程由于副高阻断水汽供应, 水汽供应与辐合强度均较差, 因此降水范围小, “4·30”过程与水汽供应、 水汽辐合强度范围关系更密切。两次暴雨过程均存在对流不稳定层结, “7·17”过程低层热力不稳定能量更大且热力不稳定层结更强。两次过程垂直螺旋度有显著的变化, 与暴雨落区很好对应。“4·30”过程暴雨区上空整层垂直螺旋度负值区表征整层气旋性涡度垂直向上输送, 700~800 hPa和400 hPa存在螺旋度负值中心, 表示700 hPa切变线造成暴雨区强上升辐合导致强降水发生。“7·17”过程600 hPa高度以下垂直螺旋度的负值区, 表征了气旋性涡度的垂直向上输送, 负值区中心位于900 hPa高度, 主要由近地层中小尺度系统影响造成暴雨。
(5) β中尺度辐合线为“4·30”过程强降水的触发机制。γ小尺度气旋为“7·17”过程的触发机制。“7·17”过程对流云团的中心强度和影响范围均强于“4·30”过程, 并且最强小时雨强与TBB最低值出现的时段匹配较好, 且强降水出现在对流云团移动方向左前方TBB梯度较大的区域。地面中尺度触发系统使地面暖湿气流辐合抬升, 触发对流强烈发展, 对暴雨落区和发生时间有较好指示意义。两次暴雨均为低质心高效率的降水回波造成, “4·30”过程出现明显的列车效应, 而“7·17”过程暴雨强回波的面积更大, 且回波移动缓慢, 主要表现为停滞型回波; “4·30”过程为明显的风速辐合, “7·17”过程出现中气旋; 风廓线资料显示“4·30”过程西南急流旺盛, 水汽条件更强, 造成强降水范围更广, 底层的风由东南风转为东北风, 说明地面辐合线触发湘东北短时强降水; “7·17”过程局地性强降水发生在非西南急流背景下, 西南风明显偏弱。
在实际暖区降水预报业务中, 不仅要关注大尺度系统造成的抬升作用, 弱天气尺度背景下更要细致分析地面辐合线等中小尺度系统造成的局地抬升作用。由于数值模式对弱天气尺度背景下暖区暴雨预报能力有限, 需要提高预报员对多源观测资料的综合分析能力和对数值预报产品的释用能力, 尤其加强中尺度模式应用和检验。本文主要针对两类暴雨中的各一个个例的对比分析, 提炼的预报着眼点有一定的普适性, 但在业务应用中还需根据实际情况具体分析。目前湖南弱天气背景下暖区暴雨只有10例, 个例数不足, 上述研究结果还需更多新的个例来补充和修正。在以后研究中我们继续补充个例, 进一步提炼弱天气背景下暖区暴雨预报指标。从地形来看, 湖南东、 南、 西三面山地环绕, 地形强迫抬升作用和喇叭口地形的辐合作用均导致降水增强, 下一步我们将选取暴雨区位于山区的个例, 通过数值模拟研究地形的增幅作用。