
1 引言
2 资料选取与方法介绍
3 研究结果
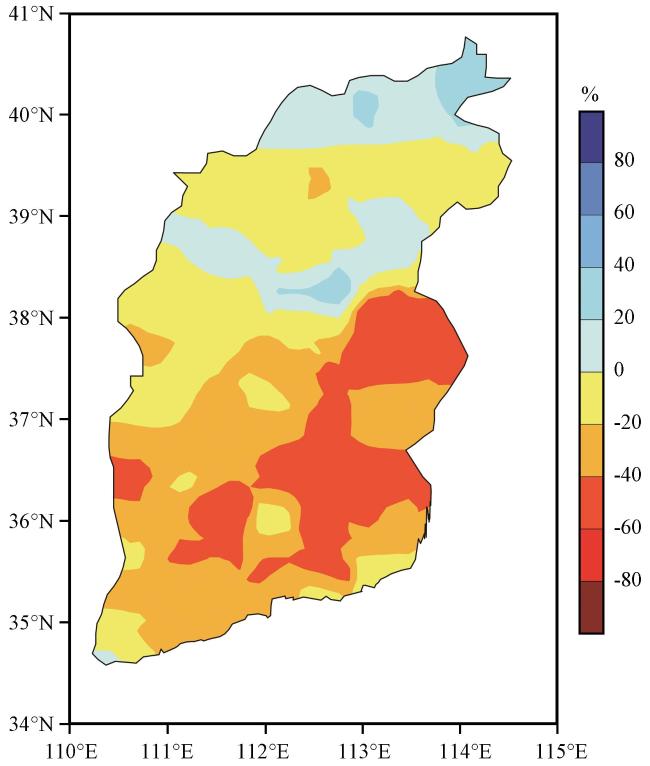
3.1 降水特点
3.2 大气环流异常
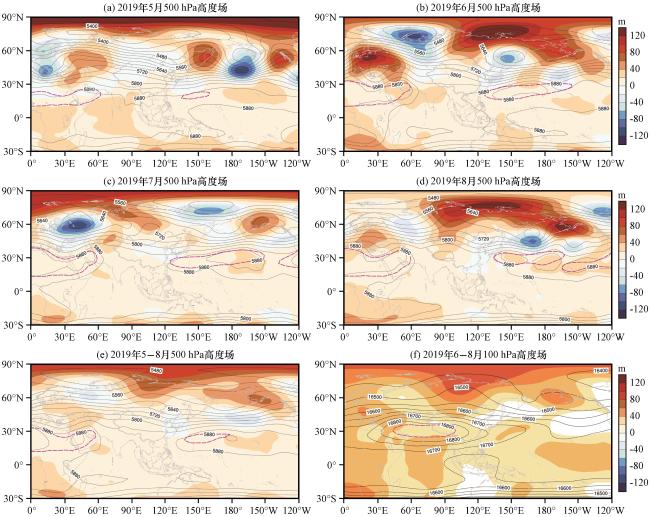
图2 2019年5 -8月500 hPa和6 -8月100 hPa环流特征(单位:m)等值线为高度场,阴影为高度异常场,紫色虚线:副高(a~e)和南亚高压(f)气候态位置 Fig.2 Circulation characteristics of 500 hPa from May to August and 100 hPa from June to August in 2019. Unit: m. Contour lines represent height fields, shaded areas represent height anomaly fields, purple dotted lines: climatological position of Western Pacific subtropical high (a~e) and South Asia high (f) |
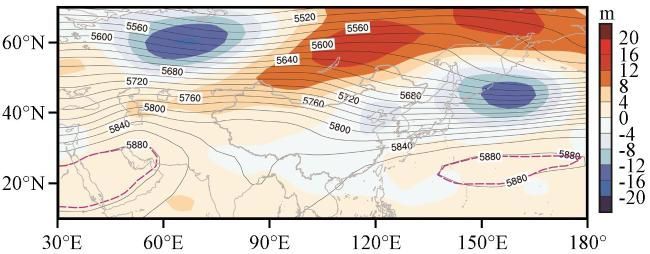
图5 历史5 -8月降水偏少年份500 hPa高度场合成(单位:m)等值线为高度场,阴影为高度异常场,紫色虚线为副高气候态位置 Fig.5 The composition of 500 hPa height field from May to August in the years of less precipitation. Unit: m. Contour lines represent height fields, shaded areas represent height anomaly fields, purple dotted lines: Climatological position of Western Pacific subtropical high |
3.3 海温异常特征
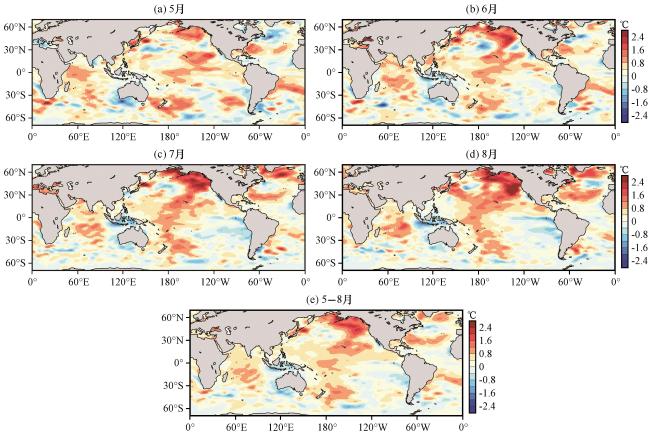
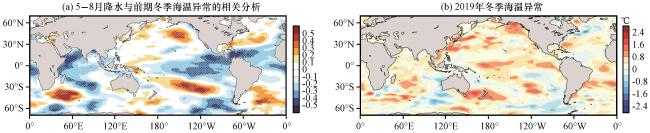
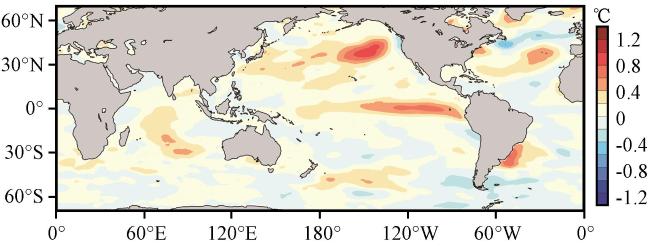
图7 山西近40年5 -8月降水EOF1时间分量与前期(12月至次年2月)冬季海温异常场的相关性分析(a,打点区域为通过95%显著性检验)和2019年冬季海温异常场(b,单位:℃)Fig.7 Correlation analysis between EOF1 of precipitation from May to August in recent 40 years in Shanxi and SST anomaly field in winter (December-February) (a, dotted areas represent the significance over 95% level) and SST anomaly field in winter of 2019 (b, unit:℃) |