
1 引 言
2 数据选取和方法介绍
2.1 GPS掩星资料
2.2 判断边界层高度方法
3 结果分析
3.1 掩星观测误差与折射率垂直梯度的关系
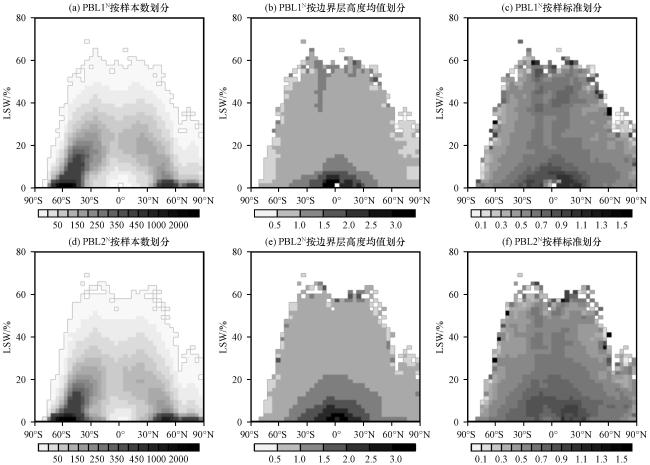
表1 2007 -2014年掩星资料-dN/dz、 -dN wet/dz与LSW线性回归统计参数Table 1 Statistical parameters of linear regression between -dN/dz, -dN wet/dz and LSW of COSMIC data during 2007 -2014 |
| 边界层 | 自变量 /(N-unit·km-1) | 因变量 /% | 线性方程 | 相关 系数 |
|---|---|---|---|---|
| PBL1N | -dN/dz | LSW | 0.60 | |
| PBL1N | -dNwet/dz | LSW | 0.68 | |
| PBL2N | -dN/dz | LSW | 0.68 | |
| PBL2N | -dNwet/dz | LSW | 0.69 |
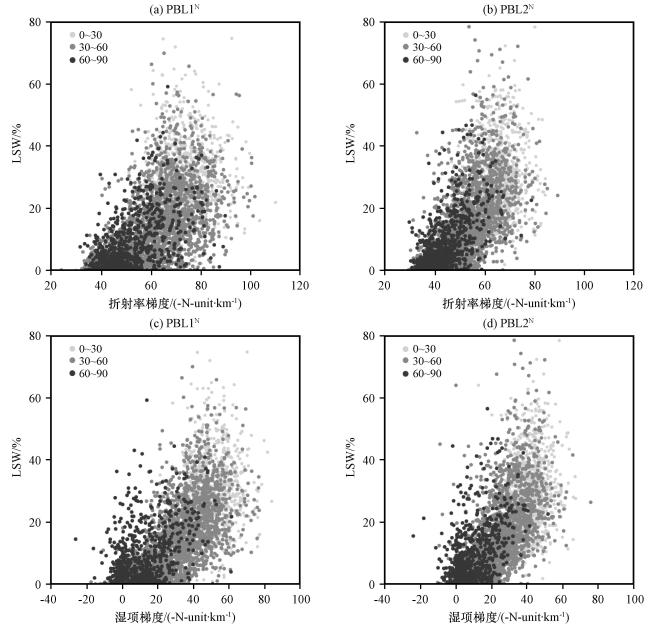
图6 2007年COSMIC掩星资料折射率确定的第一、 第二边界层高度处折射率梯度(a, b)与折射率梯度湿项(c、 d)分别与LSW散点分布散点按纬度划分颜色 Fig.6 Scatter plot of refractivity gradient and LSW (a, b), wet term of refractivity gradient and LSW (c, d) at PBL1N and PBL2N determined by COSMIC occultation data in 2007.The scattered points are color-divided by latitude |
3.2 基于掩星观测误差与折射率垂直梯度的质量控制方案
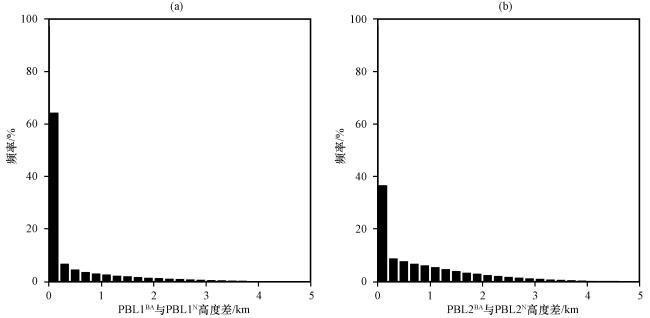
图7 2007 -2014年COSMIC掩星资料不同判别方法第一(a)、 第二(b)边界层高度差频率分布Fig.7 Frequency distribution of PBL1diff (a) and PBL2diff (b) determined by COSMIC occultation data during 2007 -2014 |
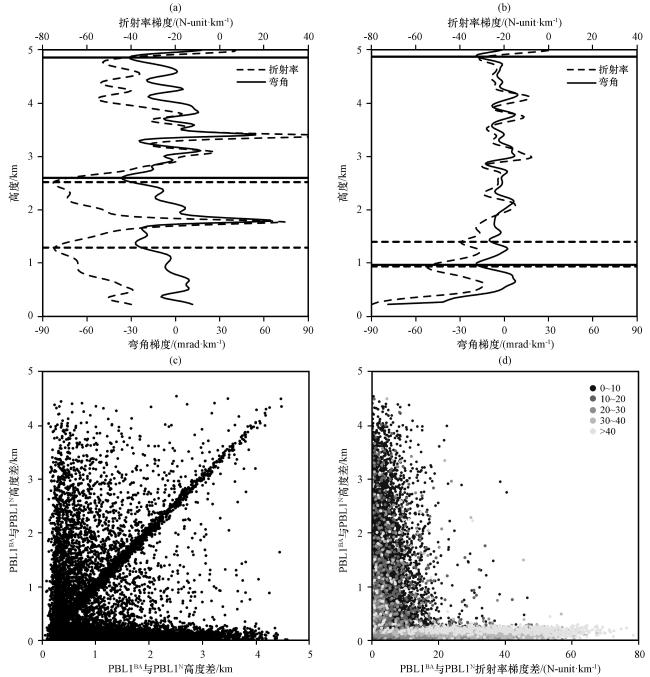
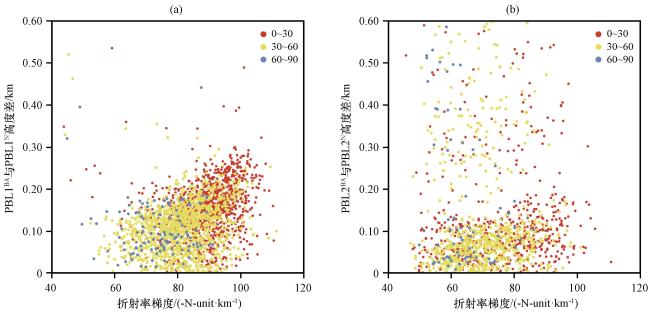
图8 COSMIC掩星资料不同判别方式边界层高度差异较大的梯度廓线(a, b), 依据折射率判断的第一、 第二边界层高度(c)和梯度(d)差异与不同判别方式判断的第一边界层高度差异的散点分布散点依据弯角判断的第一、 第二边界层梯度差异划分颜色 Fig.8 (a), (b) Gradient profile of COSMIC RO data with large PBLdiff, Scatter plots of difference of PBL1N and PBL2N (c)、 gradient of PBL1N and PBL2N (d) and PBL1diff.The scattered points are color-divided by the gradient difference of PBL1BA and PBL2BA |
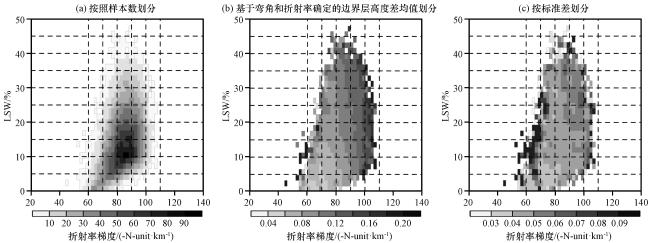
图10 2007 -2014年COSMIC掩星资料折射率确定的第一边界层梯度与对应LSW分布Fig.10 The gradient of PBL1N corresponding to LSW of COSMIC RO data in 2007 -2014 is divided into colors according to the number of samples (a), average (b, unit: km) and standard deviation (c, unit: km) of PBL1diff |
表2 基于弯角和折射率判断的第一边界层高度差Table 2 Difference of PBLH1 based on bending angle and refractivity |
| LSW /% | -dN/dz(N-unit/km) | |||
|---|---|---|---|---|
| 70 | 80 | 90 | 100 | |
| 5 | 60 | 80 | 120 | - |
| 10 | 80 | 100 | 120 | 160 |
| 15 | 100 | 100 | 120 | 160 |
| 20 | 100 | 100 | 120 | 160 |
| 25 | - | 120 | 120 | 160 |
| 30 | - | 120 | 140 | - |
| 35 | - | 120 | 140 | - |
-表示无数据 |