1 引言
2 研究区域、 数据和模式
2.1 研究区域
2.2 数据来源
2.2.1 鄂陵湖观测数据
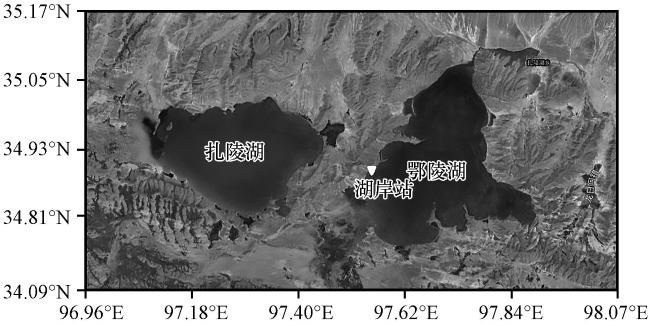
图1 研究区域及站点(倒三角)位置(宋兴宇等, 2020)Fig.1 Study area with location of the observation station (the inverted triangle) (From Song et al, 2020) |
2.2.2 Kilpisjärvi湖数据
2.2.3 MODIS地表温度数据
2.3 模式介绍及设置
2.3.1 模式介绍
2.3.2 模式设置
2.3.3 评估方法
3 特征分析
3.1 湖温特征分析
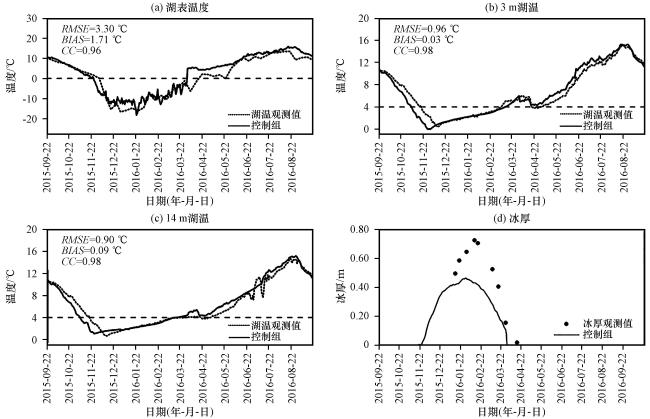
图2 控制组模拟的鄂陵湖湖表温度(a)、 3 m湖温(b)、 14 m湖温(c)和冰厚(d)分别与其观测值对比横虚线分别为0 °C基准线(a)和4 °C基准线(b~c) Fig.2 Comparison between the simulated surface lake temperature (a), 3 m lake temperature (b), 14 m lake temperature (c) and ice thickness (d) by the control simulation with the observed values.The dotted lines are 0 °C baseline (a) and 4 °C baseline (b~c) |
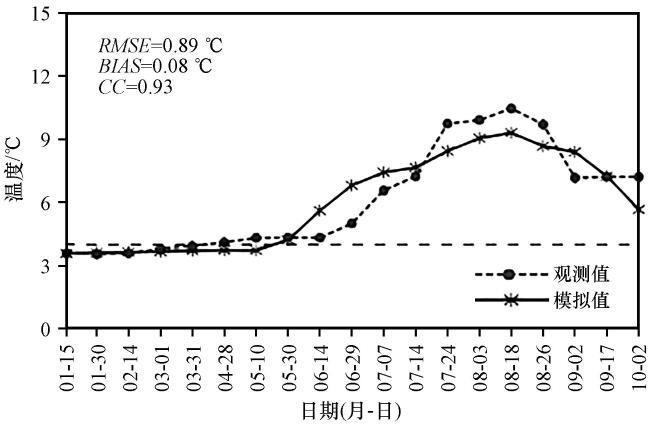
3.2 局地气候特征分析
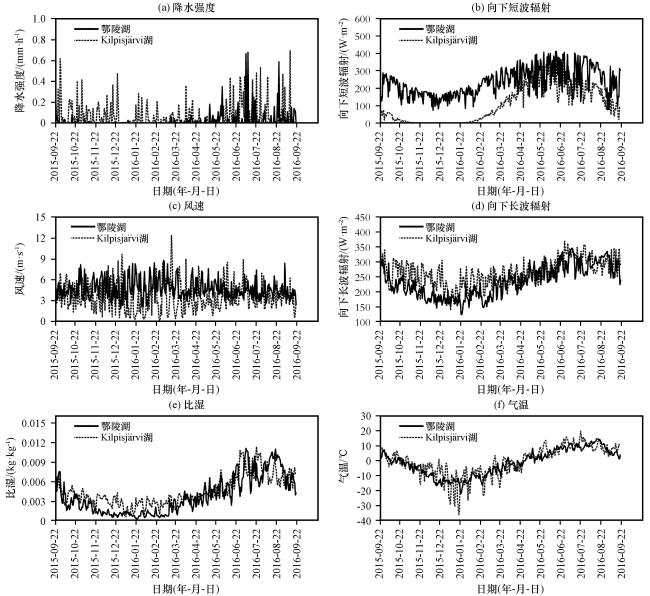
图4 鄂陵湖和K湖各驱动气象要素对比Fig.4 Comparison of driving meteorological forcings between Nogring Lake and K Lake |
表1 鄂陵湖和K湖冬季冰期(2015-11-22/2016-04-22)各驱动气象要素对比Table 1 Comparison of driving meteorological elements between Nogring Lake and K Lake in winter ice period (2015-11-22/2016-04-22) |
| 气象要素 | 鄂陵湖 | Kilpisjärvi湖 | ||
|---|---|---|---|---|
| 范围 | 平均值 | 范围 | 平均值 | |
| 降水强度/(mm·h-1) | 0~0.05 | 0.004 | 0~0.45 | 0.05 |
| 向下短波辐射/(W·m-2) | 60~340 | 196.001 | 0~220 | 41.71 |
| 风速/(m·s-1) | 2~9 | 4.98 | 0~12 | 3.50 |
| 向下长波辐射/(W·m-2) | 120~270 | 191.98 | 140~310 | 233.73 |
| 比湿/(kg·kg-1) | ≤0.0045 | 0.0014 | ≤0.0041 | 0.0027 |
| 气温/°C | -23~4 | -9.81 | -38~3 | -9.15 |
4 评估结果
4.1 鄂陵湖模拟评估
4.2 K湖评估结果
5 原因分析
5.1 局地气候特征的影响
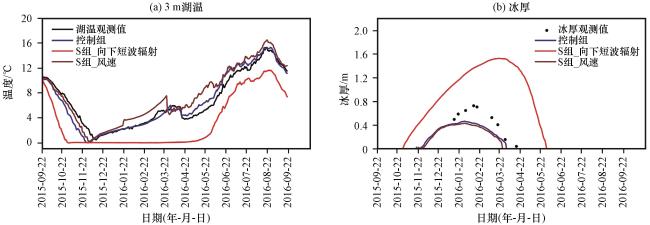
5.1.1 风速和向下短波辐射
5.1.2 降水强度和向下长波辐射
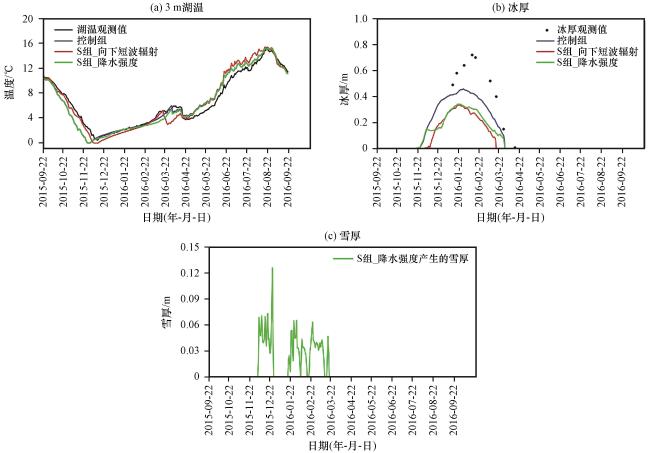
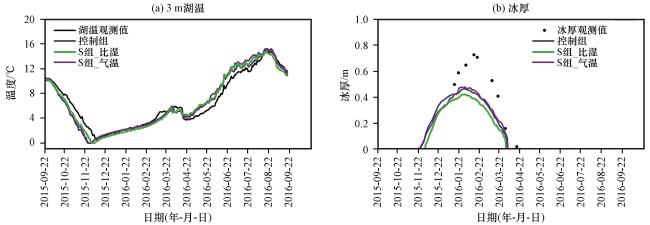
图6 降水强度、 向下长波辐射单要素替换后模拟的3 m湖温(a)和冰厚(b)与其观测值对比及降水替换后的雪厚(c)S表示实验组 Fig.6 Comparison of the simulated 3 m lake temperature (a) and ice thickness (b) after the single-element replacement of downward longtwave radiation and precipitation with the observed values, and the snow thickness (c) after the replacement of precipitation.S represents the experimental group |