
1 引言
2 研究区概况与研究方法
2.1 研究区概况
2.2 研究资料
2.3 湍流谱计算
2.4 湍流方差相似性规律
2.5 数据处理
3 结果与分析
3.1 通量变化特征
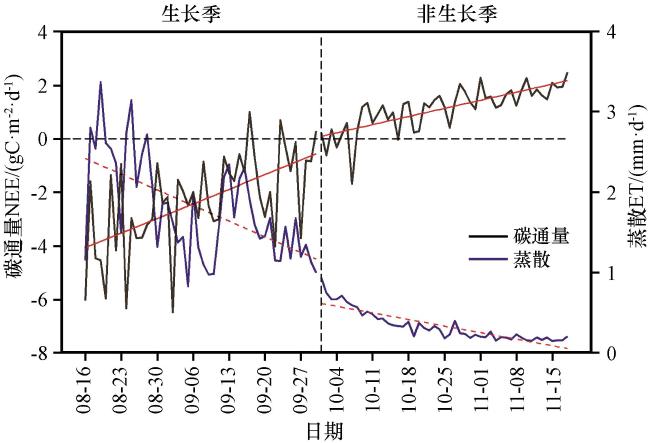
图1 净生态系统CO2交换(NEE)和蒸散(ET)日变化特征垂直和水平的黑色虚线分别表示生长季/非生长季分界和NEE的零值线, 红色实线表示NEE的变化趋势, 红色虚线表示ET的变化趋势 Fig.1 Daily variation of net ecosystem CO2 exchange (NEE) and evapotranspiration (ET).The vertical black dotted line indicate the boundary between the growing and non-growing seasons, the horizontal black dotted lines indicate the zero-value line for NEE, respectively, the red solid line indic-ates the changing trend of NEE, and the red dotted line indicates the changing trend of ET |
3.2 大气湍流条件日变化和频谱特征
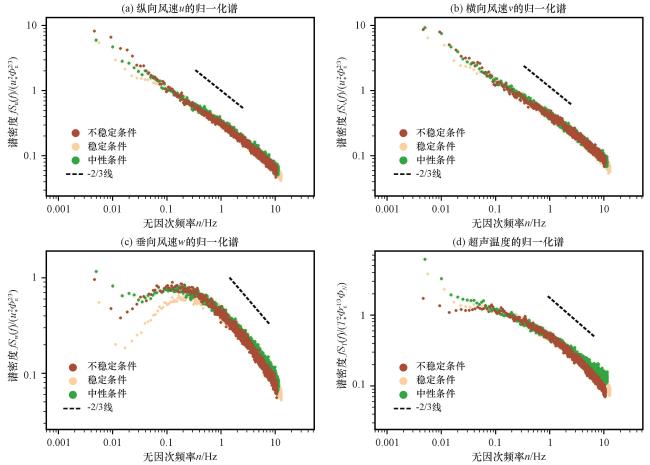
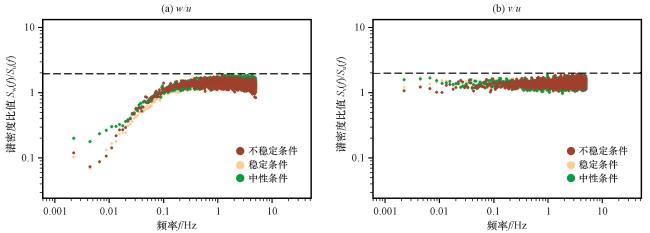
3.3 大气湍流相似性规律
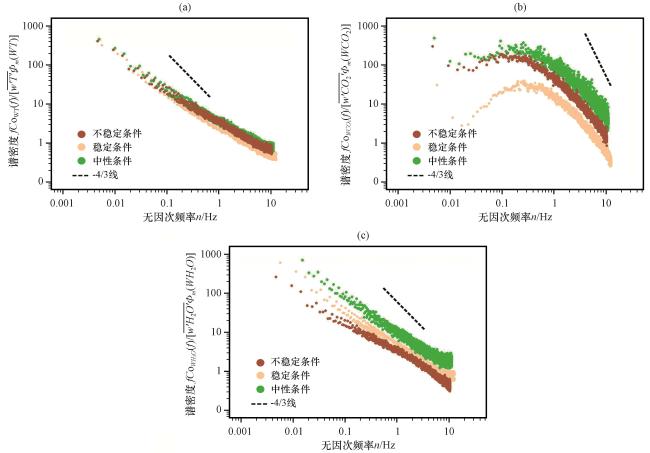
图7 不同大气稳定度下垂直方向(w)风速分别与温度(a)、 CO2(b)和H2O(c)的归一化协谱Fig.7 Normalized cross-spectra of temperature (a), CO2 (b) and H2O (c) and wind speed at vertical direction (w) with different atmospheric stability |
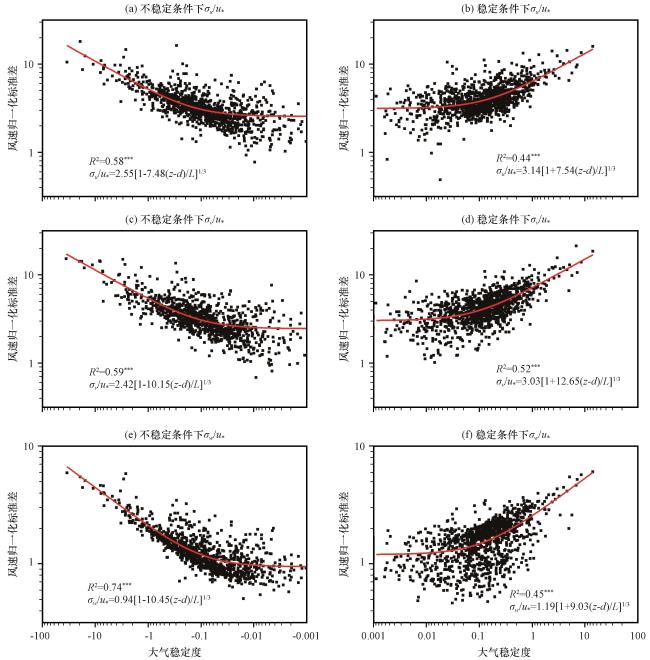
图8 生长季u(a, b)、 v(c, d)和w(e, f)风速归一化标准差与大气稳定度的关系红色直线为拟合曲线, ***表示极显著, **表示较显著, *表示显著 Fig.8 The relationship between the normalized standard deviation of wind speed of u (a, b)、 v (c, d) and w (e, f) and atmosphere stability during the growing season.The red solid line indicates the fitting curve.*** means extremely significant, ** means more significant, * means significan |
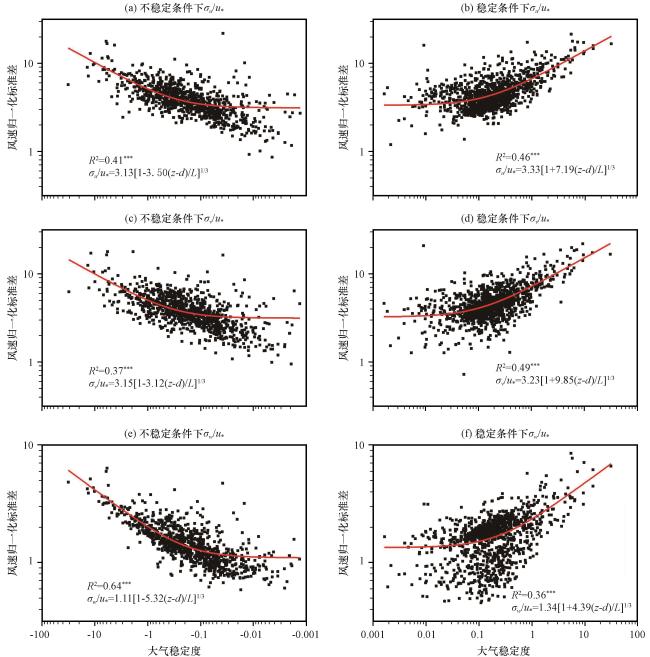
图9 非生长季u(a, b)、 v(c, d)和w(e, f)风速归一化标准差与大气稳定度的关系红色直线为拟合曲线, ***表示极显著, **表示较显著, *表示显著 Fig.9 The relationship between the normalized standard deviation of wind speed of u (a, b)、 v (c, d) and w (e, f) and atmosphere stability during the non-growing season.The red solid line indicates the fitting curve.*** means extremely significant, ** means more significant, * means significant |
4 讨论
表1 青藏高原地区大气近中性条件下风速归一化标准差Table 1 Normalized standard deviation of wind speed under atmosphere stable conditions in the Qinghai-Tibet Plateau |
| 观测位置 | 下垫面类型 | 时间 | 风速归一化标准差 | 参考文献 | ||
|---|---|---|---|---|---|---|
| 蔡公堂(本文) | 高寒草甸 | 8 -9月 | 2.84 | 2.73 | 1.07 | 本研究 |
| 10 -11月 | 3.23 | 3.19 | 1.22 | 本研究 | ||
| 疏勒河上游 | 高寒草甸 | 5 -9月 | 3.40 | 3.08 | 0.96 | 吴灏等(2013) |
| 玛曲观测场 | 高寒草甸 | 1 -7月 | 3.11 | 2.74 | 0.96 | 陈云刚等(2014) |
| 理塘观测站 | 高山草甸 | 2 -4月 | 4.30 | 4.10 | 1.00 | 李英等(2008) |
| 安多(那曲地区) | 高寒草甸 | 5 -9月 | 4.01 | 3.85 | 1.43 | 马耀明等(2002) |
| 聂荣观测站 | 高寒草甸 | 7 -8月 | 3.93 | 3.88 | 1.06 | 杨丽薇等(2017) |
| 昌都观测站 | 高山峡谷草地 | 5 -6月 | 3.45 | 3.15 | 1.30 | 卞林根等(2001) |
| 珠峰北坡 | 高原河谷草甸 | 4 -12月 | 3.36 | 3.20 | 1.08 | 仲雷等(2006) |
| 当雄河谷区 | 河谷草甸 | - | 3.40 | 2.45 | 1.15 | 周明煜等(2000) |
| 羊卓雍错流域 | 湖面 | 4 -10月 | 3.54 | 3.88 | 0.77 | 沈鹏珂和张雪芹(2019) |
| 改则地区 | 干旱草地 | 6 -7月 | 3.21 | 2.69 | 1.46 | 刘辉志和洪钟祥(2000) |
| 绒布寺河谷区 | 稀疏植被 | 6 -12月 | 3.10 | 2.93 | 1.05 | 刘辉志等(2007) |