
1 引言
2 资料来源与研究方法
2.1 资料来源
2.1.1 GLDAS-CLM
2.1.2 降水资料
2.1.3 其他资料
2.2 研究方法
2.2.1 合成分析
2.2.2 奇异值分解法
3 研究内容
3.1 青藏高原5月土壤湿度时空分布特征
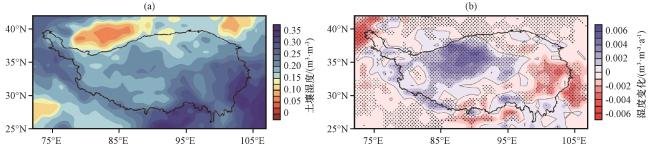
图1 青藏高原春季土壤湿度(a, 单位: m3·m-3)及其趋势变化(b, 单位: m3·m-3·a-1)的空间分布(b)中打点区域为通过了95%置信度检验 Fig.1 The spatial distribution of spring soil moisture (a, unit: m3·m-3) and its trend change (b, unit: m3·m-3·a-1)on the Qinghai-Xizang Plateau.The dotted areas have past the 95% confidence level in Fig.1(b) |
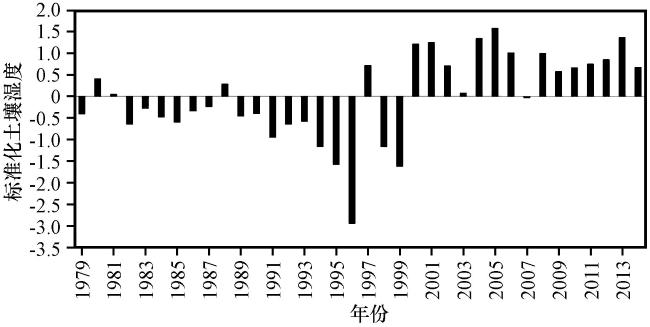
图2 1979 -2014年青藏高原春季土壤湿度标准化时间序列Fig.2 Normalized time series of spring soil moisture in the Qinghai-Xizang Plateau from 1979 to 2014 |
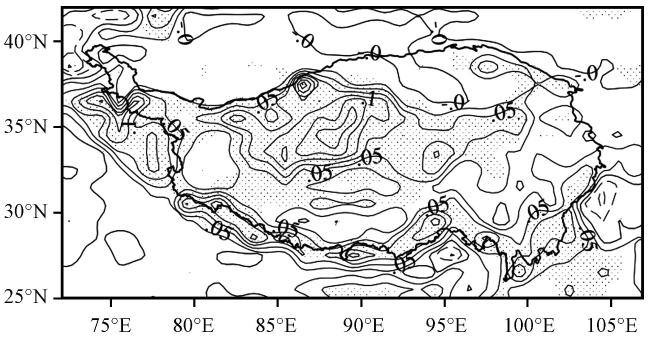
图3 1979 -2014年青藏高原5月土壤湿度异常偏高年减去偏低年合成的土壤湿度差值(单位: m3·m-3)打点区域为通过了90%置信度检验 Fig.3 The difference of soil moisture(unit: m3·m-3) between the abnormally high soil moisture and the low soil moisture in May over the Qinghai-Xizang Plateau from 1979 to 2014.The dotted areas are with 90% confidence level |
3.2 青藏高原5月土壤湿度与我国7月降水的关系
表1 青藏高原春季0~10 cm土壤湿度与中国夏季降水SVD前5个模态相关系数及方差贡献Table 1 The correlation coefficients and variance contributions of the top 5 modes of SVD between spring 0~10 cm soil moisture on the Qinghai-Xizang Plateau and summer precipitation in China |
| SVD模态 | 奇异值 | 模态相关系数R | 累计平方协方差贡献率/% | 左场对方差贡献/% | 右场对方差贡献/% |
|---|---|---|---|---|---|
| 第一模态 | 448.956 | 0.74* | 20.29 | 12.4 | 8.59 |
| 第二模态 | 402.36 | 0.72* | 36.58 | 12.37 | 7.41 |
| 第三模态 | 366.309 | 0.82* | 50.09 | 6.71 | 8.8 |
| 第四模态 | 262.895 | 0.87* | 57.05 | 3.21 | 8.35 |
| 第五模态 | 248.502 | 0.73* | 63.26 | 4.71 | 7.27 |
*表示通过了99%的置信度检验 |
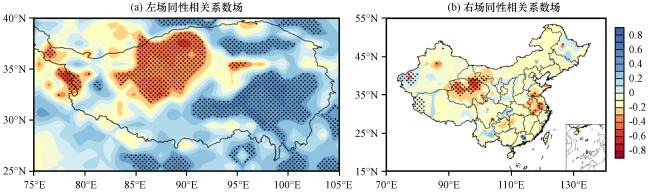
图4 1979 -2014年青藏高原春季0~10 cm土壤湿度与中国夏季降水SVD第一模态特征向量分布打点区域为通过了95%置信度检验 Fig.4 Distribution map of the first modal characteristic vector of SVD between 0~10 cm soil moisture in spring on the Qinghai-Xizang Plateau and rainfall in summer in China from 1979 to 2014.The dotted areas with 95% confidence level |
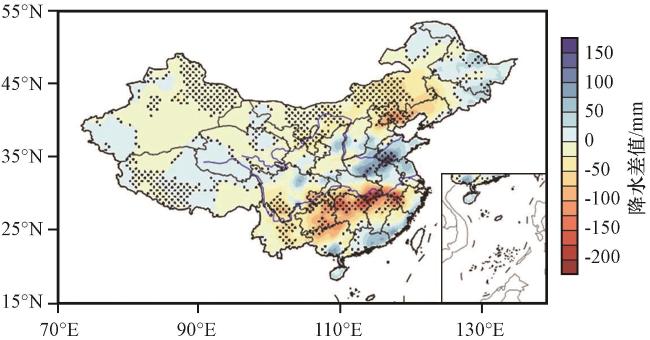
图5 1979 -2014年青藏高原5月土壤湿度异常偏高年减去偏低年合成的7月降水量(单位: mm)差值打点区域为通过了90%置信度检验, 台湾省无数据 Fig.5 The difference of July precipitation (unit: mm) between the abnormally high soil moisture and the low soil moisture in May over the Qinghai-Xizang Plateau from 1979 to 2014.The dotted areas with 90% confidence level.Nodata for Taiwan Province |
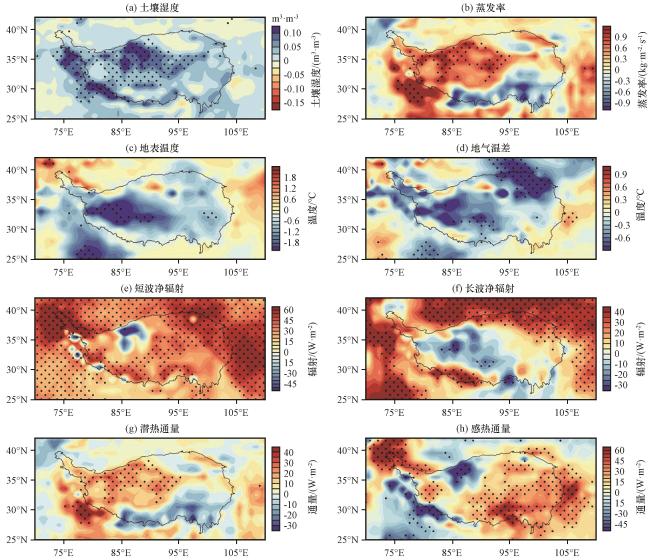
3.3 青藏高原5月土壤湿度异常与地表热力状况的关系
3.4 青藏高原5月土壤湿度异常与环流的关系
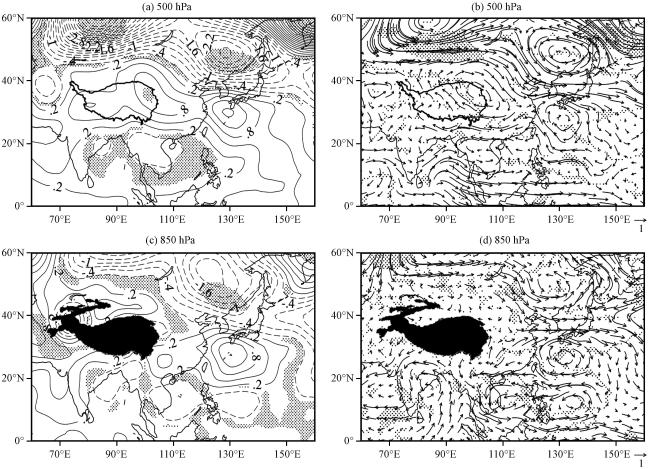
图7 1979 -2014年青藏高原5月土壤湿度异常偏高年减去偏低年合成的7月位势高度场(左, 单位: gpm)与风场(右, 单位: m·s-1)差值打点区域为通过了90%置信度检验 Fig.7 The difference of geopotential height field (left, unit: gpm) and wind field (right, unit: m·s-1) between the abnormally high soil moisture and the low soil moisture in May over the Qinghai-Xizang Plateau from 1979 to 2014.The dotted areas with 90% confidence level |
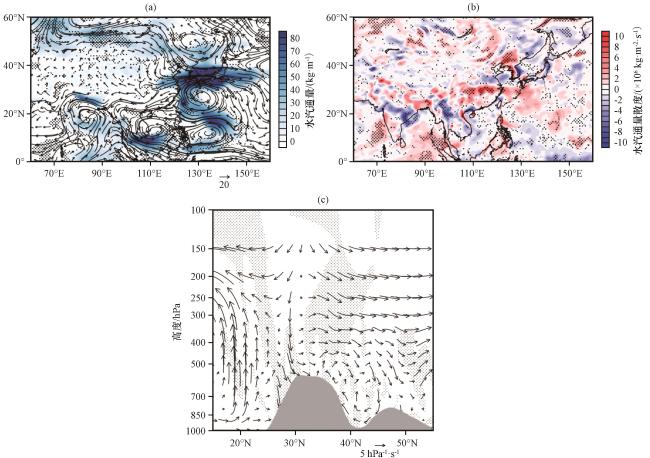
图8 1979 -2014年青藏高原5月土壤湿度异常偏高年减去偏低年合成的7月整层水汽通量(a, 彩色区和矢量, 单位: kg·m-1)、 整层水汽通量散度(b, 彩色区, 单位: ×10-6 kg·m-2·s-1)和垂直速度(c, 矢量, 单位: hPa·s-1)差值打点区域为通过了90%置信度检验, (c)中阴影部分为青藏高原地形 Fig.8 The difference of whole layer water vapor flux (a, color area and vector, unit: kg·m-1), whole layer water vapor flux divergence (b, color area, unit: ×10-6 kg·m-2·s-1) and vertical velocity (c, vector, unit: hPa·s-1) between the abnormally high soil moisture and the low soil moisture in May over the Qinghai-Xizang Plateau from 1979 to 2014.The dotted areas with 90% confidence level, and the shaded area in Fig.8(c) is the topography of the Qinghai-Xizang Plateau |