
1 引言
2 方案设计
表1 试验参数化方案选择Table 1 Selection of parameterization scheme |
| 参数化方案 | 参数化方案 |
|---|---|
| 侧边界方案 | 指数松弛方案 |
| PBL方案 | Holsting |
| 积云参数化方案 | MIT-Emanuel |
| 大尺度降水 | SUBEX |
| 海洋表面通量方案 | Zeng |
| IPCC方案 | A1B |
3 结果分析
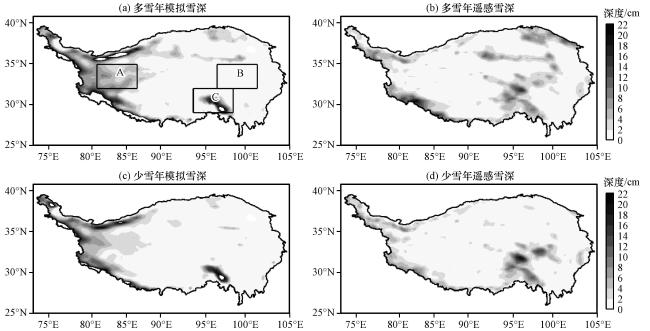
3.1 积雪深度
3.2 土壤温湿度观测值与模拟值
表2 多雪年、 少雪年模拟与观测土壤温度偏差统计Table 2 Soil temperature deviation of simulation and observation in high and low snowfall years |
| 试验区 | 参数 | 5 cm | 10 cm | 20 cm | 40 cm | ||||
|---|---|---|---|---|---|---|---|---|---|
| 2012年 | 2014年 | 2012年 | 2014年 | 2012年 | 2014年 | 2012年 | 2014年 | ||
| 玛多 | R | 0.96 | 0.96 | 0.97 | 0.96 | 0.97 | 0.96 | 0.97 | 0.96 |
| ME/℃ | -4.30 | -2.99 | -3.98 | -2.86 | -3.90 | -2.65 | -3.61 | -2.43 | |
| RMSE/℃ | 4.82 | 3.54 | 4.49 | 3.32 | 4.42 | 3.09 | 3.97 | 2.80 | |
| 那曲 | R | 0.97 | 0.95 | 0.98 | 0.96 | 0.97 | 0.96 | 0.97 | 0.97 |
| ME/℃ | -5.08 | -5.03 | -5.63 | -5.39 | -5.28 | -5.27 | -5.30 | -5.67 | |
| RMSE/℃ | 6.10 | 5.52 | 6.50 | 5.83 | 6.25 | 5.70 | 6.04 | 6.01 | |
相关系数R均通过了0.01的显著性水平检验 |
表3 多雪年、 少雪年模拟与观测土壤湿度偏差统计Table 3 Soil moisture deviation of simulation and observation in high and low snowfall years |
| 试验区 | 参数 | 5 cm | 10 cm | 20 cm | 40 cm | ||||
|---|---|---|---|---|---|---|---|---|---|
| 2012年 | 2014年 | 2012年 | 2014年 | 2012年 | 2014年 | 2012年 | 2014年 | ||
| 玛多 | R | 0.82 | 0.74 | 0.86 | 0.72 | 0.87 | 0.80 | 0.87 | 0.78 |
| ME/% | 3.50 | 2.77 | 3.41 | 3.02 | 2.52 | 1.98 | 5.20 | 4.82 | |
| RMSE/% | 5.18 | 4.91 | 4.00 | 4.33 | 3.34 | 3.45 | 5.36 | 5.13 | |
| 那曲 | R | 0.68 | 0.88 | 0.89 | 0.78 | 0.82 | 0.73 | 0.83 | 0.72 |
| ME/% | 4.18 | -0.53 | -5.00 | -6.87 | 0.72 | 0.03 | -0.07 | 0.20 | |
| RMSE/% | 5.32 | 4.62 | 6.68 | 9.22 | 2.11 | 2.67 | 1.76 | 2.34 | |
相关系数R均通过了0.01的显著性检验 |
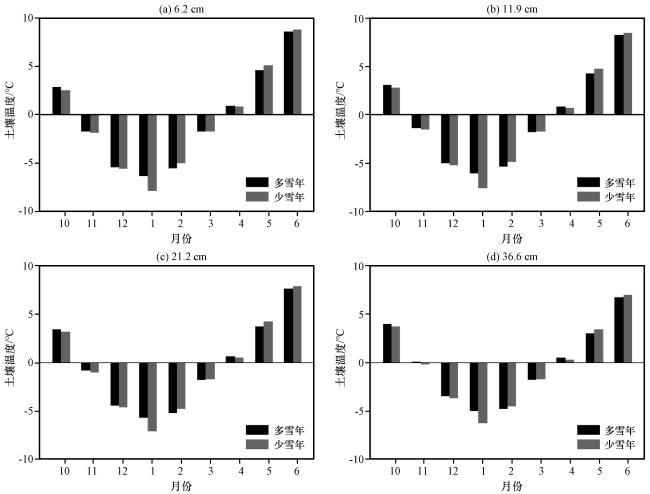
3.3 多、 少雪年土壤温度对比
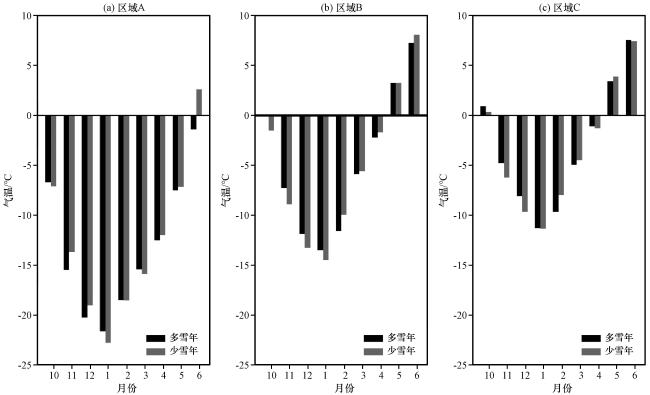
图2 三个区域多雪年和少雪年月平均气温Fig.2 Monthly mean air temperature of the three regions in high and low snowfall years |
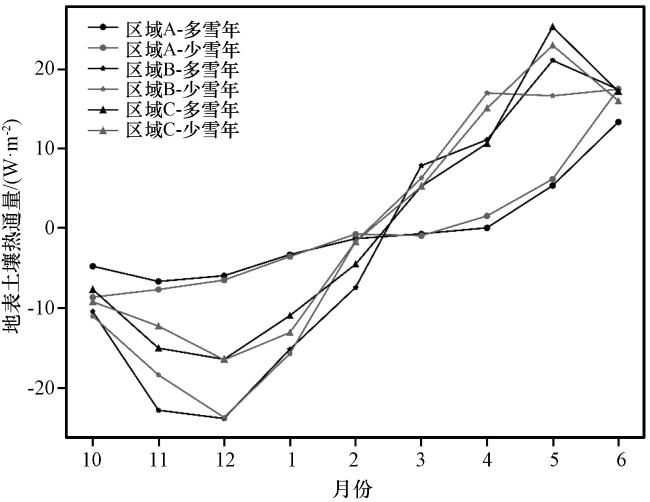
图3 三个区域多雪年和少雪年月平均地表土壤热通量Fig.3 Monthly mean surface soil heat flux of the three regions in high and low snowfall years |
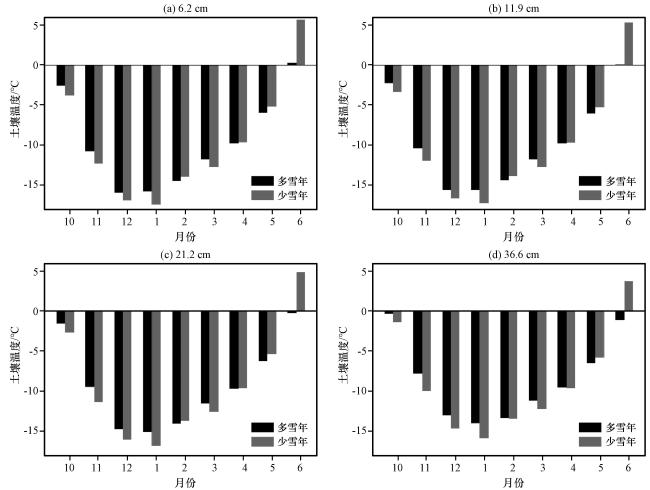
图4 区域A多雪年和少雪年不同深度月平均土壤温度变化Fig.4 Monthly mean soil temperature change of different depths in high and low snowfall years in region A |
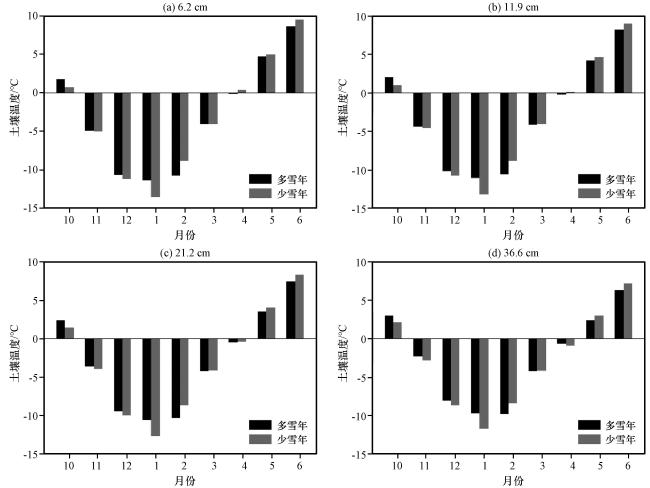
图5 区域B多雪年和少雪年不同深度月平均土壤温度变化Fig.5 Monthly mean soil temperature change of different depths in high and low snowfall years in region B |
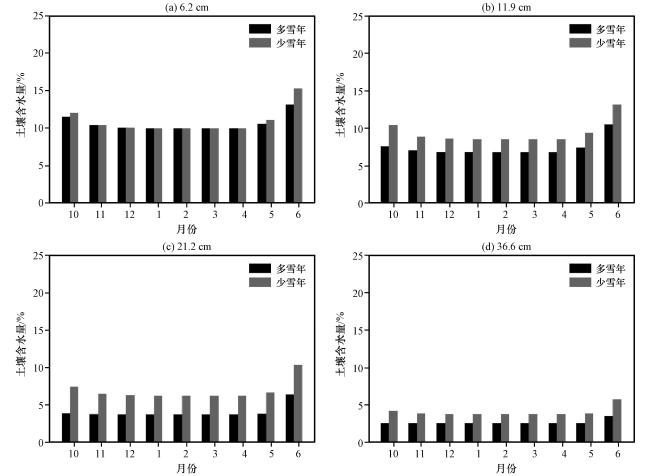
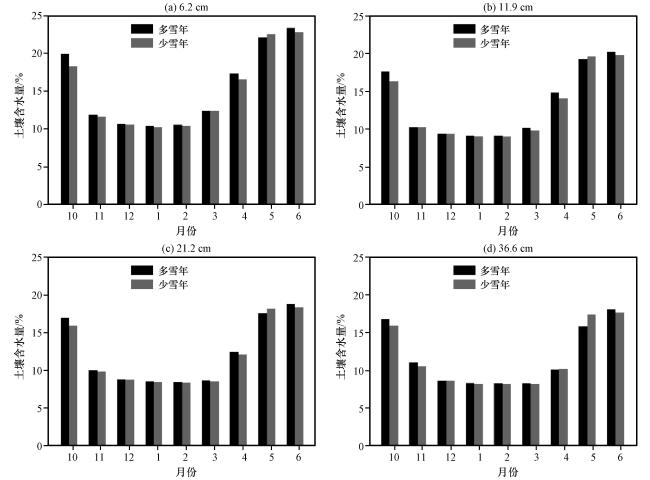
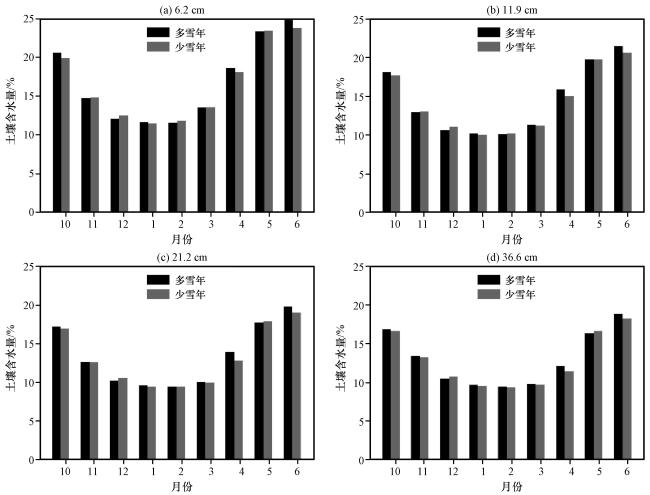
3.4 多、 少雪年土壤湿度对比
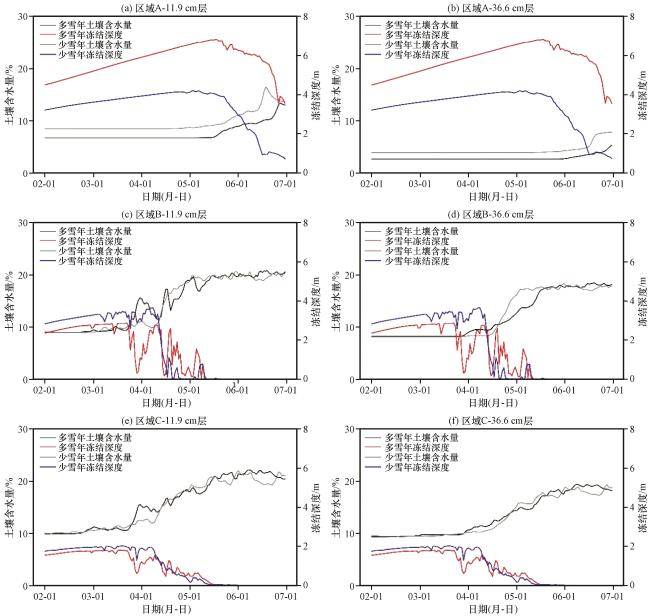
图7 三个区域多雪年与少雪年2 -6月土壤含水量与冻结深度逐日变化Fig.7 The daily variation of the soil water content and freezing depth of the three regions from February to June in high and low snowfall years |