

1 引言
水汽作为重要的温室气体, 无论是对太阳辐射的吸收、 散射和反射, 还是参与云的形成, 都会影响大气中的辐射和热量平衡, 从而改变天气气候系统的敏感度(曾钰婷等, 2020)。此外, 陆表的水分在太阳辐射等作用下通过蒸发蒸腾作用, 形成水汽进入大气, 然后在大气环流的作用下, 通过水汽输送参与到成云致雨的过程, 进而形成降水, 影响陆面过程的能量和水分循环。其中水汽输送作为大气水循环的主要过程(Held et al, 2000), 是大气水循环研究的重点。水汽的垂直输送会影响对流过程, 其水平传输会改变区域水汽条件, 从而影响下游地区的降水(康红文等, 2005; 常姝婷等, 2019; Guan et al, 2019)。而在输送过程中, 水汽含量、 输送路线以及输送强度等都会对空中水资源和陆面过程的能量水分循环产生重要影响(许建伟等, 2020)。此外水汽输送过程中还会伴有动量和热量的转移, 从而影响沿途的气温等气象因子的改变, 对沿途天气过程以及气候系统产生影响。因此研究大气水汽输送过程有着重要意义。
水汽输送是导致区域降水和旱涝的关键因素, 针对水汽输送的研究已经开展了很多工作。徐祥德等(2002)提出高原水汽输送“大三角扇型”是影响中国及东亚旱、 涝异常的主要成因。Xu et al(2008, 2014)指出高原的水汽含量和降水的增加可能会使下游地区洪涝灾害的概率增加。李耀辉等(2013)探讨了青藏高原的极端干旱和湿润事件与北大西洋/欧洲地区的环流异常的关系。Zhang et al(2016)认为由西风急流和印度季风分别携带的水汽导致了青藏高原的降水, 并分析了两条水汽输送路径的变化特征。刘菊菊等(2019)利用ERA-Interim再分析资料分析青藏高原夏季水汽输送状况, 指出与高原夏季云水含量相联系的4条水汽通道: 印度洋通道、 南海通道、 伊朗西部通道、 孟加拉湾北部通道。陈丹等(2019)利用NCEP/NCAR再分析资料对夏季青藏高原及周边热源与四川盆地暴雨的关系进行研究, 指出副高偏西偏北时, 阿拉伯海、 孟加拉湾水汽输送增强, 盆地西部暴雨偏多, 东部暴雨偏少, 而副高偏东时, 东南沿海的水汽输送增强, 导致盆地西部暴雨偏少, 东部暴雨偏多。胡梦玲等(2019)基于ERA-Interim逐日再分析资料分析青藏高原南侧经圈环流的变化特征, 认为夏季季风环流增强时, 高原南侧来自孟加拉湾和印度洋的水汽输送增强。
以上的研究工作大都基于再分析资料展开。近年来, 有学者基于FLEXPART(Flexible Particle Dispersion Model)拉格朗日后向轨迹模型开展了一些水汽输送方面的相关工作(Stohl et al, 2004)。相比传统的欧拉方法, 拉格朗日后向轨迹方法可以直接追踪气块在运动过程中的轨迹, 通过气块沿途的水汽含量等参数变化, 模拟潜在蒸发源地的变化。陈斌等(2011)利用FLEXPART对极端降水事件进行模拟, 诊断了极端降水事件的水汽输送路径及其可能蒸发源区, 并定量估算了不同水汽源区对降水事件的相对贡献大小。Sun et al(2015)基于FLEXPART模拟了2000 -2009年期间华南、 长江中下游、 华北三个区域的水汽来源, 认为华南地区的降水在夏季以来自印度洋的水汽为主, 冬季来自西太平洋, 其他两个区域无论是夏季还是冬季, 都是由来自陆地蒸发的水汽做主要贡献。赵阳(2019)耦合WRF和FLEXPART模式综合分析水汽输送对长江中下游暴雨的影响。朱丽等(2019)利用FLEXPART模型, 对黄河源区夏季异常降水的水汽输送进行模拟, 分析了导致降水异常的水汽输送特征及潜在蒸发源地。Yang et al(2020)基于FLEXPART分析了青藏高原北部1980 -2016年导致夏季降水的水汽输送空间分布格局, 指出降水增加的原因更大程度上归因于大气环流的增强, 从而增加了潜在蒸发源区的蒸发强度和输送强度。
在全球变暖背景下, 针对干旱事件的监测已经成为全球科学家研究的热点, 干旱指数的异常能够有效的反映实际干湿状况, 用于表征干旱特征, 可以作为干旱监测的关键指标(吴志勇等, 2012; Liu et al, 2019; 王素萍等, 2020), 吴志勇等(2012)定义的土壤水分异常百分比指数SMAPI (Soil moisture anomaly percentage index)可以很好地反映干旱事件的发展动态和干旱强度, 可以再现历史干旱事件, 并在一些地区得到应用。此外, 区域面上的土壤湿度表现出很强的空间变异性(Sims et al, 2002), 因此, 结合土壤湿度监测网和干旱指数, 可以评估一个地区的土壤湿度状况(王作亮等, 2019)。
黄河源区位于青藏高原东北部, 是受中纬度西风带和南亚季风共同影响的典型地区, 来自高原北侧的偏北气流和高原南侧的偏南气流在黄河源区形成辐合区, 这种流场有利于黄河源区成为低润、 切变线等天气系统活跃的地区, 这些低值系统为黄河源区水汽辐合提供了动力条件, 而源区自身和外部的水汽输送异常导致的降水减少是黄河源区干旱的重要原因。近年来研究学者从不同的角度, 针对黄河源区气候变化特征和趋势展开了很多的工作, 目前的研究大都基于黄河源区陆表干湿程度演变特征, 即描述干旱特别是极端干旱事件的强度、 范围和起止时间, 但是从空中水资源演变的角度针对三江源干旱物理过程的研究并不多见(杜一博等, 2018; 张林燕等, 2019)。本研究基于黄河源区长时间序列土壤湿度监测网的观测资料, 利用拉格朗日后向轨迹模式, 定量评估不同干湿演变条件下, 强弱干旱事件与水汽输送间的特征关系, 提取极端干旱事件发生时期水汽源地贡献的异常状态, 分析水汽源地的蒸发补给强度的变化, 探讨水汽输送态势对源区干旱的影响程度, 研究结果不仅有助于更好地认识黄河源区水汽源汇区特征和输送特征, 而且有助于深入理解黄河源区陆表干湿演变过程对水汽输送的响应特征和机理。
2 研究区域及资料选取、方法介绍
2.1 研究区域
研究区域位于青藏高原东部, 玛曲县南部的玛曲-若尔盖交界区域(33°30′N -34°10′N; 101°40′E -102°50′E), 是黄河上游的重要产流区(陈子萱, 2008), 是我国典型的内陆湿地类型之一, 也是中国乃至世界上最大的一片高原泥炭沼泽集中分布区之一(赵娜娜等, 2019; 郭洁等, 2007)。研究区域地势表现为西高东低, 由西北向东南倾斜, 而气温与降水都呈现从东南向西北递减的趋势。该地区海拔为3300~4806 m, 平均海拔3600 m, 多年平均降水量505 mm, 年平均气温2 ℃, 受青藏高原和季风性大陆气候的影响, 寒冷湿润, 表现为夏季多雨而冬季干燥的气候(赵娜娜等, 2019)。
2.2 资料选取
2.2.1 土壤湿度观测资料
土壤湿度观测资料来自“黄河源区玛曲-若尔盖土壤温湿监测网络”。该网络于2008年设立于中国甘肃省玛曲县黄河源区(33°30′N -34°15′N; 101°38′E -102°45′E), 隶属于中国科学院寒旱区陆面过程与气候变化重点实验室。网络的建立确保了对玛曲地区土壤水分空间变异性的良好监测, 在每个站点收集的测量值的空间平均值可以看作网络规模土壤水分动态的准确指标, 并且该网络获取的数据可以用来验证从粗分辨率卫星获取的土壤水分产品, 并进行数值模拟(Su et al, 2011; Dente et al, 2012a)。监测网络由20个站点组成, 这20个站点架设在典型的山谷、 河流、 湿地、 草地和裸地等下垫面, 面积约为40 km×80 km。该网络可以监测不同坡度, 不同土壤层分的地表以下5~80 cm的土壤温度和水分, 监测时间间隔为15 min(Su et al, 2011; Dente et al, 2012b)。
2.2.2 再分析资料
所使用的再分析数据资料是由美国国家环境预报中心提供的最终分析场数据NECP FNL(National Centers for Environmental Prediction Final), 包括风湿温压以及空气密度, 边界层高度等气象要素数据, 其空间分标率1°×1°, 时间分辨率为6 h, 分别为00:00(世界时, 下同), 06:00, 12:00, 18:00这4个时刻的数据。垂直方向上包括有1000~10 hPa共26层, 而2016年5月11日12:00之后的FNL数据在垂直方向新增了1、 2、 3、 5、 7 hPa共5层。FNL资料分辨率相对较高且融合了大量的观测资料及卫星反演资料, 被广泛用于数值模式及天气、 气候的诊断分析研究中, 周青等(2008)曾用FNL资料与中国753个台站的实测资料进行了分析, 指出FNL地表温度资料能较好的反映地表温度状况, 但某些站点比实测数据偏低。Dong et al(2017)将青藏高原东部和下游区域的来自FNL的水平风场、 温度、 相对湿度同探空资料进行对比, 指出风场、 温度的平均值与探空资料一致, 平均相对湿度的偏差相对较大。苏彦入等(2018)利用中国地面气候资料日值数据集对FNL等再分析资料进行对比分析, 结果发现虽然青藏高原地区再分析资料与实测资料存有误差, 但其分布特征和变化特征具有一定的一致性, 仍具有可用性。综上所述, 在本研究中使用FNL再分析数据资料的可行性较高。因此在研究中, 将选取2008年6月至2017年6月的FNL数据, 该数据将用做环境场以驱动FLEXPART模式进行后向模拟。
2.3 方法介绍
2.3.1 模式及参数设置
FLEXPART是基于拉格朗日观点的粒子传输和扩散模型, 最初用于模拟污染物扩散, 而现在已经越来越多的应用于大气传输模拟分析。该模式可以模拟研究区域内气块的运动轨迹, 追踪气块的三维位置(经纬度, 垂直高度), 通过运动过程中的湿度、 温度、 空气密度等参数的变化, 实现对大气传输过程的模拟。模型具有两种模式, 分别是前向与后向过程, 其中前者用于模拟各种排放源排放的物质的扩散过程, 而后者则用于模拟研究区域内某物质的来源及从来源排放之后的输送过程。在本研究中, 使用FNL数据作为输入资料以驱动模型运行, 模型的时间积分步长设置为6 h; 运用“区域填塞”技术将研究区域内的大气均匀划分为200万个气块; 排放区域的范围是33°N -34.5°N, 101°E -102.5°E, 垂直高度范围设置为3000~16000 m; 模式的后向模拟时间设置为10天, 即从粒子释放时间开始后向追踪10天, 这是水汽在大气中的平均停留时间(Trenberth, 1998)。模型运行后会输出模拟过程中每个气块的三维位置, 并通过再分析资料的空间插值获取模拟过程中位涡、 比湿、 空气密度等物理信息(陈斌等, 2011)。
2.3.2 土壤湿度异常百分比指数(SMAPI)
使用土壤湿度异常百分比指数SMAPI(Soil Moisture Anomaly Percentage Index)来表征土壤的干旱程度。SMAPI是为了表征大面积的农业干旱而开发的(Wu et al, 2011), 近年来已经有很多基于SMAPI的研究(黎小燕等, 2014; 吴志勇等, 2018, ; 王作亮等, 2019)。SMAPI定义为当前土壤含水量与多年同期土壤平均含水量之差占多年同期土壤平均含水量的百分比。它是一种相对干旱指数, 反映土壤水分偏离正常态的干旱指数, 其计算公式如(1)所示(Wu et al, 2011; 吴志勇等, 2018; 王作亮等, 2019):
式中: 为当前土壤含水量; 为多年同期土壤平均含水量。并且为了更清晰的表示不同深度处土壤湿度的状态, 本文还同时计算了不同深度处土壤的SMAPI, 即SMAPI-t(t代表不同深度处, 例如5.0 cm处SMAPI即为SMAPI-5.0 cm)。而基于SMAPI的干旱程度划分标准依据Wu et al(2011)的研究(表1 )。
表1 基于SMAPI的干旱程度划分Table 1 Classifying drought level corresponding to SMAPI |
| 干旱等级 | SMAPI |
|---|---|
| 极端湿润 | >50% |
| 非常湿润 | 30%~50% |
| 中等湿润 | 15%~30% |
| 轻微湿润 | 5%~15% |
| 正常 | -5%~5% |
| 轻微干旱 | -15%~-5% |
| 中度干旱 | -30%~-15% |
| 严重干旱 | -50%~-30% |
| 极端干旱 | ≤-50% |
2.3.3 水汽蒸发源区的识别方法
本研究基于拉格朗日后向轨迹模型, 根据气块运动过程中的比湿变化追踪气块内水分含量产生变化的区域。首先假设气块运动过程中的水分含量变化是由气块降水以及地表蒸发影响造成的, 其中地表蒸发造成气块内水分含量增加, 气块降水导致水分含量减少。因此, 对于单个气块的水分收支有:
式中: e为单位时间步长 内地表蒸发进入气块的水分; p为单位时间步长 内气块降水失去的水分; 为比湿的变化。又假定某面积为A的区域的三维大气由N个质量相对均匀的气块构成, 由单个气块的水分收支方程(2)可以推得整个区域平均的水分收支方程:
式中: E, P分别是区域平均的地表蒸发量和气块降水量。当N的数值取得足够大的时候, 计算的结果才足够精确。根据式(3) , 利用气块运动过程中比湿的变化而判断气块内含水量的变化, 从而判断该区域是否为水汽源地, 即根据计算结果E-P的正负值判断该区域是否为水汽源地: 当E-P为正值时, 代表该区域地表蒸发量大于气块的降水量, 气块内的水分得到补充, 可以判定为水汽源地; 当E-P为负值时, 代表该区域地表蒸发量小于气块的降水量, 气块内的水分减少, 可以判定为水汽的汇。此外, 可以根据E-P的数值大小判断水汽源地或者水汽汇的强度。这种方法的优点在于用一种简洁的方法解释了大气水分的收支, 而不用考虑其收敛作用(Sun et al, 2014)。但需要注意的是公式(3) 计算的是E-P的整体, 而不是单独的E或者P, 此外这个方法只认为大气边界层高度以下的气块水分含量增加才有意义, 因为水汽蒸发是发生在地表的过程, 而在大气边界层高度之上的水分增加可能是因为对流、 降水的再蒸发以及计算误差等因素导致(陈斌等, 2011)。
3 基于SMAPI指数的干旱特征分析
本研究基于土壤湿度观测网的观测资料, 结合SMAPI指数, 计算了2008年6月至2017年6月不同土壤深度的SMAPI指数。由图1 可知, 2008年6月至2017年6月干湿交替过程大概划分为(王作亮等, 2019): (1)2008年6月至2009年8月: 目标区域不同土壤深度的SMAPI指数大致都先降低然后升高, 即指目标区域先处于湿润状态然后变干, 接着再变为湿润状态, 其中干旱状态持续时间较短, 干旱强度也较轻; (2)2009年9月至2011年3月: 这段时间的SMAPI指数总体上呈现降低趋势, 除了2010年8月指数出现增长, 表现出明显的湿润状态, 目标区域都表现为缓慢变干的趋势, 并在2010年底至2011年呈现一段较为稳定的干旱期; (3)2011年4月至2011年12月, 期间研究区域存在明确的变湿润的过程, 并于2011年秋季出现了非常湿润的状况(SMAPI-10 cm=52.013%), 这段时期为整个研究时段期间上最为湿润的时期。(4)2011年12月至2016年6月时间段内虽然有干湿交替变化过程, 但是整体有明显的缓慢变干的趋势, 期间出现了自2008 -2017年6月以来最为稳定、 持续时间最长的干旱时期, 其中5, 10, 20, 40和80 cm土壤出现了持续的明显的干旱, 在2015年8月期间出现了严重干旱状态(SMAPI-5=-47.398%, SMAPI-10=-43.044%, SMAPI-20=-40.671%), 而干旱一直持续到了2016年6月以后才开始逐渐有所缓解。
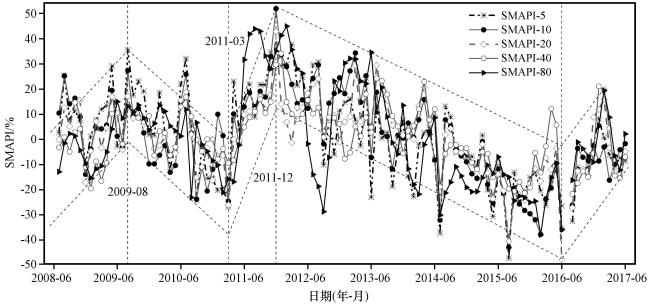
图1 2008-2017年不同深度土壤SMAPI月指数时间序列(王作亮等, 2019)Fig.1 Time series of SMAPI at different depths from July 2008 to June 2017(From Wang et al, 2019) |
4 研究区干湿演变过程中水汽输送路径的变化
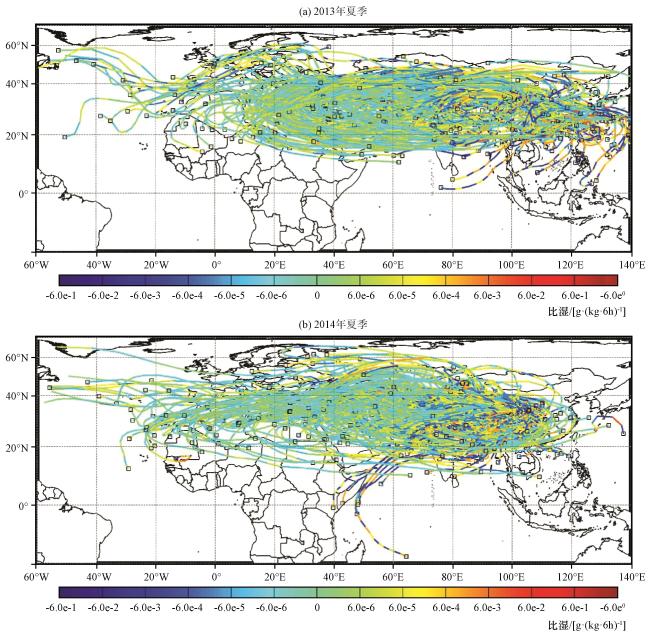
基于SMAPI指数分析了2008年6月至2017年6月期间目标区域的干旱状态, 并划分为不同时期。为了进一步分析目标区域在土壤不同干湿状态时气块运动的轨迹, 本研究提取十年期间最为湿润和最为干旱时段, 基于FLEXPART模式对到达目标区域的水汽展开后向轨迹追踪。由图1 可知, 2011年12月至2016年6月是十年期间持续时间最长的由湿润状态到干旱状态的过渡期, 所以本研究选取2012年夏季与2015年夏季为湿润和干旱的典型目标时段, 同时选取2013年夏季和2014年夏季为湿润到干旱的演变时期, 从水汽输送的角度分析空中水资源的变化情况。为了最大程度的清晰显示轨迹路线, 将FLEXPAT模式模拟的粒子, 每隔2000条画一条轨迹, 同时图中黑色小方框代表后向运动轨迹的终点(即水汽输送轨迹的起点), 轨迹线条不同的颜色代表粒子在运动过程中的比湿变化, 暖色调代表在运动过程中粒子得到当地蒸发等带来的水汽补充, 冷色调代表粒子在运动过程中产生降水等过程导致了水汽减少。
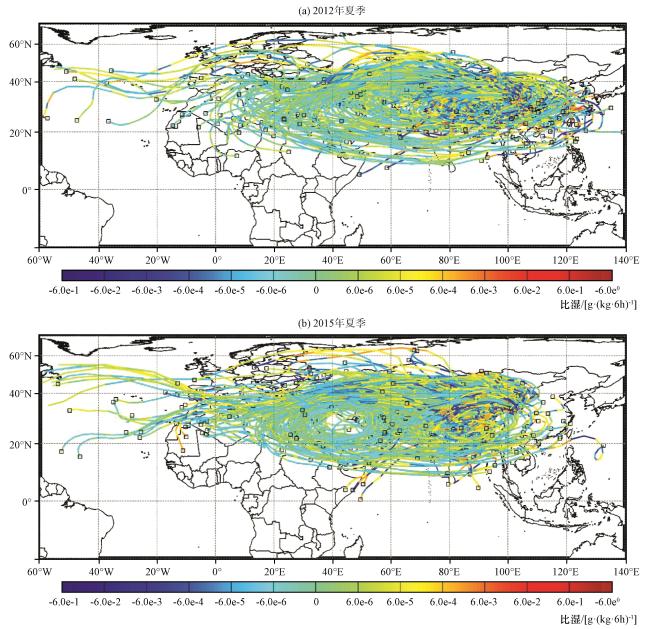
图2 2012年夏季和2015年夏季研究区域水汽输送粒子的后向轨迹(1~10天)图中轨迹颜色表示气块比湿变化[单位: g·(kg·6h)-1] Fig.2 Backward trajectories (1~10 days) of water vapor transport particles arrived at the target region in summer of 2012 and 2015.The track color indicator the change of specific humidity of gas[unit: g·(kg·6h)-1] |
从土壤湿度处于湿润状态到干旱状态的演变时期(下称演变时期)的轨迹图上(图3 )可以发现, 主要的输送路径和湿润、 干旱时期差异不大, 都可以分为北支、 东支、 南支三条路径, 但是与湿润时期和干旱时期的路径分布不同的是, 分布于大西洋附近区域的北支路径起始点比湿润时期更多, 北支路径的密度相对于湿润时期更大, 演变时期的北支路径发挥了比湿润时期时更大的作用。而南支路径的表现则要比干旱时期更强, 在演变时期的南支、 北支两条路径的密度差异也不如湿润时期和干旱时期时显著。东支路径的起始点较湿润、 干旱时期(见图2 )更为偏南, 集中在东海-台湾岛一带, 东支路径也明显密于干旱时期。此外, 对比图2 、 3 可以发现, 当处于演变时期时, 分布在3条路径上的水汽补充区(轨迹颜色暖色调区)差异不大。综上可知, 3条路径共同主导了湿润状态到干旱状态演变时期的水汽输送。
5 潜在蒸发源地蒸发特征
粒子轨迹图表示了研究区在目标时段气块的路径以及运动过程中比湿的变化, 但是这都只是定性的表述, 并没有准确给出对应的水汽源的量化表述。因此采用上述中介绍的水汽源地的识别方法, 将粒子运动过程中的比湿信息网格化在1°×1°的经纬度网格上, 从而获取的水汽潜在蒸发源地的分布和蒸发强度。
从图4 中可以发现, 当处于湿润时期时, 水汽源地主要分布在青藏高原上昆仑山脉附近, 包括昆仑山脉北侧的塔里木盆地、 阿尔金山脉及柴达木盆地以及南侧的藏北高原等地, 此外还分布在伊朗高原及帕米尔高原, 喜马拉雅山脉南麓-横断山脉一带, 四川盆地-秦岭一带, 祁连山-黄土高原一带, 长江中下游附近及华东、 华南等地区, 印度半岛、 孟加拉湾北部; 演变时期, 水汽源地主要分布在喜马拉雅山南麓-横断山脉、 孟加拉湾、 印度半岛以及四川盆地、 云贵高原、 南海附近, 此外在帕米尔高原和伊朗高原也分布着水汽源地, 而青藏高原上的水汽源地分布比较零散, 并没有如同湿润时期一样集中在昆仑山脉, 但南北两侧都分布有水汽源地, 包括塔里木盆地、 阿尔金山脉、 柴达木盆地以及冈底斯山脉-雅鲁藏布江一带。当处于干旱时期时, 水汽源地主要分布在青藏高原北部天山山脉附近, 其中在阿尔泰山、 准葛尔盆地都有水汽源地存在, 青藏高原南部也零星分布着较弱的水汽源地, 一直到喜马拉雅山南麓-横断山脉一带有较强的水汽源地, 伊朗高原、 帕米尔高原也是较强的水汽源地, 此外还包括印度半岛、 孟加拉湾以及四川盆地-秦岭、 祁连山-黄土高原一带。
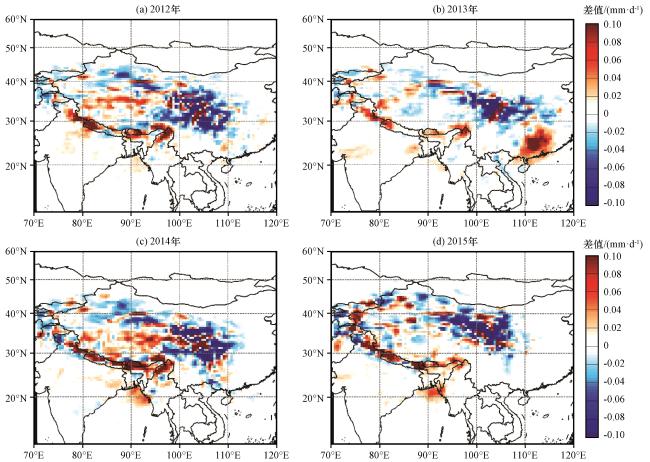


综合对比三个时期的水汽源地可以发现, 在青藏高原上, 湿润时期的水汽蒸发高值区主要位于昆仑山脉附近, 整体偏向青藏高原南部, 演变时期青藏高原的水汽源地分布较为零散, 但在2014年高原东部聚集了大范围的高强度水汽源地, 高原南部的水汽源地明显强于北部, 到了干旱时期, 高原上的水汽源地则集中在北部, 甚至在阿尔泰山、 准葛尔盆地都有水汽源地存在。祁连山-黄土高原一带的水汽源地在演变时期减弱, 但在干旱时期重新加强, 甚至变得比湿润时期更强, 而四川盆地-秦岭一带的水汽源地则是在演变时期加强, 但在干旱时期减弱到比湿润时期更弱的状态。喜马拉雅山南麓上的水汽源地在三个时期都很重要, 其中尼泊尔境内的水汽源地在演变时期减弱后立即加强, 东段-横断山脉西侧的水汽源地在干旱时期强度减弱。伊朗高原、 帕米尔高原以及孟加拉湾附近的水汽源地表现为从湿润时期到演变时期再到干旱时期逐渐加强的特征, 印度半岛、 长江中下游及华东附近的水汽源地则刚好相反, 表现为从湿润时期到演变时期再到干旱时期逐渐减弱的特征, 其中长江中下游及华东附近的的水汽源地在干旱时期甚至没有继续存在; 云贵高原-海南岛、 华南等地的水汽源地从湿润时期到演变时期再到干旱时期表现为演变时期有加强, 但在干旱时期消失的特征。
不同时期的水汽源地的变化特征与其相应的水汽输送路径有关, 湿润时期东支路径与南支路径起主导作用, 而干旱时期则是北支路径发挥着更重要的作用, 与之对应, 干旱时期青藏高原上的水汽源地分布比湿润时期偏北, 而长江中下游、 华东、 华南、 云贵高原、 印度半岛等位于南支路径和东支路径上的水汽源地在干旱时期强度极弱, 甚至消失。其中孟加拉湾的水汽源地在干旱时期增强, 可能是由阿拉伯海变暖引起的孟加拉湾异常反气旋造成(Sun et al, 2018)。
6 结论与讨论
基于“黄河源区玛曲-若尔盖土壤温湿监测网络”获取的土壤湿度观测资料, 通过计算土壤湿度异常百分比指数(SMAPI)捕捉十年间黄河源区的干旱事件以及干湿演变过程, 结合NCEP FNL再分析资料驱动FLEXPART模式模拟典型的干旱事件以及干湿演变过程中气块运动轨迹, 分析研究区在目标时段水汽输送的空间分布格局。主要得出以下结论:
(1) 针对目标时段, 研究区域的外部水汽大致通过3条轨迹进入黄河源区: ①南支输送。始于印度洋、 阿拉伯海的水汽, 通过印度半岛、 孟加拉湾, 从青藏高原西南侧进入黄河源区; ②东支输送。来自太平洋、 南海等地的水汽从华东/华南地区登录中国大陆, 途径长江流域, 从青藏高原东侧或者南侧以及西侧进入黄河源区; ③北支输送。来自大西洋、 非洲大陆北部和欧洲大陆的水汽, 穿过中纬度亚欧大陆, 从青藏高原西部或者北部进入黄河源区。其中依据干旱指数得出的干旱时期的外部水汽输送路径以北支输送为主, 湿润时期的水汽主要来自南部和东部的海洋。
(2) 湿润时期时, 水汽源地主要分布在青藏高原昆仑山脉附近、 伊朗高原及帕米尔高原, 喜马拉雅山脉南麓-横断山脉一带, 四川盆地-秦岭一带, 祁连山-黄土高原一带, 长江中下游附近及华东、 华南等地区, 印度半岛、 孟加拉湾北部; 演变时期时, 水汽源地主要分布在青藏高原东部、 伊朗高原及帕米尔高原, 喜马拉雅山脉南麓-横断山脉一带, 四川盆地-秦岭一带、 华南-海南岛附近, 印度半岛及孟加拉湾; 干旱时期时, 水汽源地主要分布在青藏高原北部天山山脉附近, 甚至更北的阿尔泰山、 准葛尔盆地, 而在高原南部则是零星分布着一些强度较弱的水汽源地, 一直往南到喜马拉雅山南麓-横断山脉一带的较强的水汽源地, 此外伊朗高原、 帕米尔高原、 印度半岛、 孟加拉湾、 四川盆地-秦岭及祁连山-黄土高原一带都分布有水汽源地。
(3) 对比三个时期的水汽源地可以发现, 青藏高原上从湿润时期到干旱时期的水汽源地分布表现出了整体偏南分布到偏北分布的特征。祁连山-黄土高原一带的水汽源地在演变时期减弱, 但在干旱时期重新加强, 甚至变得比湿润时期更强, 而四川盆地-秦岭一带的水汽源地则是在演变时期加强, 但在干旱时期减弱到比湿润时期更弱的状态。喜马拉雅山南麓上的水汽源地在三个时期都表现强烈, 伊朗高原、 帕米尔高原以及孟加拉湾附近的水汽源地从湿润时期到干旱时期逐渐加强, 印度半岛、 长江中下游及华东附近的水汽源地则刚好相反, 其中长江中下游及华东附近的的水汽源地在干旱时期甚至没有继续存在; 云贵高原-海南岛、 华南等地的水汽源地从湿润时期到演变时期再到干旱时期表现为演变时期有加强, 但在干旱时期消失的特征。
本研究以地表土壤湿度为切入点, 通过干旱指数来分析发生区域干旱事件时水汽输送的空间分布格局和潜在源区的变化, 并未定量化源地蒸发对降水的贡献, 但朱丽等(2019)研究分析了黄河源干旱年份以及湿润年份不同区域蒸发对黄河源降水的贡献, 指出黄河源局地蒸发在干旱年和湿润年的贡献分别为22%和11%。此外需要注意的是, 本文划分干湿的基础是来自土壤湿度网的长期监测, 然后通过计算的到土壤湿度异常百分比指数SMAPI, 这个指数可以较好地反映区域干旱的发生, 但是因为水汽输送导致的降雨对土壤湿度的值有滞后性, 而且还有水分内循环带来的降水, 所以本文的工作存在一定的误差。